21760 Shady Trail Rd · Chandler, TX
Flood risk 1/10 · Minimal
- FEMA flood zone
- X (unshaded)
- Chance of flooding over 30 yrs
- 0.0%
- Est. flood insurance / yr
- $507 – $1,088
Fire risk 3/10 · Minor
- Est. fire insurance / yr
- $1,222 – $2,270
Heat risk 7/10 · Major
- Hot days now (above 109°F)
- 7 days/yr
- Hot days in 30 yrs
- 26 days/yr
Wind risk 6/10 · Moderate
- Chance of severe wind over 30 yrs
- 77.0%
Air-quality risk 1/10 · Minimal
- Unhealthy air days now
- 0 days/yr
- Unhealthy air days in 30 yrs
- 0 days/yr
Risk factors via First Street. Map © Google.
Why this score? — see what drove the D+ grade
The composite is a weighted blend of 9 inputs, each scored 0–100. Each bar is that input's sub-score; the figure is the points it added to the 100-point composite (weight × sub-score).
- ARV discount +15.0/15.0
- Cash flow +13.9/30.0
- DSCR +4.2/10.0
- 1% rule +3.9/10.0
- Schools +3.7/10.0
- Livability +3.5/5.0
- Rent growth +2.5/5.0
- Condition / age +2.5/5.0
- Appreciation +0.0/10.0
$145,900
🖨 Deal sheet (PDF) 📄 Offer letter ✓ Due diligence
Listing remarks MLS
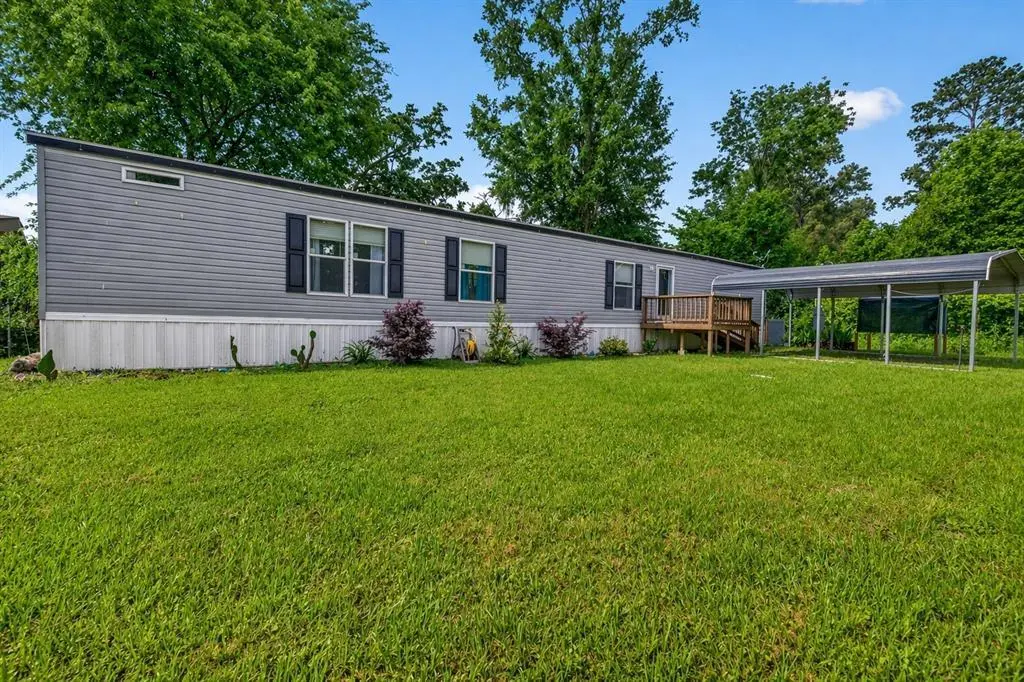
Well-maintained 2020 single-wide manufactured home located in the Westwood Beach subdivision in Chandler. This 3 bedroom, 2 bathroom home offers 1,216 square feet of comfortable living space with a functional layout and a clean, move-in ready feel. The home has been well cared for and is ideal for a primary residence, weekend getaway, or investment opportunity. Conveniently located near Lake Palestine with easy access to Chandler and surrounding areas.
Key facts
- 1,917 sq ft lot
- 2 parking spots
- Built 2020
Tags
Neighborhood map
What this means for you Summary
Snapshot
- This is a 3-bed/2.0-bath manufactured listed at $146k.
Deal economics
- At list price, monthly cash flow is $15 ($177/yr) — positive.
- The deal already cash-flows at list — no discount required.
- To meet the 1% rule (rent ≥ 1% of price), the offer needs to be $130k (10.9% below list).
- Recommended offer: $130k (10.9% below list) — sets the bar for 1% rule.
- Cap rate 6.4% vs local median 3.8% in Chandler — top-decile yield for the area; either an underpriced asset or a hidden risk that comps aren't pricing in. Stress-test before assuming the spread holds.
Location & tenants
- Location reads 70/100 on livability (#347 in TX) — a middle-class / working-renter tenant base. Strengths: crime A+, cost of living A+, housing A+; Watch: schools D+, amenities F, commute F.
- Brownsboro ISD (rural): math 42% / reading 46% proficiency, ranked #290 of 826 in TX (top 35%) — families likely to look elsewhere, expect single-tenant / working-renter base with shorter leases.
- Market conditions: 225 active listings in the ZIP; 1 comparable units currently listed for rent nearby; 263 units permitted in Henderson County in 2024 (0 in 5+ unit buildings).
Forward outlook
- Local home prices are declining (-3.0%/yr); year-one equity from $1k of loan paydown is wiped out by about $4k of value loss. Plan a longer hold.
Negotiation context
- It's been on market 60 days — a 3% lower offer ($142k) is reasonable based on typical stale-listing flexibility.
- 6 sale attempts since 5y ago with the ask held roughly flat each time — persistent listings suggest the price (not the market) is what's stuck; bring a comps-based counter.
Risks & watch-outs
- Climate carrying-cost: major wind risk, 77% chance of damaging wind over 30y; extreme-heat days projected 7→26/yr by 2055 (HVAC capex compounding) — expect insurance premiums to compound above CPI over the hold.
Questions for the listing agent
- It's been on market 60 days. Have you received any prior offers? Is the seller open to a 11% concession, seller financing, or rate buy-down credit?
- What does the HOA fee cover, when was the last increase, and are there any pending special assessments or reserve-fund shortfalls?
- Is there a deadline driving the sale (1031 exchange, divorce, estate, relocation)? That informs how much negotiation room exists.
- Schools are D-rated, which usually means shorter tenancies and higher turnover. Who's the typical renter profile here, and what's been the actual vacancy rate?
- The area grade is low — what's the realistic commute time and amenity access for the typical tenant pool here? Any planned neighborhood developments (good or bad) we should know about?
- What's the average days-on-market for RENTAL listings here right now (not sales)? A rising rental-DOM trend means longer vacancies and softer asking-rent achievability than the comps imply.
- What's the recent tenant-quality profile in this submarket — average credit score on applications, eviction rate, late-payment / NSF rate, and stable-employment percentage? A property-management company in the area should have these aggregated.
- How much new for-sale + rental construction is in the pipeline within 1–3 miles? Heavy new supply typically softens prices + rents 12–24 months out; constrained supply supports both.
Investment metrics
- 1% rule
- 0.89% ✗
- Cap rate
- 6.41%
- Cash-on-cash
- 0.43%
- DSCR
- 1.02
- GRM
- 9.4
CMA / ARV
- ARV (median comp)
- $220,904
- List price
- $145,900
- Delta
- -33.95%
- Verdict
- UNDERPRICED
- Comps
- 9 within 1.0 mi
Show comp detail 3 sales within ~0.75 mi
| Address | Dist | Beds/Ba | Sqft | Sold | Price | $/sf | Match |
|---|---|---|---|---|---|---|---|
| 21605 Sundown Rd | 0.18mi | 3/2.0 | 1,232 (+1%) | 4mo | $70,000 | $57 | 86 |
| 955 Beachside Dr | 0.05mi | 2/1.0 (-1) | 1,310 (+8%) | 10mo | $249,900 | $191 | 68 |
| 1260 Shoreline Cir | 0.28mi | 3/2.0 | 1,152 (-5%) | 21mo | $295,000 | $256 | 60 |
Match score weights: distance 35% · size 25% · config 20% · recency 20%. Top-matched comps best support the ARV.
Projected returns pro-forma
-3.0% appreciation · 3.0% rent growth · sell at horizon
- IRR
- -15.6%
- Equity multiple
- 0.44×
- Total profit
- $-22,679
- Equity at exit
- $21,754
- IRR
- -7.1%
- Equity multiple
- 0.55×
- Total profit
- $-18,447
- Equity at exit
- $12,615
Cash invested: $40,852 (down + closing). Projections, not guarantees.
Landlord ↔ Tenant lean methodology
- Overall (STATE)
- 87 Strongly Landlord-Friendly
- State Texas
- 87 Strongly Landlord-Friendly · R+5
- County
- — inherits STATE
- City
- — inherits STATE
ZIP-level market 75758
- Home prices YoY
- -27.6%
- Active inventory
- 225
- Price-to-rent
- 9.4×
Monthly cashflow live
- Estimated rent
- $1,300 medium interval (Pro) →
- Mortgage (P&I)
- −$765
- Tax from tax record
- −$169 /mo · $2,032/yr
- Insurance
- −$61
- HOA
- −$17
- Vacancy / Maint / Mgmt
- −$273
- Net cashflow
- $15
Break-even live
Sensitivity live
| Price | -10% $97 | -5% $56 | +0% $15 | +5% $-27 | +10% $-68 |
|---|---|---|---|---|---|
| Rent | -10% $-88 | -5% $-37 | +0% $15 | +5% $66 | +10% $117 |
| Rate | -1.0pp $88 | -0.5pp $52 | base $15 | +0.5pp $-23 | +1.0pp $-61 |
UW: 25.0% down · 7.5% · 30yr · 1.5% tax · 5.0% vac · 8.0% maint · 8.0% mgmt
Financing live
Cash to close
- Down payment
- $36,475
- Closing costs
- $4,377
- Reserves months
- —
- Total cash needed
- —
Loan-product check · same deal, 3 products live
Conventional
25% down · 7.5% · 30yr
- Down + closing
- —
- Monthly P&I
- —
- Monthly cashflow
- —
- DSCR
- —
- Eligible?
- —
Personal DTI + credit; lowest rate.
DSCR
20% down · 8.5% · 30yr
- Down + closing
- —
- Monthly P&I
- —
- Monthly cashflow
- —
- DSCR
- —
- Eligible?
- —
No personal income docs; deal must DSCR.
Hard money
10% down · 12.0% · 12mo
- Down + closing
- —
- Monthly P&I
- —
- Monthly cashflow
- —
- DSCR
- —
- Eligible?
- —
Short-term bridge; refi at stabilization.
Rent comps 1 comps
| Address | Beds | Baths | Sqft | Rent | $/sqft | DOM | Units | Dist |
|---|---|---|---|---|---|---|---|---|
| 501 Farm to Market 315 Unit 2 Chandler, TX | 2.0 | 1.0 | 1000 | $1,300 | $1.30 | 44d | 1 | 1.27mi |
HOA detail
- Monthly dues
- $17 · $204/yr
Listing history 29 events
-
2026-06-19days on market $145,900 Active 60 DOM
-
2026-06-18days on market $145,900 Active 59 DOM
-
2026-06-17days on market $145,900 Active 58 DOM
-
2026-06-16days on market $145,900 Active 57 DOM
-
2026-06-15days on market $145,900 Active 56 DOM
-
2026-06-14days on market $145,900 Active 54 DOM
-
2026-06-13days on market $145,900 Active 53 DOM
-
2026-06-10days on market $145,900 Active 51 DOM
-
2026-06-09days on market $145,900 Active 50 DOM
-
2026-06-08days on market $145,900 Active 49 DOM
-
2026-06-07days on market $145,900 Active 48 DOM
-
2026-06-02days on market $145,900 Active 43 DOM
-
2026-06-01days on market $145,900 Active 42 DOM
-
2026-05-31days on market $145,900 Active 41 DOM
-
2026-05-30days on market $145,900 Active 40 DOM
-
2026-04-19$145,900 Active 456-char remark
Show marketing remark (456 chars)
Well-maintained 2020 single-wide manufactured home located in the Westwood Beach subdivision in Chandler. This 3 bedroom, 2 bathroom home offers 1,216 square feet of comfortable living space with a functional layout and a clean, move-in ready feel. The home has been well cared for and is ideal for a primary residence, weekend getaway, or investment opportunity. Conveniently located near Lake Palestine with easy access to Chandler and surrounding areas.
-
2023-01-09soldstatus
-
2022-10-17$109,500 Active
-
2022-08-10status Active
-
2022-07-19status Pending
-
2022-07-06price $110,000
-
2022-06-06price $120,000
-
2022-04-12price $129,000
-
2022-03-21$135,000 Active
-
2022-02-23historical
-
2021-12-18$129,000 Active
-
2021-12-16historical
-
2021-11-15price $139,000
-
2021-11-09$149,900 Active
ⓘ Source: listings_history table (triggers on properties + properties_extension) + one-shot
backfill from property_details.listing_events for pre-trigger history.
Tax reassessment forecast TX · Resets to sale price
- Current annual tax
- $2,032 · $169/mo
- Projected year-2 tax
- $2,670 · $222/mo
- Expected delta
- +$638/yr (+$53/mo · 31.4%)
ⓘ Screening estimate from a state-policy table — verify with the county assessor before closing.
Climate risk First Street
- Flood 1/10 Low FEMA zone X (unshaded) · 0% chance over 30 yrs
- Wildfire 3/10 Moderate
- Heat 7/10 Severe 7 d/yr ≥109°F today · 26 d/yr by 30 yrs out
- Wind 6/10 Major 77% chance of damaging wind over 30 yrs
- Air quality 1/10 Low 0 unhealthy d/yr today · 0 by 30 yrs out
Nearby sold comps map
Loading sold comps map…
Walkable amenities ~0.75 mi
Loading nearby amenities…
Taxation est. · year 1
- Rental income
- $15,600
- − Mortgage interest
- −$8,173
- − Property taxes
- −$2,032
- − Insurance
- −$730
- − Repairs & maintenance
- −$1,248
- − Management
- −$1,248
- − HOA
- −$204
- − Depreciation
- −$4,244
- Taxable loss
- −$2,278
- Est. tax savings @ 24.0%
- +$547
- After-tax cash flow
- $724/yr
For passive investors: Depreciation is non-cash, so a rental often shows a tax loss while cash-flowing — sheltering income. Rental losses are passive: they offset passive income freely, and up to $25,000/yr can offset ordinary (W-2) income if you actively participate and your MAGI is under $100k (phasing out to $0 by $150k); unused losses carry forward. On sale, claimed depreciation is recaptured at up to 25%, and gains may owe capital-gains tax (a 1031 exchange can defer both). Figures are a year-1 estimate at your 24.0% rate — not tax advice; consult a CPA.
Schools (NCES district)
- District
- Brownsboro ISD
- NCES district ID
- 4811640
- Math proficiency
- 42% ▼ -5.00%
- Reading proficiency
- 46% ▬ 0.00%
- Median HH income
- $45,624
- Composite
- 37.38/100
- National rank
- #4429
- State rank
- #290 of 826 in TX
Livability — Chandler
- Score
- 70/100
- State rank
- #347
- US rank
- #7634
Category grades
Schools grade is shown separately in the Schools card above.
Census & demographics
- Population (ZIP)
- 10,357
Population outlook (Henderson County) Hauer SSP2
- Today (2025)
- 80,471 people
- By 2030
- 80,608 · +0.2%
- By 2040
- 80,087 · -0.5%
- By 2050
- 78,208 · -2.8%
- By 2075
- 72,423 · -10.0%
- By 2100
- 61,012 · -24.2%
Race, ethnicity, and origin ACS 2023
- Neighborhood character
- Predominantly White (79%)
- Race & ethnicity
- White 79% Hispanic / Latino 16% Two or more races 9% Black 2%
- Hispanic origin (detail)
- Mexican 14%
- Common ancestry
- Slovak 3% Serbian 2% Romanian 1%
- Foreign-born
- 5% · Canada, Vietnam
- Languages at home
- 91% English-only · Spanish 8% Other Indo-European 1%
Political lean MEDSL · Henderson
- 2024 margin
- Solid R (+63.5) · D 18.0% · R 81.4%
- 2008→2024 swing
- -18.8pp toward R · 2008: -44.6pp · 2024: -63.5pp
- All cycles
- 2024: R+63.5 2020: R+60.2 2016: R+60.0 2012: R+54.8 2008: R+44.6
Not yet ingested
- Civics
- —
Market trends
- HPI YoY
- ▼ -73.16%
- Current HPI
- 192.0837
- Rent YoY
- —
- Metro
- —
- State GDP YoY
- ▲ 3.95%
- F500 in state
- 110
Industry mix (Fortune 500 HQ in TX)
| Industry | F500 HQs | Revenue |
|---|---|---|
| Energy | 16 | $1,198B |
|
||
| Technology | 5 | $198B |
|
||
| Engineering / Construction | 4 | $72B |
|
||
| Energy Services | 3 | $60B |
|
||
| Utilities | 3 | $41B |
|
||
| Healthcare | 2 | $330B |
|
||
Price history
-2.7% since first listed14 events — show timeline
- 2026-04-19 Listed $145,900 NTREIS
- 2023-01-09 Sold (Public Records) — Public Records
- 2022-10-17 Listed $109,500 NTREIS
- 2022-08-10 Relisted — NTREIS
- 2022-07-19 Pending — NTREIS
- 2022-07-06 Price Changed $110,000 NTREIS
- 2022-06-06 Price Changed $120,000 NTREIS
- 2022-04-12 Price Changed $129,000 NTREIS
- 2022-03-21 Listed $135,000 NTREIS
- 2022-02-23 Listing Removed — NTREIS
- 2021-12-18 Listed $129,000 NTREIS
- 2021-12-16 Listing Removed — NTREIS
- 2021-11-15 Price Changed $139,000 NTREIS
- 2021-11-09 Listed $149,900 NTREIS
Property tax history
+46.8%/yrLatest (2025): $2,032 · +5.2% YoY. Source: county tax records.
Cash-flow waterfall
monthlySold comps — $/sqft
last 12 mo · ≤1 miLoading sold comps…