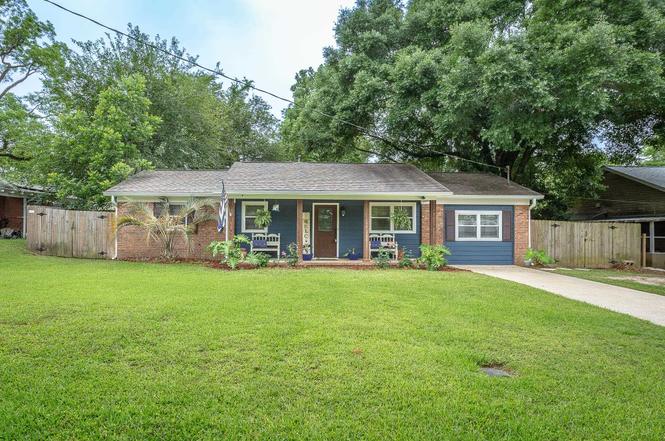
1859 Hopkins Dr · Tallahassee, FL
Flood risk 1/10 · Minimal
- FEMA flood zone
- X (unshaded)
- Chance of flooding over 30 yrs
- 0.0%
- Est. flood insurance / yr
- $507 – $1,088
Fire risk 3/10 · Minor
- Est. fire insurance / yr
- $947 – $1,759
Heat risk 8/10 · Major
- Hot days now (above 108°F)
- 7 days/yr
- Hot days in 30 yrs
- 20 days/yr
Wind risk 9/10 · Severe
- Chance of severe wind over 30 yrs
- 99.0%
Air-quality risk 5/10 · Moderate
- Unhealthy air days now
- 7 days/yr
- Unhealthy air days in 30 yrs
- 7 days/yr
Risk factors via First Street. Map © Google.
Why this score? — see what drove the D+ grade
The composite is a weighted blend of 9 inputs, each scored 0–100. Each bar is that input's sub-score; the figure is the points it added to the 100-point composite (weight × sub-score).
- Cash flow +13.8/30.0
- ARV discount +10.9/15.0
- Schools +4.3/10.0
- Livability +4.3/5.0
- DSCR +4.2/10.0
- Rent growth +3.3/5.0
- 1% rule +3.0/10.0
- Condition / age +2.5/5.0
- Appreciation +0.0/10.0
$249,000
🖨 Deal sheet (PDF) 📄 Offer letter ✓ Due diligence
Listing remarks
Buyer Closing Cost assistance $5k being offered. This home is both beautiful and unique, offering convenient access to Highway 27 and Interstate 10 for easy travel to any destination. Situated on a generous 1/4-acre, the property has been maintained, WDO repairs now being completed; NEW WATER HEATER and all additional details available in the Home Features section of the Association Documents. Notable features a newer roof, an accent wall in the dining room, and a stunning kitchen with granite countertops and an expansive counter area ideal for entertaining. Both bathrooms have been remodeled, and the flooring has been updated, with fresh paint applied both inside and out. The porch provide
Key facts
- Newer roof
- New water heater
- Updated flooring
Tags
Property features AI
Finance
- Financial info: Offered for sale
Exterior
- Parking: Driveway
- Home design: Single-story
- Construction: Lot dimensions 80x139x80x139; Lot around 0.25 acre
- Exterior features: Partial privacy fencing; Publicly maintained road
Interior
- Kitchen: Dishwasher; Microwave; Oven; Range; Refrigerator
- Bedrooms: Bedroom 2 (12x10); Bedroom 3 (11x9)
- Bathrooms: 2 full bathrooms
- Interior features: Living room; Family room; Dining room; Kitchen
Neighborhood map
What this means for you Summary
Snapshot
- This is a 3-bed/2.0-bath single-family listed at $249k.
Deal economics
- At list price, monthly cash flow is $22 ($266/yr) — positive.
- The deal already cash-flows at list — no discount required.
- To meet the 1% rule (rent ≥ 1% of price), the offer needs to be $198k (20.5% below list).
- Recommended offer: $198k (20.5% below list) — sets the bar for 1% rule.
- Cap rate 6.4% vs local median 4.2% in Tallahassee — top-decile yield for the area; either an underpriced asset or a hidden risk that comps aren't pricing in. Stress-test before assuming the spread holds.
Location & tenants
- Location reads 86/100 on livability (#19 in FL, #429 nationally) — a professional / high-income tenant draw. Strengths: amenities A+, commute A+, health & safety A+; Watch: employment D.
- Leon (urban): math 48% / reading 53% proficiency, ranked #33 of 73 in FL (top 45%) — acceptable for families but not a draw, mixed tenant base, ~2y average lease.
- Zoned schools: Sealey Elementary School (math 31% / reading 48%, grade F, #1,513 of 2,144 statewide, top 73%, 405 students, 55% FRL); Raa Middle School (math 42% / reading 51%, grade D+, #297 of 571 statewide, top 52%, 855 students, 49% FRL); Leon High School (math 52% / reading 60%, grade C, #131 of 667 statewide, top 20%, 1,935 students, 37% FRL) — zoned schools at 47% FRL track the district average.
- Market conditions: Rents rising (+3.1%/yr); 238 active listings in the ZIP; 21 comparable units currently listed for rent nearby; rentals at typical pace (median 23d on market — plan ~3-4 weeks tenant-placement turnaround); 1,765 units permitted in Leon County in 2024 (975 in 5+ unit buildings).
- This rent runs 38% of the median local income ($62k/yr) — at the standard rent-burdened threshold; future hikes will face affordability resistance.
Forward outlook
- Local home prices are declining (-3.0%/yr); year-one equity from $2k of loan paydown is wiped out by about $7k of value loss. Plan a longer hold.
- Leon County population projected at +23% by 2050 — long-run rental-demand tailwind backs the buy-and-hold thesis.
Negotiation context
- It's been on market 114 days — a 9% lower offer ($227k) is reasonable based on typical stale-listing flexibility.
- 5 sale attempts with the ask held roughly flat each time — persistent listings suggest the price (not the market) is what's stuck; bring a comps-based counter.
- Current owner paid $148k; list at $249k implies a 68% gain — meaningful room to come down on a strong offer.
Risks & watch-outs
- Climate carrying-cost: severe wind risk, 99% chance of damaging wind over 30y; extreme-heat days projected 7→20/yr by 2055 (HVAC capex compounding) — expect insurance premiums to compound above CPI over the hold.
Questions for the listing agent
- It's been on market 114 days. Have you received any prior offers? Is the seller open to a 20% concession, seller financing, or rate buy-down credit?
- Built in 1971 — when were the roof, HVAC, electrical panel, plumbing, and water heater last replaced?
- Why hasn't it sold? Are there any deal-killer items the seller is aware of (foundation, flood, title, zoning, code violations)?
- Is there a deadline driving the sale (1031 exchange, divorce, estate, relocation)? That informs how much negotiation room exists.
- Schools are B-rated — typically a magnet for longer-tenancy family renters. What's the average tenant stay here, and is there a school-zone premium baked into asking?
- The area grade is low — what's the realistic commute time and amenity access for the typical tenant pool here? Any planned neighborhood developments (good or bad) we should know about?
- What's the average days-on-market for RENTAL listings here right now (not sales)? A rising rental-DOM trend means longer vacancies and softer asking-rent achievability than the comps imply.
- What's the recent tenant-quality profile in this submarket — average credit score on applications, eviction rate, late-payment / NSF rate, and stable-employment percentage? A property-management company in the area should have these aggregated.
- How much new for-sale + rental construction is in the pipeline within 1–3 miles? Heavy new supply typically softens prices + rents 12–24 months out; constrained supply supports both.
Investment metrics
- 1% rule
- 0.80% ✗
- Cap rate
- 6.40%
- Cash-on-cash
- 0.38%
- DSCR
- 1.02
- GRM
- 10.5
CMA / ARV
- ARV (on-the-fly)
- $269,028
- Comps found
- 12
Show comp detail 12 sales within ~0.75 mi
| Address | Dist | Beds/Ba | Sqft | Sold | Price | $/sf | Match |
|---|---|---|---|---|---|---|---|
| 1855 Hopkins Dr | 0.04mi | 3/2.0 | 1,305 (-9%) | 10mo | $212,000 | $162 | 74 |
| 1724 Paula Dr | 0.22mi | 3/1.5 | 1,430 (-0%) | 16mo | $190,000 | $133 | 74 |
| 1721 Talpeco Rd | 0.19mi | 3/1.5 | 1,431 (0%) | 18mo | $210,000 | $147 | 74 |
| 1844 Copper Axe | 0.44mi | 3/2.0 | 1,492 (+4%) | 1mo | $245,000 | $164 | 71 |
| 1818 Homewood Rd | 0.39mi | 3/2.0 | 1,501 (+5%) | 12mo | $275,000 | $183 | 64 |
| 2612 Brentshire Dr | 0.75mi | 3/2.0 | 1,392 (-3%) | 4mo | $305,000 | $219 | 57 |
| 1609 Talpeco Rd | 0.36mi | 3/1.5 | 1,245 (-13%) | 8mo | $234,000 | $188 | 53 |
| 3206 Old Bainbridge Rd | 0.39mi | 3/3.0 | 1,603 (+12%) | 9mo | $320,000 | $200 | 50 |
| 3015 Lang Dr | 0.49mi | 3/1.0 | 1,222 (-15%) | 1mo | $245,000 | $200 | 48 |
| 1729 Ray Rd | 0.27mi | 3/1.0 | 1,611 (+13%) | 19mo | $290,000 | $180 | 47 |
| 3130 Okeeheepkee Rd | 0.68mi | 3/2.0 | 1,638 (+14%) | 1mo | $423,000 | $258 | 43 |
| 3017 Hunters Gln | 0.70mi | 3/2.0 | 1,529 (+7%) | 24mo | $299,000 | $196 | 36 |
Match score weights: distance 35% · size 25% · config 20% · recency 20%. Top-matched comps best support the ARV.
Projected returns pro-forma
-3.0% appreciation · 3.12% rent growth · sell at horizon
- IRR
- -15.6%
- Equity multiple
- 0.44×
- Total profit
- $-38,778
- Equity at exit
- $37,127
- IRR
- -7.0%
- Equity multiple
- 0.55×
- Total profit
- $-31,288
- Equity at exit
- $21,529
Cash invested: $69,720 (down + closing). Projections, not guarantees.
Landlord ↔ Tenant lean methodology
- Overall (STATE)
- 87 Strongly Landlord-Friendly
- State Florida
- 87 Strongly Landlord-Friendly · R+3
- County
- — inherits STATE
- City
- — inherits STATE
ZIP-level market 32303
- Rents YoY
- 3.1%
- Active inventory
- 238
- Price-to-rent
- 10.5×
Monthly cashflow live
- Estimated rent
- $1,981 high interval (Pro) →
- Mortgage (P&I)
- −$1,306
- Tax from tax record
- −$133 /mo · $1,597/yr
- Insurance
- −$104
- HOA
- −$0
- Vacancy / Maint / Mgmt
- −$416
- Net cashflow
- $22
Break-even live
Sensitivity live
| Price | -10% $163 | -5% $93 | +0% $22 | +5% $-48 | +10% $-119 |
|---|---|---|---|---|---|
| Rent | -10% $-134 | -5% $-56 | +0% $22 | +5% $100 | +10% $179 |
| Rate | -1.0pp $148 | -0.5pp $85 | base $22 | +0.5pp $-42 | +1.0pp $-108 |
UW: 25.0% down · 7.5% · 30yr · 1.5% tax · 5.0% vac · 8.0% maint · 8.0% mgmt
Financing live
Cash to close
- Down payment
- $62,250
- Closing costs
- $7,470
- Reserves months
- —
- Total cash needed
- —
Loan-product check · same deal, 3 products live
Conventional
25% down · 7.5% · 30yr
- Down + closing
- —
- Monthly P&I
- —
- Monthly cashflow
- —
- DSCR
- —
- Eligible?
- —
Personal DTI + credit; lowest rate.
DSCR
20% down · 8.5% · 30yr
- Down + closing
- —
- Monthly P&I
- —
- Monthly cashflow
- —
- DSCR
- —
- Eligible?
- —
No personal income docs; deal must DSCR.
Hard money
10% down · 12.0% · 12mo
- Down + closing
- —
- Monthly P&I
- —
- Monthly cashflow
- —
- DSCR
- —
- Eligible?
- —
Short-term bridge; refi at stabilization.
Rent comps 21 comps
| Address | Beds | Baths | Sqft | Rent | $/sqft | DOM | Units | Dist |
|---|---|---|---|---|---|---|---|---|
| 1729 Ray Rd Tallahassee, FL | 3.0 | 1.0 | 1611 | $3,400 | $2.11 | 23d | 1 | 0.27mi |
| 3400 Old Bainbridge Rd #203 Tallahassee, FL | 3.0 | 3.0 | 1368 | $1,650 | $1.21 | 23d | 1 | 0.58mi |
| 3126 Okeeheepkee Rd Tallahassee, FL | 3.0 | 2.0 | 1638 | $2,900 | $1.77 | 23d | 1 | 0.68mi |
| 2677 Old Bainbridge Rd Tallahassee, FL | 1.0–3.0 | 1.5–3.5 | 1395 | $1,683 | $1.21 | 15d | 28 | 0.76mi |
| 3380 Fred George Rd Tallahassee, FL | 1.0–3.0 | 1.0–2.0 | 895 | $1,700 | $1.90 | 15d | 9 | 0.85mi |
| 2660 Old Bainbridge Rd Tallahassee, FL | 3.0 | 2.5 | 1196 | $1,550 | $1.30 | 23d | 2 | 0.89mi |
| 2626 Faversham Dr Tallahassee, FL | 3.0 | 2.0 | 1440 | $1,850 | $1.28 | 15d | 1 | 0.99mi |
| 2052 Darnell Cir Unit B Tallahassee, FL | 4.0 | 3.0 | 1300 | $1,700 | $1.31 | 23d | 1 | 1.13mi |
| 2520 Graves Rd #103 Tallahassee, FL | 3.0 | 3.0 | 1216 | $1,350 | $1.11 | 23d | 1 | 1.15mi |
| 1600 Pullen Rd Tallahassee, FL | 1.0–2.0 | 1.0–2.0 | 875 | $1,345 | $1.54 | 15d | 1 | 1.18mi |
| 2498 Nugget Ln Tallahassee, FL | 3.0 | 2.0 | 1200 | $1,550 | $1.29 | 23d | 1 | 1.22mi |
| 2513 Colleen Dr Tallahassee, FL | 4.0 | 4.0 | 1700 | $2,690 | $1.58 | 23d | 1 | 1.26mi |
| 1819 Salmon Dr Tallahassee, FL | 4.0 | 2.0 | 1668 | $1,700 | $1.02 | 23d | 1 | 1.30mi |
| 2412 Atlas Rd Tallahassee, FL | 3.0 | 1.5 | 1081 | $1,200 | $1.11 | 23d | 1 | 1.34mi |
| 2419 Nugget Ln Tallahassee, FL | 3.0 | 2.0 | 1212 | $1,550 | $1.28 | 15d | 1 | 1.35mi |
| 3875 Gaffney Loop Tallahassee, FL | 2.0 | 2.0 | 984 | $1,300 | $1.32 | 23d | 1 | 1.37mi |
| 2401 Atlas Rd Unit B Tallahassee, FL | 2.0 | 1.0 | 900 | $1,100 | $1.22 | 23d | 1 | 1.39mi |
| 2406 Hartsfield Rd Tallahassee, FL | 3.0 | 3.0 | 1216 | $1,350 | $1.11 | 23d | 1 | 1.43mi |
| 2400 Fred Smith Rd #201 Tallahassee, FL | 3.0 | 3.0 | 1353 | $1,650 | $1.22 | 23d | 1 | 1.45mi |
| 2403 Hartsfield Rd #602 Tallahassee, FL | 3.0 | 3.0 | 1216 | $1,350 | $1.11 | 15d | 1 | 1.48mi |
| 2403 Hartsfield Rd #602 Tallahassee, FL | 3.0 | 3.0 | 1216 | $1,350 | $1.11 | 23d | 1 | 1.48mi |
Listing history 35 events
-
2026-06-22days on market $249,000 Active 114 DOM
-
2026-06-18days on market $249,000 Active 111 DOM
-
2026-06-17days on market $249,000 Active 110 DOM
-
2026-06-16days on market $249,000 Active 109 DOM
-
2026-06-15days on market $249,000 Active 108 DOM
-
2026-06-14days on market $249,000 Active 106 DOM
-
2026-06-10days on market $249,000 Active 103 DOM
-
2026-06-09pricedays on market $249,000 Active 102 DOM
-
2026-06-08days on market $259,000 Active 101 DOM
-
2026-06-07days on market $259,000 Active 100 DOM
-
2026-06-05days on market $259,000 Active 97 DOM
-
2026-06-03days on market $259,000 Active 96 DOM
-
2026-06-02days on market $259,000 Active 95 DOM
-
2026-06-01days on market $259,000 Active 94 DOM
-
2026-05-31days on market $259,000 Active 93 DOM
-
2026-05-30days on market $259,000 Active 92 DOM
-
2026-05-18price $259,900
-
2026-05-18status Active
-
2026-05-18historical Active Under Contract
-
2026-02-27$260,000 Active
-
2025-12-03historical Active Under Contract
-
2025-12-02status Pending
-
2025-11-29historical Contingent
-
2025-11-12status Active
-
2025-11-07historical Contingent
-
2025-10-17price $255,000
-
2025-08-21status Active
-
2025-08-21price $265,000
-
2025-08-09historical
-
2025-08-08historical Contingent
-
2025-07-26price $259,999
-
2025-07-01price $260,000
-
2025-06-07price $275,000
-
2025-05-09$285,000 Active
-
2005-11-03soldstatus $148,000
ⓘ Source: listings_history table (triggers on properties + properties_extension) + one-shot
backfill from property_details.listing_events for pre-trigger history.
Tax reassessment forecast FL · Resets to sale price
- Current annual tax
- $1,597 · $133/mo
- Projected year-2 tax
- $2,067 · $172/mo
- Expected delta
- +$470/yr (+$39/mo · 29.4%)
ⓘ Screening estimate from a state-policy table — verify with the county assessor before closing.
Climate risk First Street
- Flood 1/10 Low FEMA zone X (unshaded) · 0% chance over 30 yrs
- Wildfire 3/10 Moderate
- Heat 8/10 Severe 7 d/yr ≥108°F today · 20 d/yr by 30 yrs out
- Wind 9/10 Extreme 99% chance of damaging wind over 30 yrs
- Air quality 5/10 Major 7 unhealthy d/yr today · 7 by 30 yrs out
Nearby sold comps map
Loading sold comps map…
Walkable amenities ~0.75 mi
Loading nearby amenities…
Taxation est. · year 1
- Rental income
- $23,768
- − Mortgage interest
- −$13,948
- − Property taxes
- −$1,597
- − Insurance
- −$1,245
- − Repairs & maintenance
- −$1,901
- − Management
- −$1,901
- − Depreciation
- −$7,244
- Taxable loss
- −$4,068
- Est. tax savings @ 24.0%
- +$976
- After-tax cash flow
- $1,242/yr
For passive investors: Depreciation is non-cash, so a rental often shows a tax loss while cash-flowing — sheltering income. Rental losses are passive: they offset passive income freely, and up to $25,000/yr can offset ordinary (W-2) income if you actively participate and your MAGI is under $100k (phasing out to $0 by $150k); unused losses carry forward. On sale, claimed depreciation is recaptured at up to 25%, and gains may owe capital-gains tax (a 1031 exchange can defer both). Figures are a year-1 estimate at your 24.0% rate — not tax advice; consult a CPA.
Schools (NCES district)
- District
- Leon
- NCES district ID
- 1201110
- Math proficiency
- 48% ▼ -13.00%
- Reading proficiency
- 53% ▼ -5.00%
- Median HH income
- $46,339
- Composite
- 42.84/100
- National rank
- #3131
- State rank
- #33 of 73 in FL
Livability — Tallahassee
- Score
- 86/100
- State rank
- #19
- US rank
- #429
Category grades
Schools grade is shown separately in the Schools card above.
Census & demographics
- County
- Leon County · 294,472 people
- City population
- 294,472
- Metro
- Tallahassee, FL
- Population (ZIP)
- 49,785
- Household income
- $62,275
- Rent vs Own
- Severe rent burden
- 2919.0
Population outlook (Leon County) Hauer SSP2
- Today (2025)
- 315,507 people
- By 2030
- 330,677 · +4.8%
- By 2040
- 358,465 · +13.6%
- By 2050
- 386,804 · +22.6%
- By 2075
- 465,480 · +47.5%
- By 2100
- 519,959 · +64.8%
Race, ethnicity, and origin ACS 2023
- Neighborhood character
- Diverse neighborhood (Simpson 0.63)
- Race & ethnicity
- White 50% Black 34% Hispanic / Latino 8% Two or more races 8% Asian 3%
- Hispanic origin (detail)
- Mexican 2% Puerto Rican 1% Cuban 2%
- Common ancestry
- Slovak 2% Italian 1% Lithuanian 1%
- Foreign-born
- 8% · Canada, Vietnam, China
- Languages at home
- 89% English-only · Spanish 5% Arabic 1% French/Haitian/Cajun 1%
Political lean MEDSL · Leon
- 2024 margin
- Strong D (+21.8) · D 60.3% · R 38.5% · Other 1.2%
- 2008→2024 swing
- -2.5pp toward R · 2008: 24.3pp · 2024: 21.8pp
- All cycles
- 2024: D+21.8 2020: D+28.3 2016: D+25.1 2012: D+23.6 2008: D+24.3
Not yet ingested
- Civics
- —
Market trends
- HPI YoY
- ▼ -255.24%
- Current HPI
- 241.3131
- Rent YoY
- ▲ 3.12%
- Metro
- Tallahassee, FL
- State GDP YoY
- ▲ 3.28%
- F500 in state
- 36
Industry mix (Fortune 500 HQ in FL)
| Industry | F500 HQs | Revenue |
|---|---|---|
| Industrial Technology | 2 | $29B |
|
||
| Insurance | 2 | $17B |
|
||
| Retail | 1 | $60B |
|
||
| Technology Distribution | 1 | $58B |
|
||
| Homebuilding | 1 | $35B |
|
||
| Technology Manufacturing | 1 | $35B |
|
||
Price history
+75.6% since first listed19 events — show timeline
- 2026-05-18 Price Changed $259,900 CATRS
- 2026-05-18 Relisted — CATRS
- 2026-05-18 Contingent — CATRS
- 2026-02-27 Listed $260,000 CATRS
- 2025-12-03 Contingent — CATRS
- 2025-12-02 Pending — CATRS
- 2025-11-29 Contingent — CATRS
- 2025-11-12 Relisted — CATRS
- 2025-11-07 Contingent — CATRS
- 2025-10-17 Price Changed $255,000 CATRS
- 2025-08-21 Relisted — CATRS
- 2025-08-21 Price Changed $265,000 CATRS
- 2025-08-09 Listing Removed — CATRS
- 2025-08-08 Contingent — CATRS
- 2025-07-26 Price Changed $259,999 CATRS
- 2025-07-01 Price Changed $260,000 CATRS
- 2025-06-07 Price Changed $275,000 CATRS
- 2025-05-09 Listed $285,000 CATRS
- 2005-11-03 Sold (Public Records) $148,000 Public Records
Property tax history
+3.4%/yrLatest (2025): $1,597 · +22.1% YoY. Source: county tax records.
Cash-flow waterfall
monthlySold comps — $/sqft
last 12 mo · ≤1 miLoading sold comps…