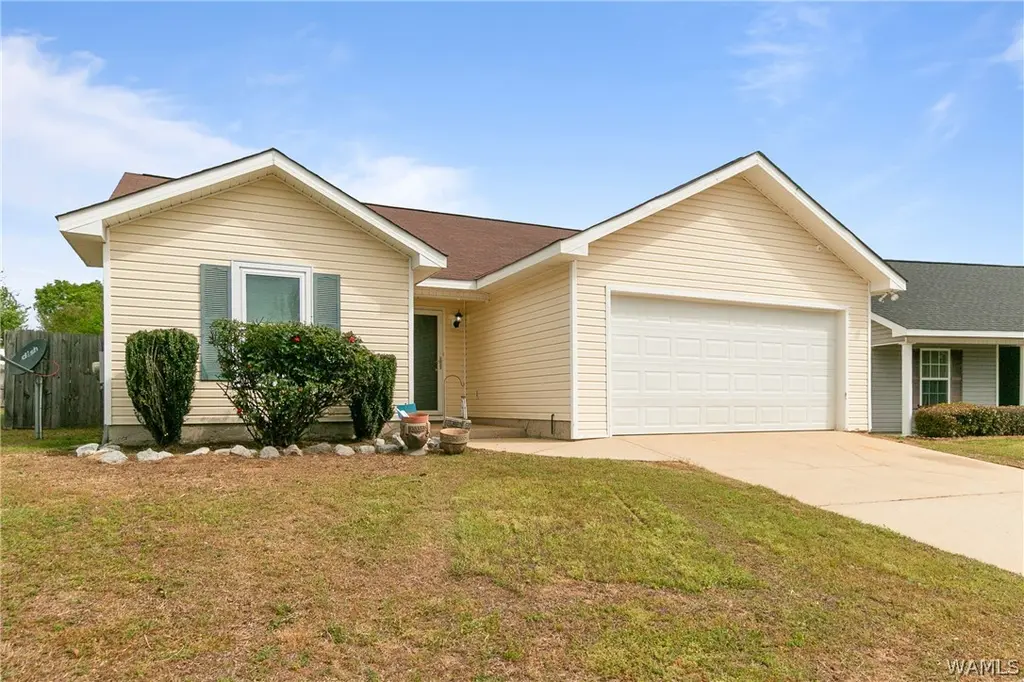
81 Peyton Ln · Moundville, AL
Flood risk 1/10 · Minimal
- FEMA flood zone
- X (unshaded)
- Chance of flooding over 30 yrs
- 0.0%
- Est. flood insurance / yr
- $507 – $1,088
Fire risk 4/10 · Minor
- Est. fire insurance / yr
- $916 – $1,700
Heat risk 8/10 · Major
- Hot days now (above 108°F)
- 7 days/yr
- Hot days in 30 yrs
- 21 days/yr
Wind risk 6/10 · Moderate
- Chance of severe wind over 30 yrs
- 58.0%
Air-quality risk 1/10 · Minimal
- Unhealthy air days now
- 0 days/yr
- Unhealthy air days in 30 yrs
- 0 days/yr
Risk factors via First Street. Map © Google.
Why this score? — see what drove the D grade
The composite is a weighted blend of 9 inputs, each scored 0–100. Each bar is that input's sub-score; the figure is the points it added to the 100-point composite (weight × sub-score).
- Cash flow +13.4/30.0
- ARV discount +9.6/15.0
- DSCR +4.0/10.0
- Livability +3.7/5.0
- Rent growth +2.5/5.0
- Condition / age +2.5/5.0
- 1% rule +2.4/10.0
- Appreciation +2.2/10.0
- Schools +1.5/10.0
$199,000
🖨 Deal sheet (PDF) 📄 Offer letter ✓ Due diligence
Listing remarks
Welcome to 81 Peyton Lane in Moundville, AL—an inviting 3-bedroom, 2-bath home situated on a spacious corner lot with a large backyard perfect for entertaining, relaxing, or future possibilities. This property features a 2-car garage and a functional layout ready for its next homeowner to make it their own. Don’t miss your chance to own a well-located home with plenty of potential in a quiet Moundville setting!
Key facts
- Large backyard
- Quiet setting
- Functional layout
Tags
Property features AI
Finance
- HOA & community: Located in The Village At Moundville subdivision
Exterior
- Parking: Attached garage; 2 garage spaces; Driveway; Concrete surfaces
- Utilities: Public water
- Home design: Single-family residence; One level
- Construction: Vinyl siding; Composition/shingle roof
- Exterior features: Paved road access
Interior
- Bathrooms: 2 full bathrooms
- Heating & cooling: Has heating; Has cooling
- Interior features: Electric water heater; No fireplace
- Laundry & utility: Laundry closet
Neighborhood map
What this means for you Summary
Snapshot
- This is a 3-bed/1.0-bath single-family listed at $199k.
Deal economics
- At list price, monthly cash flow is $3 ($42/yr) — positive.
- The deal already cash-flows at list — no discount required.
- To meet the 1% rule (rent ≥ 1% of price), the offer needs to be $148k (25.5% below list).
- Recommended offer: $148k (25.5% below list) — sets the bar for 1% rule.
- Cap rate 6.3% vs local median 3.2% in Moundville — top-decile yield for the area; either an underpriced asset or a hidden risk that comps aren't pricing in. Stress-test before assuming the spread holds.
Location & tenants
- Location reads 73/100 on livability (#24 in AL, #4,983 nationally) — a middle-class / working-renter tenant base. Strengths: cost of living A+, housing A+, health & safety A+; Watch: amenities F, commute F.
- Hale County (rural): math 6% / reading 31% proficiency, ranked #109 of 129 in AL (top 84%) — low school quality limits family demand, transient renter base, plan for 1-2y turnover; 68% free/reduced lunch — lower-income household profile, screen leases tightly.
- Zoned schools: Moundville Elementary School (math 11% / reading 46%, grade F, #382 of 627 statewide, top 61%, 590 students, 55% FRL); Hale County Middle School (math 5% / reading 39%, grade F, #182 of 257 statewide, top 71%, 269 students, 62% FRL); Hale County High School (math 12% / reading 17%, grade F, #220 of 305 statewide, top 77%, 379 students, 59% FRL).
- Market conditions: 82 active listings in the ZIP; 11 units permitted in Hale County in 2024 (0 in 5+ unit buildings).
Forward outlook
- Local home prices are declining (-3.0%/yr); year-one equity from $1k of loan paydown is wiped out by about $6k of value loss. Plan a longer hold.
- Hale County population projected at -27% by 2050 — secular population decline; favor cash flow + early exit over multi-decade hold.
Negotiation context
- It's been on market 26 days — a 2% lower offer ($196k) is reasonable based on typical stale-listing flexibility.
Risks & watch-outs
- Climate carrying-cost: major wind risk, 58% chance of damaging wind over 30y; extreme-heat days projected 7→21/yr by 2055 (HVAC capex compounding) — expect insurance premiums to compound above CPI over the hold.
Questions for the listing agent
- Is there a deadline driving the sale (1031 exchange, divorce, estate, relocation)? That informs how much negotiation room exists.
- Schools are D-rated, which usually means shorter tenancies and higher turnover. Who's the typical renter profile here, and what's been the actual vacancy rate?
- The area grade is low — what's the realistic commute time and amenity access for the typical tenant pool here? Any planned neighborhood developments (good or bad) we should know about?
- What's the average days-on-market for RENTAL listings here right now (not sales)? A rising rental-DOM trend means longer vacancies and softer asking-rent achievability than the comps imply.
- What's the recent tenant-quality profile in this submarket — average credit score on applications, eviction rate, late-payment / NSF rate, and stable-employment percentage? A property-management company in the area should have these aggregated.
- How much new for-sale + rental construction is in the pipeline within 1–3 miles? Heavy new supply typically softens prices + rents 12–24 months out; constrained supply supports both.
Investment metrics
- 1% rule
- 0.74% ✗
- Cap rate
- 6.31%
- Cash-on-cash
- 0.07%
- DSCR
- 1.00
- GRM
- 11.2
CMA / ARV
- ARV (on-the-fly)
- $208,803
- Comps found
- 12
Show comp detail 12 sales within ~0.75 mi
| Address | Dist | Beds/Ba | Sqft | Sold | Price | $/sf | Match |
|---|---|---|---|---|---|---|---|
| 114 Peyton Ln | 0.03mi | 3/2.0 | 1,141 (0%) | 3mo | $215,000 | $188 | 93 |
| 370 Holly Berry Ln | 0.08mi | 3/2.0 | 1,141 (0%) | 10mo | $195,500 | $171 | 84 |
| 169 Peyton Ln | 0.02mi | 3/2.0 | 1,104 (-3%) | 10mo | $199,000 | $180 | 81 |
| 90 Rosewood Ln | 0.35mi | 3/2.0 | 1,150 (+1%) | 6mo | $210,000 | $183 | 73 |
| 106 Raintree St | 0.45mi | 3/2.0 | 1,150 (+1%) | 4mo | $209,900 | $183 | 71 |
| 154 Raintree St | 0.46mi | 3/2.0 | 1,150 (+1%) | 4mo | $213,900 | $186 | 70 |
| 248 Raintree St | 0.46mi | 3/2.0 | 1,100 (-4%) | 4mo | $223,900 | $204 | 65 |
| 503 Market St | 0.64mi | 3/2.0 | 1,150 (+1%) | 1mo | $209,900 | $183 | 64 |
| 495 Market St | 0.64mi | 3/2.0 | 1,150 (+1%) | 2mo | $212,000 | $184 | 63 |
| 308 Alabama Ave | 0.62mi | 3/2.0 | 1,175 (+3%) | 3mo | $155,000 | $132 | 60 |
| 320 3rd Ave | 0.56mi | 3/2.0 | 1,150 (+1%) | 11mo | $209,900 | $183 | 59 |
| 465 Market St | 0.63mi | 3/1.5 | 1,066 (-7%) | 10mo | $165,000 | $155 | 50 |
Match score weights: distance 35% · size 25% · config 20% · recency 20%. Top-matched comps best support the ARV.
Projected returns pro-forma
-3.0% appreciation · 3.0% rent growth · sell at horizon
- IRR
- -16.3%
- Equity multiple
- 0.42×
- Total profit
- $-32,131
- Equity at exit
- $29,672
- IRR
- -8.1%
- Equity multiple
- 0.50×
- Total profit
- $-28,123
- Equity at exit
- $17,206
Cash invested: $55,720 (down + closing). Projections, not guarantees.
Landlord ↔ Tenant lean methodology
- Overall (STATE)
- 90 Strongly Landlord-Friendly
- State Alabama
- 90 Strongly Landlord-Friendly · R+15
- County
- — inherits STATE
- City
- — inherits STATE
ZIP-level market 35474
- Home prices YoY
- -2.4%
- Active inventory
- 82
- Price-to-rent
- 11.2×
Monthly cashflow live
- Estimated rent
- $1,482 medium interval (Pro) →
- Mortgage (P&I)
- −$1,044
- Tax from tax record
- −$41 /mo · $489/yr
- Insurance
- −$83
- HOA
- −$0
- Vacancy / Maint / Mgmt
- −$311
- Net cashflow
- $3
Break-even live
Sensitivity live
| Price | -10% $116 | -5% $60 | +0% $3 | +5% $-53 | +10% $-109 |
|---|---|---|---|---|---|
| Rent | -10% $-114 | -5% $-55 | +0% $3 | +5% $62 | +10% $121 |
| Rate | -1.0pp $104 | -0.5pp $54 | base $3 | +0.5pp $-48 | +1.0pp $-101 |
UW: 25.0% down · 7.5% · 30yr · 1.5% tax · 5.0% vac · 8.0% maint · 8.0% mgmt
Financing live
Cash to close
- Down payment
- $49,750
- Closing costs
- $5,970
- Reserves months
- —
- Total cash needed
- —
Loan-product check · same deal, 3 products live
Conventional
25% down · 7.5% · 30yr
- Down + closing
- —
- Monthly P&I
- —
- Monthly cashflow
- —
- DSCR
- —
- Eligible?
- —
Personal DTI + credit; lowest rate.
DSCR
20% down · 8.5% · 30yr
- Down + closing
- —
- Monthly P&I
- —
- Monthly cashflow
- —
- DSCR
- —
- Eligible?
- —
No personal income docs; deal must DSCR.
Hard money
10% down · 12.0% · 12mo
- Down + closing
- —
- Monthly P&I
- —
- Monthly cashflow
- —
- DSCR
- —
- Eligible?
- —
Short-term bridge; refi at stabilization.
Listing history 16 events
-
2026-06-21days on market $199,000 Active 26 DOM
-
2026-06-19days on market $199,000 Active 24 DOM
-
2026-06-18days on market $199,000 Active 23 DOM
-
2026-06-17days on market $199,000 Active 22 DOM
-
2026-06-16days on market $199,000 Active 21 DOM
-
2026-06-15days on market $199,000 Active 20 DOM
-
2026-06-14days on market $199,000 Active 18 DOM
-
2026-06-12days on market $199,000 Active 17 DOM
-
2026-06-09days on market $199,000 Active 14 DOM
-
2026-06-08days on market $199,000 Active 13 DOM
-
2026-06-07days on market $199,000 Active 12 DOM
-
2026-06-07days on market $199,000 Active 11 DOM
-
2026-06-04days on market $199,000 Active 8 DOM
-
2026-06-03status $199,000 Active 7 DOM
-
2026-04-17status Pending
-
2026-04-09$199,000 Active
ⓘ Source: listings_history table (triggers on properties + properties_extension) + one-shot
backfill from property_details.listing_events for pre-trigger history.
Tax reassessment forecast AL · Resets to sale price
- Current annual tax
- $489 · $41/mo
- Projected year-2 tax
- $816 · $68/mo
- Expected delta
- +$327/yr (+$27/mo · 66.8%)
ⓘ Screening estimate from a state-policy table — verify with the county assessor before closing.
Climate risk First Street
- Flood 1/10 Low FEMA zone X (unshaded) · 0% chance over 30 yrs
- Wildfire 4/10 Moderate
- Heat 8/10 Severe 7 d/yr ≥108°F today · 21 d/yr by 30 yrs out
- Wind 6/10 Major 58% chance of damaging wind over 30 yrs
- Air quality 1/10 Low 0 unhealthy d/yr today · 0 by 30 yrs out
Nearby sold comps map
Loading sold comps map…
Walkable amenities ~0.75 mi
Loading nearby amenities…
Taxation est. · year 1
- Rental income
- $17,783
- − Mortgage interest
- −$11,147
- − Property taxes
- −$489
- − Insurance
- −$995
- − Repairs & maintenance
- −$1,423
- − Management
- −$1,423
- − Depreciation
- −$5,789
- Taxable loss
- −$3,482
- Est. tax savings @ 24.0%
- +$836
- After-tax cash flow
- $877/yr
For passive investors: Depreciation is non-cash, so a rental often shows a tax loss while cash-flowing — sheltering income. Rental losses are passive: they offset passive income freely, and up to $25,000/yr can offset ordinary (W-2) income if you actively participate and your MAGI is under $100k (phasing out to $0 by $150k); unused losses carry forward. On sale, claimed depreciation is recaptured at up to 25%, and gains may owe capital-gains tax (a 1031 exchange can defer both). Figures are a year-1 estimate at your 24.0% rate — not tax advice; consult a CPA.
Schools (NCES district)
- District
- Hale County
- NCES district ID
- 0101710
- Math proficiency
- 6% ▼ -26.00%
- Reading proficiency
- 31% ▼ -3.00%
- Median HH income
- $31,076
- Composite
- 14.76/100
- National rank
- #9391
- State rank
- #109 of 129 in AL
Livability — Moundville
- Score
- 73/100
- State rank
- #24
- US rank
- #4983
Category grades
Schools grade is shown separately in the Schools card above.
Census & demographics
- Census place
- Moundville, AL
- Population (ZIP)
- 8,648
Population outlook (Hale County) Hauer SSP2
- Today (2025)
- 13,830 people
- By 2030
- 13,032 · -5.8%
- By 2040
- 11,487 · -16.9%
- By 2050
- 10,091 · -27.0%
- By 2075
- 7,930 · -42.7%
- By 2100
- 6,595 · -52.3%
Race, ethnicity, and origin ACS 2023
- Neighborhood character
- Diverse neighborhood (Simpson 0.56)
- Race & ethnicity
- White 55% Black 36% Two or more races 7% Hispanic / Latino 3%
- Common ancestry
- Slovak 10% Italian 1% Serbian 1%
- Foreign-born
- 2% · Canada
- Languages at home
- 95% English-only · Spanish 2% German/W. Germanic 2%
Political lean MEDSL · Hale
- 2024 margin
- Lean D (+6.8) · D 53.1% · R 46.2%
- 2008→2024 swing
- -14.8pp toward R · 2008: 21.7pp · 2024: 6.8pp
- All cycles
- 2024: D+6.8 2020: D+18.9 2016: D+20.0 2012: D+25.4 2008: D+21.7
Not yet ingested
- Civics
- —
Market trends
- HPI YoY
- ▼ -5.65%
- Current HPI
- 228.547
- Rent YoY
- —
- Metro
- —
- State GDP YoY
- ▲ 2.94%
- F500 in state
- 4
Industry mix (Fortune 500 HQ in AL)
| Industry | F500 HQs | Revenue |
|---|---|---|
| Financial Services | 1 | $8B |
|
||
| Healthcare | 1 | $5B |
|
||
Price history
2 events — show timeline
- 2026-04-17 Pending — WAMLS
- 2026-04-09 Listed $199,000 WAMLS
Property tax history
+4.5%/yrLatest (2025): $489 · +7.5% YoY. Source: county tax records.
Cash-flow waterfall
monthlySold comps — $/sqft
last 12 mo · ≤1 miLoading sold comps…