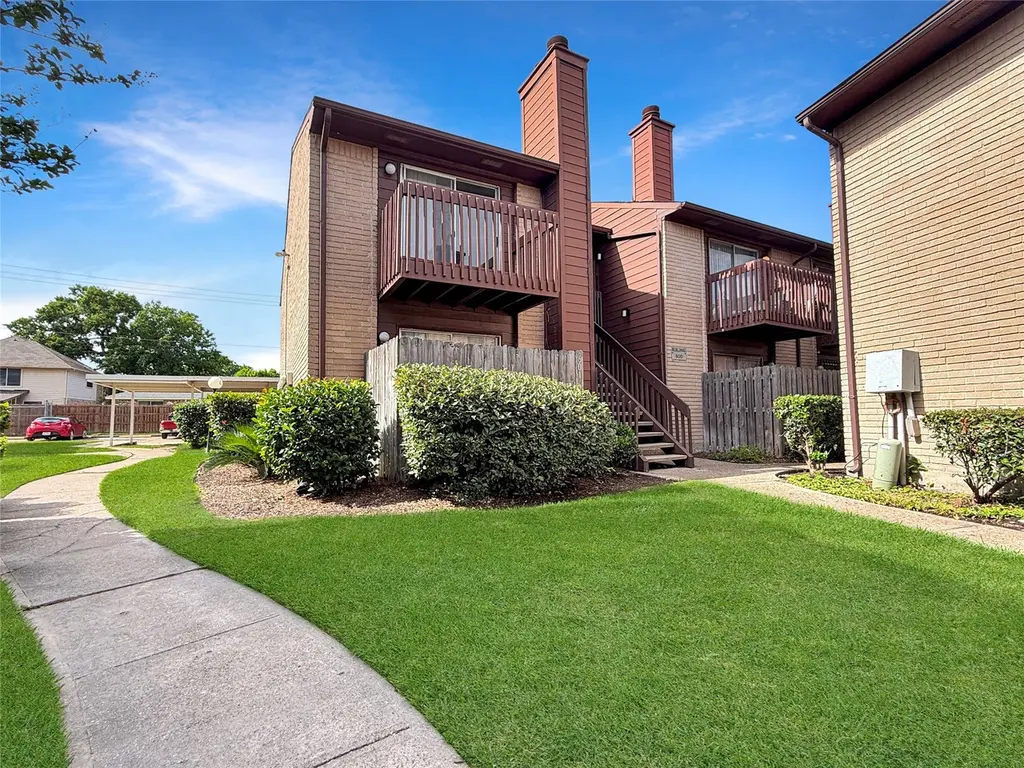
12905 Woodforest Blvd #601 · Houston, TX
Flood risk 1/10 · Minimal
- FEMA flood zone
- X (unshaded)
- Chance of flooding over 30 yrs
- 0.0%
- Est. flood insurance / yr
- $507 – $1,088
Fire risk 1/10 · Minimal
- Est. fire insurance / yr
- $1,222 – $2,270
Heat risk 10/10 · Severe
- Hot days now (above 109°F)
- 7 days/yr
- Hot days in 30 yrs
- 26 days/yr
Wind risk 9/10 · Severe
- Chance of severe wind over 30 yrs
- 99.0%
Air-quality risk 2/10 · Minimal
- Unhealthy air days now
- 2 days/yr
- Unhealthy air days in 30 yrs
- 2 days/yr
Risk factors via First Street. Map © Google.
Why this score? — see what drove the C- grade
The composite is a weighted blend of 9 inputs, each scored 0–100. Each bar is that input's sub-score; the figure is the points it added to the 100-point composite (weight × sub-score).
- Cash flow +15.3/30.0
- ARV discount +13.2/15.0
- 1% rule +10.0/10.0
- DSCR +4.7/10.0
- Livability +3.7/5.0
- Schools +2.8/10.0
- Condition / age +2.5/5.0
- Rent growth +2.3/5.0
- Appreciation +0.0/10.0
$62,000
🖨 Deal sheet 📄 Offer letter ✓ Due diligence
Listing remarks MLS
Very well maintained 1 bedroom/1bath. Parking is close to the unit. Property is gated. Close to shopping and bus line.
Key facts
- Gated community
- Community pool
- $315 HOA
Tags
Property features AI
Finance
- Financial info: Lease considered
- HOA & community: Prestige Association Mgmnt. Group; Monthly association fee (includes common area and structure maintenance); Community pool
Exterior
- Parking: Laundry area accessed from garage (laundry in garage)
- Security: Security gate; Smoke detector(s)
- Utilities: Public water; Public sewer
- Home design: Residential condo; One story; Full ownership; Built in 1982
- Construction: Brick and wood siding exterior; Composition roof; Slab foundation
- Exterior features: Community/association pool; Security gate; Smoke detector(s); Asphalt and concrete road surfaces
Interior
- Kitchen: Electric range/oven; Microwave; Dishwasher; Refrigerator; Breakfast nook (approx. 8 x 8)
- Bedrooms: Primary bedroom on first floor (approx. 12 x 15)
- Flooring: Carpet; Tile
- Bathrooms: 1 full bathroom (primary bathroom on first floor, approx. 4 x 8)
- Heating & cooling: Central heating (electric); Central air conditioning (electric)
- Interior features: Breakfast bar; Ceiling fan(s); Decorative fireplace (1)
- Laundry & utility: Washer and dryer included; Laundry in garage; Electric dryer hookup
Neighborhood map
What this means for you Summary
Snapshot
- This is a 1-bed/1.0-bath condo listed at $62k.
Deal economics
- At list price, monthly cash flow is $23 ($276/yr) — positive.
- The deal already cash-flows at list — no discount required.
- Meets the 1% rule at list price ($1k rent vs $62k).
- Recommended offer: $60k (3.0% below list) — sets the bar for market timing.
- Cap rate 6.7% vs local median 3.2% in Houston — top-decile yield for the area; either an underpriced asset or a hidden risk that comps aren't pricing in. Stress-test before assuming the spread holds.
Location & tenants
- Location reads 74/100 on livability (#184 in TX, #4,771 nationally) — a middle-class / working-renter tenant base. Strengths: amenities A+, cost of living A+, housing A+; Watch: crime F.
- Galena Park ISD (suburban): math 32% / reading 33% proficiency, ranked #578 of 826 in TX (top 70%) — families likely to look elsewhere, expect single-tenant / working-renter base with shorter leases; 74% free/reduced lunch — lower-income household profile, screen leases tightly.
- Zoned schools: Normandy Crossing El (math 30% / reading 28%, grade F, #2,668 of 4,322 statewide, top 63%, 660 students, 90% FRL); Cunningham Middle (math 29% / reading 35%, grade F, #971 of 1,662 statewide, top 60%, 928 students, 89% FRL); North Shore Senior High (math 35% / reading 40%, grade F, #888 of 1,632 statewide, top 55%, 4,569 students, 86% FRL).
- Market conditions: Rents soft (-0.8%/yr); 162 active listings in the ZIP; 40 comparable units currently listed for rent nearby; rentals leasing fast (median 13d on market — plan ~1-2 weeks tenant-placement turnaround); 29,883 units permitted in Harris County in 2024 (8,621 in 5+ unit buildings).
Forward outlook
- Local home prices are declining (-3.0%/yr); year-one equity from $429 of loan paydown is wiped out by about $2k of value loss. Plan a longer hold.
- Harris County population projected at +47% by 2050 — long-run rental-demand tailwind backs the buy-and-hold thesis.
Negotiation context
- It's been on market 51 days — a 3% lower offer ($60k) is reasonable based on typical stale-listing flexibility.
- 7 sale attempts since 8y ago; this cycle's ask is 6259% above the opening price — seller raised mid-cycle; expect resistance to lowballs.
- Current owner paid $11k; list at $62k implies a 451% gain — meaningful room to come down on a strong offer.
Risks & watch-outs
- Watch-outs: HOA is 30% of rent.
- Climate carrying-cost: severe wind risk, 99% chance of damaging wind over 30y; extreme-heat days projected 7→26/yr by 2055 (HVAC capex compounding) — expect insurance premiums to compound above CPI over the hold.
Questions for the listing agent
- It's been on market 51 days. Have you received any prior offers? Is the seller open to a 3% concession, seller financing, or rate buy-down credit?
- What does the HOA fee cover, when was the last increase, and are there any pending special assessments or reserve-fund shortfalls?
- Any open or pending special assessments — roof, HVAC, plumbing, elevator, façade? What's the per-unit balance and payoff schedule, and is the seller paying it off at close or rolling it to the buyer?
- Is there a deadline driving the sale (1031 exchange, divorce, estate, relocation)? That informs how much negotiation room exists.
- Schools are D-rated, which usually means shorter tenancies and higher turnover. Who's the typical renter profile here, and what's been the actual vacancy rate?
- Crime grade is F in this area — have there been break-ins, vandalism, or insurance claims at this property in the last 3 years? What carrier currently insures it and at what premium?
- What's the average days-on-market for RENTAL listings here right now (not sales)? A rising rental-DOM trend means longer vacancies and softer asking-rent achievability than the comps imply.
- What's the recent tenant-quality profile in this submarket — average credit score on applications, eviction rate, late-payment / NSF rate, and stable-employment percentage? A property-management company in the area should have these aggregated.
- How much new apartment / multifamily construction is in the pipeline within 1–3 miles? Heavy new supply (>2% of stock underway) typically softens rents 12–24 months out; light construction supports rent growth.
Investment metrics
- 1% rule
- 1.67% ✓
- Cap rate
- 6.74%
- Cash-on-cash
- 1.59%
- DSCR
- 1.07
- GRM
- 5.0
CMA / ARV
- ARV (median comp)
- $71,039
- List price
- $62,000
- Delta
- -12.72%
- Verdict
- UNDERPRICED
- Comps
- 20 within 1.0 mi
Projected returns pro-forma
-3.0% appreciation · 0.0% rent growth · sell at horizon
- IRR
- -19.7%
- Equity multiple
- 0.34×
- Total profit
- $-11,371
- Equity at exit
- $9,244
- IRR
- -34.8%
- Equity multiple
- -0.08×
- Total profit
- $-18,752
- Equity at exit
- $5,361
Cash invested: $17,360 (down + closing). Projections, not guarantees.
Landlord ↔ Tenant lean methodology
- Overall (STATE)
- 87 Strongly Landlord-Friendly
- State Texas
- 87 Strongly Landlord-Friendly · R+5
- County
- — inherits STATE
- City
- — inherits STATE
ZIP-level market 77015
- Home prices YoY
- -10.8%
- Rents YoY
- -0.8%
- Active inventory
- 162
- Price-to-rent
- 5.0×
Monthly cashflow live
- Estimated rent
- $1,034 high interval (Pro) →
- Mortgage (P&I)
- −$325
- Tax from tax record
- −$128 /mo · $1,538/yr
- Insurance
- −$26
- HOA
- −$315
- Vacancy / Maint / Mgmt
- −$217
- Net cashflow
- $23
Break-even live
UW: 25.0% down · 7.5% · 30yr · 1.5% tax · 5.0% vac · 8.0% maint · 8.0% mgmt
Financing live
Cash to close
- Down payment
- $15,500
- Closing costs
- $1,860
- Reserves months
- —
- Total cash needed
- —
Loan-product check · same deal, 3 products live
Conventional
25% down · 7.5% · 30yr
- Down + closing
- —
- Monthly P&I
- —
- Monthly cashflow
- —
- DSCR
- —
- Eligible?
- —
Personal DTI + credit; lowest rate.
DSCR
20% down · 8.5% · 30yr
- Down + closing
- —
- Monthly P&I
- —
- Monthly cashflow
- —
- DSCR
- —
- Eligible?
- —
No personal income docs; deal must DSCR.
Hard money
10% down · 12.0% · 12mo
- Down + closing
- —
- Monthly P&I
- —
- Monthly cashflow
- —
- DSCR
- —
- Eligible?
- —
Short-term bridge; refi at stabilization.
Rent comps 40 comps
| Address | Beds | Baths | Sqft | Rent | $/sqft | DOM | Units | Dist |
|---|---|---|---|---|---|---|---|---|
| 12905 Woodforest Blvd Houston, TX | 2.0 | 1.0 | 886 | $1,098 | $1.24 | 20d | 2 | 0.03mi |
| 12955 Woodforest Blvd Unit 305 Houston, TX | 1.0 | 1.0 | 728 | $975 | $1.34 | 24d | 1 | 0.07mi |
| 12800 Woodforest Blvd Unit 12857 Houston, TX | 2.0 | 2.0 | 850 | $1,126 | $1.32 | 2d | 1 | 0.08mi |
| 456 Normandy St Houston, TX | 1.0 | 1.0 | 734 | $1,099 | $1.50 | 43d | 1 | 0.35mi |
| 13161 Woodforest Blvd Houston, TX | 2.0 | 2.0 | 965 | $1,058 | $1.10 | 43d | 1 | 0.36mi |
| 536 Normandy St Houston, TX | 2.0 | 2.0 | 860 | $1,144 | $1.33 | 43d | 1 | 0.44mi |
| 555 Normandy St Houston, TX | 1.0–2.0 | 1.0–2.0 | 745 | $818 | $1.10 | 2d | 23 | 0.50mi |
| 561 Normandy St Houston, TX | 2.0 | 2.0 | 940 | $1,200 | $1.28 | 22d | 1 | 0.51mi |
| 561 Normandy St Houston, TX | 1.0 | 1.0 | 680 | $999 | $1.47 | 24d | 1 | 0.51mi |
| 561 Normandy St Houston, TX | 2.0 | 2.0 | 940 | $1,200 | $1.28 | 43d | 1 | 0.51mi |
| 695 Normandy St Houston, TX | 1.0–2.0 | 1.0–2.0 | 788 | $899 | $1.14 | 12d | 30 | 0.58mi |
| 250 Uvalde Rd Houston, TX | 1.0–3.0 | 1.0–2.0 | 909 | $739 | $0.81 | 2d | 26 | 0.71mi |
| 13025 Joliet St Unit A Houston, TX | 1.0 | 1.0 | 842 | $925 | $1.10 | 24d | 1 | 0.72mi |
| 316 White Cedar St Houston, TX | 1.0 | 1.0 | 712 | $1,035 | $1.45 | 22d | 1 | 0.80mi |
| 316 White Cedar St Houston, TX | 2.0 | 2.0 | 1028 | $1,306 | $1.27 | 24d | 1 | 0.80mi |
| 316 White Cedar St Houston, TX | 1.0 | 1.0 | 712 | $1,035 | $1.45 | 19d | 1 | 0.80mi |
| 14340 Wallisville Rd Unit 2047 Houston, TX | 2.0 | 2.0 | 940 | $1,425 | $1.52 | 11d | 1 | 0.81mi |
| 14340 Wallisville Rd Unit 1162 Houston, TX | 1.0 | 1.0 | 670 | $1,080 | $1.61 | 5d | 1 | 0.81mi |
| 14340 Wallisville Rd Unit 2148 Houston, TX | 2.0 | 2.0 | 940 | $1,382 | $1.47 | 2d | 1 | 0.81mi |
| 14340 Wallisville Rd Unit 2162 Houston, TX | 2.0 | 2.0 | 940 | $1,390 | $1.48 | 5d | 1 | 0.81mi |
| 14340 Wallisville Rd Houston, TX | 1.0 | 1.0 | 670 | $1,069 | $1.60 | 12d | 1 | 0.81mi |
| 14340 Wallisville Rd Unit 325 Houston, TX | 1.0 | 1.0 | 670 | $1,077 | $1.61 | 2d | 1 | 0.81mi |
| 14346 Wallisville Rd Houston, TX | 2.0 | 2.0 | 936 | $1,360 | $1.45 | 43d | 1 | 0.81mi |
| 14340 Wallisville Rd Unit 14361 Houston, TX | 1.0 | 1.0 | 670 | $1,077 | $1.61 | 2d | 1 | 0.82mi |
| 14340 Wallisville Rd Unit 14397 Houston, TX | 2.0 | 2.0 | 936 | $1,410 | $1.51 | 43d | 1 | 0.82mi |
| 14340 Wallisville Rd Unit 14391 Houston, TX | 1.0 | 1.0 | 669 | $1,090 | $1.63 | 43d | 1 | 0.82mi |
| 14340 Wallisville Rd Unit 425 Houston, TX | 2.0 | 2.0 | 940 | $1,382 | $1.47 | 2d | 1 | 0.82mi |
| 14340 Wallisville Rd Unit 14361 Houston, TX | 1.0 | 1.0 | 669 | $1,095 | $1.64 | 12d | 1 | 0.82mi |
| 14340 Wallisville Rd Unit 14377 Houston, TX | 2.0 | 2.0 | 940 | $1,414 | $1.50 | 10d | 1 | 0.82mi |
| 353 Audrey Ln Unit 365 1/2 Houston, TX | 2.0 | 1.0 | 800 | $1,375 | $1.72 | 43d | 1 | 0.86mi |
| 14445 Wallisville Rd Houston, TX | 2.0 | 1.0–2.0 | 659 | $976 | $1.48 | 1d | 10 | 0.93mi |
| 5675 Purple Sage Rd Houston, TX | 1.0–2.0 | 1.0–2.0 | 782 | $1,039 | $1.33 | 3d | 18 | 0.93mi |
| 799 Normandy St Houston, TX | 1.0–2.0 | 1.0–2.0 | 843 | $929 | $1.10 | 1d | 13 | 0.94mi |
| 13502 N Thorntree Dr Unit 13523 Houston, TX | 1.0 | 1.0 | 635 | $869 | $1.37 | 12d | 1 | 0.97mi |
| 13502 N Thorntree Dr Unit 13553 Houston, TX | 1.0 | 1.0 | 635 | $864 | $1.36 | 43d | 1 | 0.97mi |
| 13502 N Thorntree Dr Unit 424 Houston, TX | 2.0 | 2.0 | 766 | $939 | $1.23 | 5d | 1 | 0.97mi |
| 13502 N Thorntree Dr Unit 425 Houston, TX | 2.0 | 2.0 | 766 | $963 | $1.26 | 10d | 1 | 0.97mi |
| 13502 N Thorntree Dr Unit 13523 Houston, TX | 1.0 | 1.0 | 583 | $781 | $1.34 | 2d | 1 | 0.97mi |
| 12516 Orleans St Houston, TX | 2.0 | 2.0 | 995 | $1,275 | $1.28 | 24d | 1 | 0.97mi |
| 13502 N Thorntree Dr Unit 1047 Houston, TX | 1.0 | 1.0 | 583 | $824 | $1.41 | 11d | 1 | 0.97mi |
HOA detail condo
- Monthly dues
- $315 · $3,780/yr
- Likely covers
- security
- Assessments
- None detected in remarks — confirm with the listing agent.
Listing history 32 events
-
2026-06-18days on market $62,000 Active 51 DOM
-
2026-06-17days on market $62,000 Active 50 DOM
-
2026-06-16days on market $62,000 Active 49 DOM
-
2026-06-15days on market $62,000 Active 48 DOM
-
2026-06-13days on market $62,000 Active 46 DOM
-
2026-06-13days on market $62,000 Active 45 DOM
-
2026-06-09days on market $62,000 Active 42 DOM
-
2026-06-08days on market $62,000 Active 41 DOM
-
2026-06-07days on market $62,000 Active 40 DOM
-
2026-06-04days on market $62,000 Active 37 DOM
-
2026-06-03days on market $62,000 Active 36 DOM
-
2026-06-02days on market $62,000 Active 35 DOM
-
2026-06-01days on market $62,000 Active 34 DOM
-
2026-05-31days on market $62,000 Active 33 DOM
-
2026-04-30$975
-
2026-04-28$62,000 Active 592-char remark
-
2026-04-14historical
-
2025-11-07$64,000 Active
-
2025-10-29historical $895
-
2025-10-03$895
-
2025-10-02historical $895
-
2025-07-12$895
-
2024-03-08historical $895
-
2023-12-22$895
-
2018-09-26soldstatus
-
2018-07-05soldstatus
-
2018-07-02soldstatus Sold
Show marketing remark (118 chars)
Very well maintained 1 bedroom/1bath. Parking is close to the unit. Property is gated. Close to shopping and bus line.
-
2018-06-29status Pending
Show marketing remark (118 chars)
Very well maintained 1 bedroom/1bath. Parking is close to the unit. Property is gated. Close to shopping and bus line.
-
2018-06-26status Option Pending
Show marketing remark (118 chars)
Very well maintained 1 bedroom/1bath. Parking is close to the unit. Property is gated. Close to shopping and bus line.
-
2018-05-14$43,900 Active
Show marketing remark (118 chars)
Very well maintained 1 bedroom/1bath. Parking is close to the unit. Property is gated. Close to shopping and bus line.
-
2015-07-24soldstatus
-
1988-01-20soldstatus $11,250
ⓘ Source: listings_history table (triggers on properties + properties_extension) + one-shot
backfill from property_details.listing_events for pre-trigger history.
Tax reassessment forecast TX · Resets to sale price
- Current annual tax
- $1,538 · $128/mo
- Projected year-2 tax
- $1,538 · $128/mo
- Expected delta
- $0/yr ($0/mo · 0.0%)
ⓘ Screening estimate from a state-policy table — verify with the county assessor before closing.
Climate risk First Street
- Flood 1/10 Low FEMA zone X (unshaded) · 0% chance over 30 yrs
- Wildfire 1/10 Low
- Heat 10/10 Extreme 7 d/yr ≥109°F today · 26 d/yr by 30 yrs out
- Wind 9/10 Extreme 99% chance of damaging wind over 30 yrs
- Air quality 2/10 Low 2 unhealthy d/yr today · 2 by 30 yrs out
Nearby sold comps map
Loading sold comps map…
Walkable amenities ~0.75 mi
Loading nearby amenities…
Taxation est. · year 1
- Rental income
- $12,412
- − Mortgage interest
- −$3,473
- − Property taxes
- −$1,538
- − Insurance
- −$310
- − Repairs & maintenance
- −$993
- − Management
- −$993
- − HOA
- −$3,780
- − Depreciation
- −$1,804
- Taxable loss
- −$478
- Est. tax savings @ 24.0%
- +$115
- After-tax cash flow
- $391/yr
For passive investors: Depreciation is non-cash, so a rental often shows a tax loss while cash-flowing — sheltering income. Rental losses are passive: they offset passive income freely, and up to $25,000/yr can offset ordinary (W-2) income if you actively participate and your MAGI is under $100k (phasing out to $0 by $150k); unused losses carry forward. On sale, claimed depreciation is recaptured at up to 25%, and gains may owe capital-gains tax (a 1031 exchange can defer both). Figures are a year-1 estimate at your 24.0% rate — not tax advice; consult a CPA.
Schools (NCES district)
- District
- Galena Park ISD
- NCES district ID
- 4820250
- Math proficiency
- 32% ▼ -20.00%
- Reading proficiency
- 33% ▼ -7.00%
- Median HH income
- $43,158
- Composite
- 27.62/100
- National rank
- #6927
- State rank
- #578 of 826 in TX
Livability — Houston
- Score
- 74/100
- State rank
- #184
- US rank
- #4771
Category grades
Schools grade is shown separately in the Schools card above.
Census & demographics
- County
- Harris County · 4,702,590 people
- City population
- 3,226,434
- Metro
- Houston-The Woodlands-Sugar Land, TX
- Population (ZIP)
- 58,415
- Household income
- $57,753
- Rent vs Own
- Severe rent burden
- 1816.0
Population outlook (Harris County) Hauer SSP2
- Today (2025)
- 5,571,493 people
- By 2030
- 6,089,821 · +9.3%
- By 2040
- 7,142,806 · +28.2%
- By 2050
- 8,185,864 · +46.9%
- By 2075
- 10,574,329 · +89.8%
- By 2100
- 12,109,958 · +117.4%
Race, ethnicity, and origin ACS 2023
- Neighborhood character
- Predominantly Hispanic (77%)
- Race & ethnicity
- Hispanic / Latino 77% Two or more races 54% Black 14% White 6% Asian 1% Native American 1%
- Hispanic origin (detail)
- Mexican 60% Cuban 2%
- Foreign-born
- 33% · Canada, Vietnam
- Languages at home
- 31% English-only · Spanish 68% Vietnamese 1%
Political lean MEDSL · Harris
- 2024 margin
- Lean D (+5.5) · D 52.0% · R 46.4% · Other 1.6%
- 2008→2024 swing
- +3.9pp toward D · 2008: 1.6pp · 2024: 5.5pp
- All cycles
- 2024: D+5.5 2020: D+13.3 2016: D+12.4 2012: D+0.1 2008: D+1.6
Not yet ingested
- Civics
- —
Market trends
- HPI YoY
- ▼ -36.47%
- Current HPI
- 300.1821
- Rent YoY
- ▼ -0.83%
- Metro
- Houston-The Woodlands-Sugar Land, TX
- State GDP YoY
- ▲ 3.95%
- F500 in state
- 110
Industry mix (Fortune 500 HQ in TX)
| Industry | F500 HQs | Revenue |
|---|---|---|
| Energy | 16 | $1,198B |
|
||
| Technology | 5 | $198B |
|
||
| Engineering / Construction | 4 | $72B |
|
||
| Energy Services | 3 | $60B |
|
||
| Utilities | 3 | $41B |
|
||
| Healthcare | 2 | $330B |
|
||
Price history
+451.1% since first listed19 events — show timeline
- 2026-05-29 Price Changed $925 HARMLS
- 2026-04-30 Listed for Rent $975 HARMLS
- 2026-04-28 Listed $62,000 HARMLS
- 2026-04-14 Listing Removed — HARMLS
- 2025-11-07 Listed $64,000 HARMLS
- 2025-10-29 Rental Removed $895 HARMLS
- 2025-10-03 Listed for Rent $895 HARMLS
- 2025-10-02 Rental Removed $895 HARMLS
- 2025-07-12 Listed for Rent $895 HARMLS
- 2024-03-08 Rental Removed $895 HARMLS
- 2023-12-22 Listed for Rent $895 HARMLS
- 2018-09-26 Sold (Public Records) — Public Records
- 2018-07-05 Sold (Public Records) — Public Records
- 2018-07-02 Sold (MLS) — HARMLS
- 2018-06-29 Pending — HARMLS
- 2018-06-26 Pending — HARMLS
- 2018-05-14 Listed $43,900 HARMLS
- 2015-07-24 Sold (Public Records) — Public Records
- 1988-01-20 Sold (Public Records) $11,250 Public Records
Property tax history
+10.3%/yrLatest (2025): $1,538 · +19.8% YoY. Source: county tax records.
Cash-flow waterfall
monthlySold comps — $/sqft
last 12 mo · ≤1 miLoading sold comps…