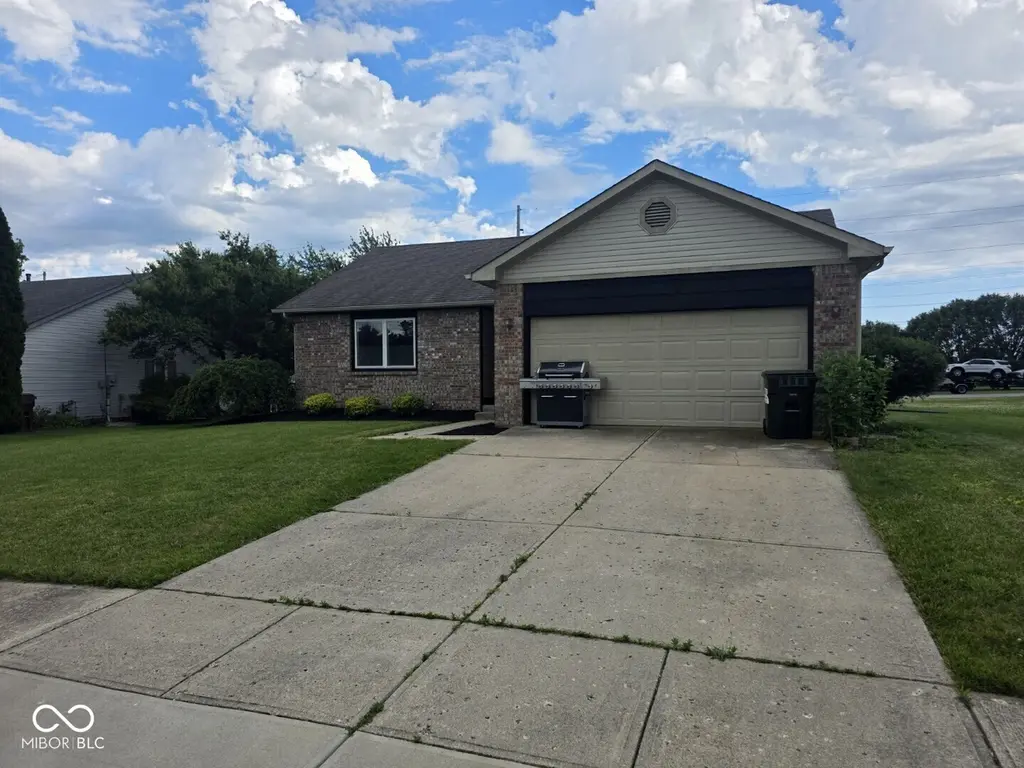
271 Bear Story Ct · Greenfield, IN
Flood risk 1/10 · Minimal
- FEMA flood zone
- X (unshaded)
- Chance of flooding over 30 yrs
- 0.0%
- Est. flood insurance / yr
- $507 – $1,088
Fire risk 1/10 · Minimal
- Est. fire insurance / yr
- $717 – $1,331
Heat risk 3/10 · Minor
- Hot days now (above 101°F)
- 7 days/yr
- Hot days in 30 yrs
- 18 days/yr
Wind risk 2/10 · Minimal
- Chance of severe wind over 30 yrs
- 1.0%
Air-quality risk 2/10 · Minimal
- Unhealthy air days now
- 1 days/yr
- Unhealthy air days in 30 yrs
- 2 days/yr
Risk factors via First Street. Map © Google.
Why this score? — see what drove the D grade
The composite is a weighted blend of 9 inputs, each scored 0–100. Each bar is that input's sub-score; the figure is the points it added to the 100-point composite (weight × sub-score).
- Cash flow +13.2/30.0
- ARV discount +6.8/15.0
- DSCR +4.0/10.0
- Schools +4.0/10.0
- Livability +3.7/5.0
- Rent growth +3.2/5.0
- 1% rule +3.0/10.0
- Condition / age +2.5/5.0
- Appreciation +0.0/10.0
$230,000
🖨 Deal sheet 📄 Offer letter ✓ Due diligence
Listing remarks MLS
Immaculate well kept home in an established neighborhood at a price that is still affordable. The sellers have replaced the roof in 2016, water heater in 2016, disposal in 2016, dishwasher 2016 and furnace and A/C 2016. Refrigerator 2016. This home is a must to see. The backyard deck can accommodate a large party or give you room to stretch out and enjoy the outdoors. All of this sits on 3 tenths of an acre. Don't let this one pass by.
Key facts
- Wrap-around kitchen
- Raised breakfast bar
- Open green yard
Tags
Property features AI
Exterior
- Parking: Attached 2-car garage (about 400 sq ft)
- Utilities: Public water; Municipal sewer
- Home design: Single-family residence; One-story
- Construction: Vinyl with brick exterior; Crawl space foundation
- Exterior features: Approximately 0.31-acre lot (1/4–1/2 acre)
Interior
- Kitchen: Electric cooktop; Electric oven; Range hood; Microhood; Dishwasher; Garbage disposal; Refrigerator; Water softener (owned)
- Bedrooms: 3 bedrooms on the main level
- Bathrooms: 2 full bathrooms (both on main level)
- Heating & cooling: Forced air heating (natural gas); Central air conditioning
- Interior features: Attic access; Vaulted ceilings; Eat-in kitchen
- Laundry & utility: Main-level laundry
Neighborhood map
What this means for you Summary
Snapshot
- This is a 3-bed/2.0-bath single-family listed at $230k.
Deal economics
- At list price, monthly cash flow is $-4 ($-45/yr) — negative.
- To cash-flow at today's rent, offer at most $229k (0.3% below list).
- To meet the 1% rule (rent ≥ 1% of price), the offer needs to be $185k (19.7% below list).
- Recommended offer: $185k (19.7% below list) — sets the bar for 1% rule.
- Cap rate 6.3% vs local median 4.4% in Greenfield — top-decile yield for the area; either an underpriced asset or a hidden risk that comps aren't pricing in. Stress-test before assuming the spread holds.
Location & tenants
- Location reads 73/100 on livability (#88 in IN) — a middle-class / working-renter tenant base. Strengths: cost of living A+, housing A+; Watch: amenities F, commute F.
- Greenfield-Central Community Schools (other): math 47% / reading 45% proficiency, ranked #83 of 301 in IN (top 28%) — families likely to look elsewhere, expect single-tenant / working-renter base with shorter leases.
- Zoned schools: Greenfield-Central High School (math 37% / reading 65%, grade D+, #115 of 369 statewide, top 31%, 1,462 students, 35% FRL).
- Market conditions: Rents rising (+2.9%/yr); 481 active listings in the ZIP; 7 comparable units currently listed for rent nearby; rentals leasing fast (median 4d on market — plan ~1-2 weeks tenant-placement turnaround); solid renter incomes; 1,091 units permitted in Hancock County in 2024 (0 in 5+ unit buildings).
Forward outlook
- Local home prices are declining (-3.0%/yr); year-one equity from $2k of loan paydown is wiped out by about $7k of value loss. Plan a longer hold.
- Hancock County population projected at +7% by 2050 — modest demand growth; plan on rents tracking national, not racing it.
Negotiation context
- Only 1 days on market — expect competitive offers; lowballing is unlikely to land.
- 4 sale attempts since 11y ago with the ask held roughly flat each time — persistent listings suggest the price (not the market) is what's stuck; bring a comps-based counter.
- Current owner paid $138k; list at $230k implies a 66% gain — meaningful room to come down on a strong offer.
Questions for the listing agent
- What do current leases actually rent for vs. the listed asking? Can we see a recent rent roll and the last 12 months of T-12 income?
- Is there a deadline driving the sale (1031 exchange, divorce, estate, relocation)? That informs how much negotiation room exists.
- Schools are B-rated — typically a magnet for longer-tenancy family renters. What's the average tenant stay here, and is there a school-zone premium baked into asking?
- The area grade is low — what's the realistic commute time and amenity access for the typical tenant pool here? Any planned neighborhood developments (good or bad) we should know about?
- What's the average days-on-market for RENTAL listings here right now (not sales)? A rising rental-DOM trend means longer vacancies and softer asking-rent achievability than the comps imply.
- What's the recent tenant-quality profile in this submarket — average credit score on applications, eviction rate, late-payment / NSF rate, and stable-employment percentage? A property-management company in the area should have these aggregated.
- How much new for-sale + rental construction is in the pipeline within 1–3 miles? Heavy new supply typically softens prices + rents 12–24 months out; constrained supply supports both.
Investment metrics
- 1% rule
- 0.80% ✗
- Cap rate
- 6.27%
- Cash-on-cash
- -0.07%
- DSCR
- 1.00
- GRM
- 10.4
CMA / ARV
- ARV (on-the-fly)
- $226,408
- Comps found
- 12
Show comp detail 12 sales within ~0.75 mi
| Address | Dist | Beds/Ba | Sqft | Sold | Price | $/sf | Match |
|---|---|---|---|---|---|---|---|
| 63 Longfellow Ln | 0.15mi | 3/2.0 | 1,294 (+4%) | 1mo | $259,900 | $201 | 85 |
| 378 Longfellow Ct | 0.26mi | 3/2.0 | 1,220 (-2%) | 7mo | $252,000 | $207 | 79 |
| 849 Center St | 0.26mi | 3/2.0 | 1,200 (-4%) | 4mo | $230,000 | $192 | 79 |
| 261 Punkin Ct | 0.17mi | 3/2.0 | 1,207 (-3%) | 12mo | $220,000 | $182 | 77 |
| 818 Center St | 0.30mi | 3/2.0 | 1,332 (+7%) | 1mo | $255,000 | $191 | 73 |
| 1188 Orphant Annie Dr | 0.18mi | 3/2.0 | 1,365 (+10%) | 3mo | $250,000 | $183 | 73 |
| 716 S State St | 0.36mi | 2/1.0 (-1) | 1,248 (+0%) | 1mo | $175,000 | $140 | 72 |
| 517 W Pierson St | 0.66mi | 3/2.0 | 1,260 (+1%) | 9mo | $204,999 | $163 | 60 |
| 103 W Osage St | 0.66mi | 2/2.0 (-1) | 1,248 (+0%) | 8mo | $158,000 | $127 | 57 |
| 104 Forest Ave | 0.60mi | 3/1.0 | 1,353 (+9%) | 7mo | $195,000 | $144 | 47 |
| 419 W Osage St | 0.67mi | 3/2.0 | 1,400 (+12%) | 7mo | $162,000 | $116 | 42 |
| 11 W Osage St | 0.68mi | 2/1.0 (-1) | 1,321 (+6%) | 11mo | $179,614 | $136 | 40 |
Match score weights: distance 35% · size 25% · config 20% · recency 20%. Top-matched comps best support the ARV.
Projected returns pro-forma
-3.0% appreciation · 2.88% rent growth · sell at horizon
- IRR
- -16.6%
- Equity multiple
- 0.41×
- Total profit
- $-37,782
- Equity at exit
- $34,294
- IRR
- -8.6%
- Equity multiple
- 0.47×
- Total profit
- $-34,322
- Equity at exit
- $19,886
Cash invested: $64,400 (down + closing). Projections, not guarantees.
Landlord ↔ Tenant lean methodology
- Overall (STATE)
- 90 Strongly Landlord-Friendly
- State Indiana
- 90 Strongly Landlord-Friendly · R+11
- County
- — inherits STATE
- City
- — inherits STATE
ZIP-level market 46140
- Rents YoY
- 2.9%
- Active inventory
- 481
- Price-to-rent
- 10.4×
Monthly cashflow live
- Estimated rent
- $1,848 high interval (Pro) →
- Mortgage (P&I)
- −$1,206
- Tax from tax record
- −$162 /mo · $1,940/yr
- Insurance
- −$96
- HOA
- −$0
- Vacancy / Maint / Mgmt
- −$388
- Net cashflow
- $-4
Break-even live
UW: 25.0% down · 7.5% · 30yr · 1.5% tax · 5.0% vac · 8.0% maint · 8.0% mgmt
Financing live
Cash to close
- Down payment
- $57,500
- Closing costs
- $6,900
- Reserves months
- —
- Total cash needed
- —
Loan-product check · same deal, 3 products live
Conventional
25% down · 7.5% · 30yr
- Down + closing
- —
- Monthly P&I
- —
- Monthly cashflow
- —
- DSCR
- —
- Eligible?
- —
Personal DTI + credit; lowest rate.
DSCR
20% down · 8.5% · 30yr
- Down + closing
- —
- Monthly P&I
- —
- Monthly cashflow
- —
- DSCR
- —
- Eligible?
- —
No personal income docs; deal must DSCR.
Hard money
10% down · 12.0% · 12mo
- Down + closing
- —
- Monthly P&I
- —
- Monthly cashflow
- —
- DSCR
- —
- Eligible?
- —
Short-term bridge; refi at stabilization.
Rent comps 7 comps
| Address | Beds | Baths | Sqft | Rent | $/sqft | DOM | Units | Dist |
|---|---|---|---|---|---|---|---|---|
| 713 Cattail Dr Greenfield, IN | 3.0 | 2.0 | 1498 | $2,045 | $1.37 | 2d | 1 | 0.39mi |
| 968 Lotus Dr Greenfield, IN | 3.0–5.0 | 2.0–3.0 | 2049 | $2,045 | $1.00 | 1d | 8 | 0.65mi |
| 821 W 7th St Greenfield, IN | 2.0 | 2.0 | 1234 | $1,700 | $1.38 | 23d | 1 | 1.25mi |
| 220 Walker St Greenfield, IN | 3.0 | 1.0 | 1101 | $1,400 | $1.27 | 4d | 1 | 1.29mi |
| 432 Baldwin St Greenfield, IN | 2.0 | 1.0 | 788 | $1,425 | $1.81 | 23d | 1 | 1.30mi |
| 550 Wood St Greenfield, IN | 2.0 | 1.0 | 1162 | $1,200 | $1.03 | 3d | 1 | 1.34mi |
| 1027 E Fourth St Greenfield, IN | 3.0 | 2.0 | 1430 | $1,700 | $1.19 | 23d | 1 | 1.46mi |
Listing history 2 events
-
2026-06-17remarks 699-char remark
-
2026-06-17$230,000 Active 1 DOM
ⓘ Source: listings_history table (triggers on properties + properties_extension) + one-shot
backfill from property_details.listing_events for pre-trigger history.
Tax reassessment forecast IN · Partial reset (capped growth)
- Current annual tax
- $1,940 · $162/mo
- Projected year-2 tax
- $1,948 · $162/mo
- Expected delta
- +$7/yr (+$1/mo · 0.4%)
ⓘ Screening estimate from a state-policy table — verify with the county assessor before closing.
Climate risk First Street
- Flood 1/10 Low FEMA zone X (unshaded) · 0% chance over 30 yrs
- Wildfire 1/10 Low
- Heat 3/10 Moderate 7 d/yr ≥101°F today · 18 d/yr by 30 yrs out
- Wind 2/10 Low 100% chance of damaging wind over 30 yrs
- Air quality 2/10 Low 1 unhealthy d/yr today · 2 by 30 yrs out
Nearby sold comps map
Loading sold comps map…
Walkable amenities ~0.75 mi
Loading nearby amenities…
Taxation est. · year 1
- Rental income
- $22,176
- − Mortgage interest
- −$12,884
- − Property taxes
- −$1,940
- − Insurance
- −$1,150
- − Repairs & maintenance
- −$1,774
- − Management
- −$1,774
- − Depreciation
- −$6,691
- Taxable loss
- −$4,037
- Est. tax savings @ 24.0%
- +$969
- After-tax cash flow
- $924/yr
For passive investors: Depreciation is non-cash, so a rental often shows a tax loss while cash-flowing — sheltering income. Rental losses are passive: they offset passive income freely, and up to $25,000/yr can offset ordinary (W-2) income if you actively participate and your MAGI is under $100k (phasing out to $0 by $150k); unused losses carry forward. On sale, claimed depreciation is recaptured at up to 25%, and gains may owe capital-gains tax (a 1031 exchange can defer both). Figures are a year-1 estimate at your 24.0% rate — not tax advice; consult a CPA.
Schools (NCES district)
- District
- Greenfield-Central Community Schools
- NCES district ID
- 1804050
- Math proficiency
- 47% ▼ -12.00%
- Reading proficiency
- 45% ▼ -11.00%
- Median HH income
- $55,533
- Composite
- 40.01/100
- National rank
- #3827
- State rank
- #83 of 301 in IN
Livability — Greenfield
- Score
- 73/100
- State rank
- #88
- US rank
- #5094
Category grades
Schools grade is shown separately in the Schools card above.
Census & demographics
- Census place
- Greenfield, IN
- County
- Hancock County · 59,521 people
- City population
- 43,511
- Metro
- Indianapolis-Carmel-Anderson, IN
- Population (ZIP)
- 43,511
- Household income
- $83,056
- Rent vs Own
- Severe rent burden
- 795.0
Population outlook (Hancock County) Hauer SSP2
- Today (2025)
- 77,820 people
- By 2030
- 79,914 · +2.7%
- By 2040
- 82,734 · +6.3%
- By 2050
- 83,348 · +7.1%
- By 2075
- 82,439 · +5.9%
- By 2100
- 74,181 · -4.7%
Race, ethnicity, and origin ACS 2023
- Neighborhood character
- Predominantly White (92%)
- Race & ethnicity
- White 92% Two or more races 5% Hispanic / Latino 3% Black 1%
- Common ancestry
- Italian 3% Lithuanian 3% Slovak 1%
- Foreign-born
- 3% · Canada
- Languages at home
- 96% English-only · Spanish 2% Other Indo-European 1%
Political lean MEDSL · Hancock
- 2024 margin
- Solid R (+33.7) · D 32.2% · R 65.9% · Other 1.9%
- 2008→2024 swing
- -4.1pp toward R · 2008: -29.6pp · 2024: -33.7pp
- All cycles
- 2024: R+33.7 2020: R+37.5 2016: R+44.8 2012: R+41.0 2008: R+29.6
Not yet ingested
- Civics
- —
Market trends
- HPI YoY
- ▼ -131.67%
- Current HPI
- 225.0367
- Rent YoY
- ▲ 2.88%
- Metro
- Indianapolis-Carmel-Anderson, IN
- State GDP YoY
- ▲ 2.90%
- F500 in state
- 18
Industry mix (Fortune 500 HQ in IN)
| Industry | F500 HQs | Revenue |
|---|---|---|
| Industrial Machinery | 2 | $37B |
|
||
| Healthcare | 1 | $177B |
|
||
| Pharmaceuticals | 1 | $45B |
|
||
| Metals / Steel | 1 | $18B |
|
||
| Agriculture | 1 | $17B |
|
||
| Packaging | 1 | $12B |
|
||
Price history
+101.8% since first listed10 events — show timeline
- 2026-06-17 Listed $230,000 MIBOR as Distributed by MLS Grid
- 2018-08-06 Sold (MLS) $138,500 MIBOR as Distributed by MLS Grid
- 2018-07-09 Pending — MIBOR as Distributed by MLS Grid
- 2018-07-05 Listed $138,500 MIBOR as Distributed by MLS Grid
- 2016-02-29 Sold (MLS) $119,000 MIBOR as Distributed by MLS Grid
- 2016-01-16 Pending — MIBOR as Distributed by MLS Grid
- 2015-10-30 Relisted — MIBOR as Distributed by MLS Grid
- 2015-10-30 Price Changed $119,000 MIBOR as Distributed by MLS Grid
- 2015-10-21 Pending — MIBOR as Distributed by MLS Grid
- 2015-10-19 Listed $114,000 MIBOR as Distributed by MLS Grid
Property tax history
+7.8%/yrLatest (2025): $1,940 · -7.4% YoY. Source: county tax records.
Cash-flow waterfall
monthlySold comps — $/sqft
last 12 mo · ≤1 miLoading sold comps…