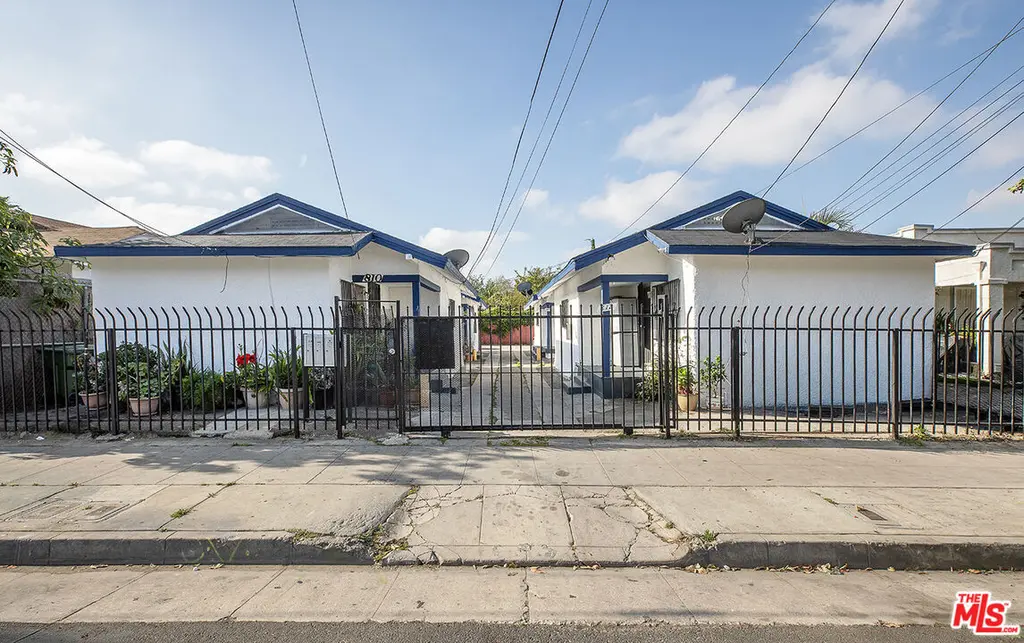
 Fourplex
810 W 43rd St · Los Angeles, CA
Flood risk 1/10 · Minimal
- FEMA flood zone
- X (unshaded)
- Chance of flooding over 30 yrs
- 0.0%
- Est. flood insurance / yr
- $507 – $1,088
Fire risk 1/10 · Minimal
- Est. fire insurance / yr
- $659 – $1,223
Heat risk 6/10 · Moderate
- Hot days now (above 88°F)
- 7 days/yr
- Hot days in 30 yrs
- 22 days/yr
Wind risk 1/10 · Minimal
- Chance of severe wind over 30 yrs
- —
Air-quality risk 5/10 · Moderate
- Unhealthy air days now
- 7 days/yr
- Unhealthy air days in 30 yrs
- 7 days/yr
Risk factors via First Street. Map © Google.
Why this score? — see what drove the B- grade
The composite is a weighted blend of 9 inputs, each scored 0–100. Each bar is that input's sub-score; the figure is the points it added to the 100-point composite (weight × sub-score).
- Cash flow +24.6/30.0
- ARV discount +14.7/15.0
- DSCR +7.9/10.0
- 1% rule +5.8/10.0
- Schools +3.6/10.0
- Livability +3.4/5.0
- Rent growth +2.9/5.0
- Condition / age +2.5/5.0
- Appreciation +0.0/10.0
$700,000
🖨 Deal sheet (PDF) 📄 Offer letter ✓ Due diligence
Multi-family units
County records classify this as Multi-Family (2-4 Unit). Listing-text estimate: 4 units. confirmed
Listing remarks
810812 W 43rd St presents a compelling owner-user opportunity to live and generate income in one of Los Angeles' most active growth corridors near USC, BMO Stadium, and Exposition Park. This 4-unit property consists of detached 1-bedroom/1-bath bungalows with no shared walls, offering a more private, home-like feel that consistently attracts renters. One newly remodeled unit will be delivered vacant, allowing a buyer to move in immediately while collecting income from the remaining three units, creating a powerful "live for less" scenario. The property currently generates approximately $3,398 per month with projected market rents near $8,000, providing clear upside through gradua
Key facts
- Strong rental demand
- Detached bungalows
- Newly remodeled unit
Tags
Property features AI
Finance
- Financial info: Actual annual gross rent reported as $64,776; Net operating income reported as $50,000; Total annual expenses reported as $15,000; Cap rate about 7%; Gross rent multiplier about 10.8; Reported vacancy rate 25%; Units are a mix of 1-, 2-, and 3- bedroom types (unit-type codes provided); Number of buildings: 4; Water heaters present
- HOA & community: No HOA amenities; Complex contains 4 total units
Exterior
- Parking: Assigned garage parking; Total of 4 parking spaces; 4 open parking spaces
- Security: Gated community; Smoke detectors; Carbon monoxide detectors
- Utilities: Public water (LADWP); Sewer connection in street; Tenants pay electric, water, and trash
- Home design: Residential income property; One-level buildings; Detached buildings (no common walls); Faces west
- Construction: Frame and stucco construction; Raised foundation
- Exterior features: Front porch; Gated property with guard
Interior
- Kitchen: Gas/Electric range; Range/oven; Dishwasher; Garbage disposal; Refrigerator
- Bedrooms: Units include 1-bedroom layouts
- Bathrooms: Each unit has a full bathroom
- Heating & cooling: Wall heating; No central cooling
- Interior features: Entry through the living room; Cable TV available; Low-flow toilets
- Laundry & utility: Gas water heater
Neighborhood map
What this means for you Summary
Snapshot
- This is a 4 × 1-bed/1-bath units multifamily listed at $700k.
Deal economics
- At list price, monthly cash flow is $1k ($17k/yr) — positive. Per door: $362/mo.
- The deal already cash-flows at list — no discount required.
- Meets the 1% rule at list price ($8k rent vs $700k).
- Cap rate 8.8% vs local median 2.1% in Los Angeles — top-decile yield for the area; either an underpriced asset or a hidden risk that comps aren't pricing in. Stress-test before assuming the spread holds.
Location & tenants
- Location reads 68/100 on livability (#273 in CA) — a middle-class / working-renter tenant base. Strengths: amenities A+, commute A+, employment B; Watch: health & safety C-, crime F, cost of living F.
- Los Angeles Unified (urban): math 29% / reading 54% proficiency, ranked #223 of 517 in CA (top 43%) — families likely to look elsewhere, expect single-tenant / working-renter base with shorter leases; 67% free/reduced lunch — lower-income household profile, screen leases tightly.
- Zoned schools: Marguerite Poindexter Lamotte Elementary (460 students, 98% FRL); Barack Obama Global Preparation Academy (397 students, 99% FRL); Manual Arts Senior High (math 12% / reading 22%, grade F, #1,032 of 1,170 statewide, top 88%, 1,026 students, 97% FRL) — zoned schools average 98% FRL vs 67% district-wide (30 pts higher); higher-poverty schools than district average — tighter screening recommended.
- Zoned-school proficiency averages 17% at this address vs 42% district-wide (-24 pts) — the specific schools serving this property underperform the Los Angeles Unified average; the district grade overstates school quality for this exact location.
- Market conditions: Rents rising (+1.7%/yr); 104 active listings in the ZIP; 40 comparable units currently listed for rent nearby; rentals lingering (median 46d on market — plan ~5-8 weeks vacancy on turnover, expect pricing pressure); 52% of comp listings sitting > 30 days — soft ceiling on asking rent; 19,697 units permitted in Los Angeles County in 2024 (9,426 in 5+ unit buildings).
- At $7,563/mo this rent would consume 158% of the median local household income ($58k/yr) (locally 4200% of renters already pay >50% of income on rent) — very limited rent-growth headroom before tenants either downsize or default.
Forward outlook
- Local home prices are declining (-3.0%/yr); year-one equity from $5k of loan paydown is wiped out by about $21k of value loss. Plan a longer hold.
- Los Angeles County population projected at +9% by 2050 — modest demand growth; plan on rents tracking national, not racing it.
Negotiation context
- Only 13 days on market — expect competitive offers; lowballing is unlikely to land.
- 12 sale attempts since 29y ago with the ask held roughly flat each time — persistent listings suggest the price (not the market) is what's stuck; bring a comps-based counter.
Risks & watch-outs
- Watch-outs: built in 1913 — expect roof / HVAC / electrical / plumbing capex.
- Climate carrying-cost: extreme-heat days projected 7→22/yr by 2055 (HVAC capex compounding) — expect insurance premiums to compound above CPI over the hold.
Questions for the listing agent
- Can we see the unit-by-unit rent roll, current vacancy, and any below-market leases? What's the average tenancy length?
- What capital expenditures (roof, boiler, parking lot, exteriors) have been made in the last 5 years, and what's planned in the next 2?
- Built in 1913 — when were the roof, HVAC, electrical panel, plumbing, and water heater last replaced?
- Is there a deadline driving the sale (1031 exchange, divorce, estate, relocation)? That informs how much negotiation room exists.
- Schools are D-rated, which usually means shorter tenancies and higher turnover. Who's the typical renter profile here, and what's been the actual vacancy rate?
- Crime grade is F in this area — have there been break-ins, vandalism, or insurance claims at this property in the last 3 years? What carrier currently insures it and at what premium?
- What's the average days-on-market for RENTAL listings here right now (not sales)? A rising rental-DOM trend means longer vacancies and softer asking-rent achievability than the comps imply.
- What's the recent tenant-quality profile in this submarket — average credit score on applications, eviction rate, late-payment / NSF rate, and stable-employment percentage? A property-management company in the area should have these aggregated.
- How much new apartment / multifamily construction is in the pipeline within 1–3 miles? Heavy new supply (>2% of stock underway) typically softens rents 12–24 months out; light construction supports rent growth.
Investment metrics
- 1% rule
- 1.08% ✓
- Cap rate
- 8.77%
- Cash-on-cash
- 8.86%
- DSCR
- 1.39
- GRM
- 7.7
CMA / ARV
- ARV (median comp)
- $833,550
- List price
- $700,000
- Delta
- -16.02%
- Verdict
- UNDERPRICED
- Comps
- 20 within 1.0 mi
Show comp detail 7 sales within ~0.75 mi
| Address | Dist | Beds/Ba | Sqft | Sold | Price | $/sf | Match |
|---|---|---|---|---|---|---|---|
| 810 W 43rd St | 0.00mi | 4/4.0 | 2,040 (0%) | 1mo | $700,000 | $343 | 99 |
| 712 714 W 40th Pl | 0.35mi | 5/4.0 (+1) | 2,044 (+0%) | 1mo | $700,000 | $342 | 77 |
| 1021 W 48th | 0.46mi | 5/4.0 (+1) | 2,096 (+3%) | 0mo | $720,000 | $344 | 69 |
| 725-727 W 50th St | 0.55mi | 5/3.0 (+1) | 1,916 (-6%) | 6mo | $625,000 | $326 | 51 |
| 1361 W Vernon Ave | 0.68mi | 4/3.0 | 1,892 (-7%) | 2mo | $690,000 | $365 | 51 |
| 1323 W 41st | 0.69mi | 4/3.0 | 1,807 (-11%) | 2mo | $699,998 | $387 | 43 |
| 4164 S Normandie Ave | 0.71mi | 4/3.0 | 2,340 (+15%) | 11mo | $468,000 | $200 | 29 |
Match score weights: distance 35% · size 25% · config 20% · recency 20%. Top-matched comps best support the ARV.
Projected returns pro-forma
-3.0% appreciation · 1.69% rent growth · sell at horizon
- IRR
- -4.3%
- Equity multiple
- 0.84×
- Total profit
- $-31,201
- Equity at exit
- $104,372
- IRR
- 3.9%
- Equity multiple
- 1.26×
- Total profit
- $51,845
- Equity at exit
- $60,523
Cash invested: $196,000 (down + closing). Projections, not guarantees.
Landlord ↔ Tenant lean methodology
- Overall (CITY)
- 0 Strongly Tenant-Friendly
- State California
- 18 Strongly Tenant-Friendly · D+13
- County
- — inherits STATE
- City Los Angeles
- 0 Strongly Tenant-Friendly · D+22
ZIP-level market 90037
- Rents YoY
- 1.7%
- Active inventory
- 104
- Price-to-rent
- 30.9×
Monthly cashflow live
- Estimated rent
- $7,563 high interval (Pro) →
- Mortgage (P&I)
- −$3,671
- Tax from tax record
- −$565 /mo · $6,785/yr
- Insurance
- −$292
- HOA
- −$0
- Vacancy / Maint / Mgmt
- −$1,588
- Net cashflow
- $1,447
Break-even live
Sensitivity live
| Price | -10% $1,843 | -5% $1,645 | +0% $1,447 | +5% $1,249 | +10% $1,051 |
|---|---|---|---|---|---|
| Rent | -10% $849 | -5% $1,148 | +0% $1,447 | +5% $1,746 | +10% $2,044 |
| Rate | -1.0pp $1,799 | -0.5pp $1,625 | base $1,447 | +0.5pp $1,265 | +1.0pp $1,081 |
4-unit breakdown (identical units grouped — click to expand)
| Units | Beds | Baths | Est. rent |
|---|---|---|---|
| 4× units | 1 | 1 | $7,564 |
| #1 | 1 | 1 | $1,891 |
| #2 | 1 | 1 | $1,891 |
| #3 | 1 | 1 | $1,891 |
| #4 | 1 | 1 | $1,891 |
| Total (4 units) | $7,563 | ||
UW: 25.0% down · 7.5% · 30yr · 1.5% tax · 5.0% vac · 8.0% maint · 8.0% mgmt
Financing live
Cash to close
- Down payment
- $175,000
- Closing costs
- $21,000
- Reserves months
- —
- Total cash needed
- —
Loan-product check · same deal, 3 products live
Conventional
25% down · 7.5% · 30yr
- Down + closing
- —
- Monthly P&I
- —
- Monthly cashflow
- —
- DSCR
- —
- Eligible?
- —
Personal DTI + credit; lowest rate.
DSCR
20% down · 8.5% · 30yr
- Down + closing
- —
- Monthly P&I
- —
- Monthly cashflow
- —
- DSCR
- —
- Eligible?
- —
No personal income docs; deal must DSCR.
Hard money
10% down · 12.0% · 12mo
- Down + closing
- —
- Monthly P&I
- —
- Monthly cashflow
- —
- DSCR
- —
- Eligible?
- —
Short-term bridge; refi at stabilization.
Rent comps 40 comps
| Address | Beds | Baths | Sqft | Rent | $/sqft | DOM | Units | Dist |
|---|---|---|---|---|---|---|---|---|
| 605 1/2 W 41st Pl Los Angeles, CA | 4.0 | 4.5 | 1950 | $3,900 | $2.00 | 25d | 1 | 0.29mi |
| 902 W 41st St Los Angeles, CA | 4.0 | 3.0 | 1600 | $3,480 | $2.17 | 26d | 1 | 0.30mi |
| 4062 S Budlong Ave Unit MAIN Los Angeles, CA | 3.0 | 1.0 | 2000 | $2,950 | $1.48 | 45d | 1 | 0.54mi |
| 238 W 46th St Los Angeles, CA | 5.0 | 3.0 | 1848 | $3,890 | $2.10 | 26d | 1 | 0.64mi |
| 213 W 43rd St Los Angeles, CA | 5.0 | 4.0 | 2302 | $4,200 | $1.82 | 5d | 1 | 0.66mi |
| 620 W 52nd St Los Angeles, CA | 4.0 | 2.0 | 1777 | $3,450 | $1.94 | 26d | 1 | 0.67mi |
| 5001 S Budlong Ave Los Angeles, CA | 5.0 | 2.5 | 2010 | $5,200 | $2.59 | 9d | 1 | 0.69mi |
| 1348 1/2 W 41st Pl Los Angeles, CA | 5.0 | 5.0 | 1550 | $4,210 | $2.72 | 45d | 1 | 0.70mi |
| 1348 W 41st Pl Unit 1348 Los Angeles, CA | 5.0 | 3.0 | 1500 | $3,935 | $2.62 | 45d | 1 | 0.71mi |
| 3946 S Budlong Ave Unit 1/2 Los Angeles, CA | 3.0 | 3.0 | 1793 | $3,600 | $2.01 | 45d | 1 | 0.74mi |
| 3944 S Budlong Ave Unit 223-3946 1/2 Los Angeles, CA | 3.0 | 3.0 | 1793 | $3,600 | $2.01 | 45d | 1 | 0.74mi |
| 1424 W 45th St Los Angeles, CA | 3.0 | 1.5 | 1450 | $3,750 | $2.59 | 45d | 1 | 0.77mi |
| 1265 Browning Blvd Unit 1/2 Los Angeles, CA | 4.0 | 4.0 | 1816 | $3,666 | $2.02 | 26d | 1 | 0.82mi |
| 1128 W 39th St Unit 1128 Los Angeles, CA | 3.0 | 3.5 | 1614 | $5,100 | $3.16 | 26d | 1 | 0.82mi |
| 1130 1/2 W 39th St Unit 1130 1/2 Los Angeles, CA | 3.0 | 3.5 | 1614 | $5,100 | $3.16 | 45d | 1 | 0.83mi |
| 1258 Leighton Ave Los Angeles, CA | 3.0 | 3.0 | 1480 | $3,900 | $2.64 | 45d | 1 | 0.84mi |
| 1260 Leighton Ave Los Angeles, CA | 3.0 | 3.0 | 1480 | $4,000 | $2.70 | 45d | 1 | 0.85mi |
| 1512 W 45th St Los Angeles, CA | 3.0 | 2.5 | 1549 | $3,500 | $2.26 | 26d | 1 | 0.93mi |
| 116 W 50th St Los Angeles, CA | 5.0 | 3.0 | 1858 | $4,000 | $2.15 | 45d | 1 | 0.93mi |
| 4240 Denker Ave Los Angeles, CA | 4.0 | 3.0 | 2684 | $2,500 | $0.93 | 1d | 1 | 0.94mi |
| 114 W 50th St Los Angeles, CA | 5.0 | 3.0 | 1858 | $4,000 | $2.15 | 45d | 1 | 0.94mi |
| 1150 W 38th St Los Angeles, CA | 3.0–19.0 | 3.0–18.5 | 4527 | $4,969 | $1.10 | 3d | 9 | 0.95mi |
| 1163 W 38th St Los Angeles, CA | 3.0 | 3.0 | 2300 | $3,420 | $1.49 | 26d | 1 | 0.98mi |
| 206 W 52nd Pl Los Angeles, CA | 4.0 | 1.5 | 1500 | $3,450 | $2.30 | 45d | 1 | 0.99mi |
| 204 W 52nd Pl Los Angeles, CA | 4.0 | 2.0 | 1450 | $2,950 | $2.03 | 45d | 1 | 0.99mi |
| 3987 Dalton Ave Unit 1-4 Los Angeles, CA | 4.0 | 4.5 | 1650 | $4,650 | $2.82 | 45d | 1 | 1.01mi |
| 1212 W 37th Dr Unit 2 Los Angeles, CA | 5.0 | 5.0 | 1400 | $5,950 | $4.25 | 5d | 1 | 1.03mi |
| 3908 Halldale Ave Los Angeles, CA | 5.0 | 3.0 | 1730 | $4,700 | $2.72 | 15d | 1 | 1.06mi |
| 1337 W 55th St Los Angeles, CA | 5.0 | 3.0 | 1752 | $4,200 | $2.40 | 45d | 1 | 1.07mi |
| 1299 W 37th Dr Unit 1 Los Angeles, CA | 5.0 | 3.0 | 1800 | $5,600 | $3.11 | 45d | 1 | 1.13mi |
| 1156 W 36th Pl Los Angeles, CA | 5.0 | 1.0–3.0 | 960 | $3,739 | $3.89 | 45d | 1 | 1.20mi |
| 441 E 41st St Los Angeles, CA | 5.0 | 3.0 | 1679 | $3,700 | $2.20 | 45d | 1 | 1.20mi |
| 1400 57th St Los Angeles, CA | 5.0 | 5.0 | 1800 | $4,200 | $2.33 | 45d | 1 | 1.22mi |
| 5913 Denver Ave Los Angeles, CA | 5.0 | 3.0 | 1777 | $3,900 | $2.19 | 26d | 1 | 1.27mi |
| 5919 Denver Ave Unit 5919 Los Angeles, CA | 5.0 | 3.0 | 1737 | $4,300 | $2.48 | 26d | 1 | 1.28mi |
| 3780 S La Salle Ave Unit 1 Los Angeles, CA | 5.0 | 3.0 | 1870 | $4,999 | $2.67 | 0d | 1 | 1.35mi |
| 1200 W 35th St Los Angeles, CA | 1.0–4.0 | 1.0–3.0 | 925 | $1,700 | $1.84 | 45d | 1 | 1.35mi |
| 1224 W 35th St Los Angeles, CA | 4.0 | 4.0 | 1600 | $1,240 | $0.78 | 9d | 1 | 1.37mi |
| 3431 S Catalina St Los Angeles, CA | 2.0–4.0 | 1.0–3.0 | 1058 | $5,600 | $5.29 | 45d | 1 | 1.39mi |
| 629 W 61st St Los Angeles, CA | 5.0 | 3.0 | 1671 | $3,900 | $2.33 | 9d | 1 | 1.44mi |
Listing history 33 events
-
2026-05-13status Pending 1255-char remark
-
2026-04-30$700,000 Active 1255-char remark
-
2022-09-20Active
-
2016-02-29historical
-
2015-12-10historical
-
2015-11-07
-
2015-11-07$520,000
-
2015-06-13status Pending
-
2015-06-12soldstatus $436,450
-
2015-06-12soldstatus $436,450 Closed
-
2015-06-12soldstatus $436,450
-
2015-06-12soldstatus $436,450
-
2015-06-12soldstatus $436,500
-
2015-04-15status Backup Offers Accepted
-
2015-04-15historical
-
2015-04-07price $465,000
-
2015-03-19$475,000 Active
-
2015-03-18$465,000
-
2015-03-18$465,000
-
2015-03-18$465,000
-
2014-04-22soldstatus $390,000 Closed
-
2014-04-22soldstatus $390,000
-
2014-03-21status Pending
-
2014-03-03$378,000 Active
-
2008-10-27historical
-
2008-05-13
-
2003-02-19soldstatus $282,880
-
2001-11-01$234,000
-
1999-06-23soldstatus $225,000
-
1998-01-05soldstatus $120,000
-
1998-01-05soldstatus $120,000
-
1997-12-10historical
-
1997-11-06$124,900
ⓘ Source: listings_history table (triggers on properties + properties_extension) + one-shot
backfill from property_details.listing_events for pre-trigger history.
Tax reassessment forecast CA · Resets to sale price
- Current annual tax
- $6,785 · $565/mo
- Projected year-2 tax
- $6,785 · $565/mo
- Expected delta
- $0/yr ($0/mo · 0.0%)
ⓘ Screening estimate from a state-policy table — verify with the county assessor before closing.
Climate risk First Street
- Flood 1/10 Low FEMA zone X (unshaded) · 0% chance over 30 yrs
- Wildfire 1/10 Low
- Heat 6/10 Major 7 d/yr ≥88°F today · 22 d/yr by 30 yrs out
- Wind 1/10 Low
- Air quality 5/10 Major 7 unhealthy d/yr today · 7 by 30 yrs out
Nearby sold comps map
Loading sold comps map…
Walkable amenities ~0.75 mi
Loading nearby amenities…
Taxation est. · year 1
- Rental income
- $90,756
- − Mortgage interest
- −$39,211
- − Property taxes
- −$6,785
- − Insurance
- −$3,500
- − Repairs & maintenance
- −$7,260
- − Management
- −$7,260
- − Depreciation
- −$20,364
- Taxable income
- $6,375
- Est. tax owed @ 24.0%
- −$1,530
- After-tax cash flow
- $15,831/yr
For passive investors: Depreciation is non-cash, so a rental often shows a tax loss while cash-flowing — sheltering income. Rental losses are passive: they offset passive income freely, and up to $25,000/yr can offset ordinary (W-2) income if you actively participate and your MAGI is under $100k (phasing out to $0 by $150k); unused losses carry forward. On sale, claimed depreciation is recaptured at up to 25%, and gains may owe capital-gains tax (a 1031 exchange can defer both). Figures are a year-1 estimate at your 24.0% rate — not tax advice; consult a CPA.
Schools (NCES district)
- District
- Los Angeles Unified
- NCES district ID
- 0622710
- Math proficiency
- 29% ▼ -4.00%
- Reading proficiency
- 54% ▲ 10.00%
- Median HH income
- $50,403
- Composite
- 35.67/100
- National rank
- #4875
- State rank
- #223 of 517 in CA
Livability — Los Angeles
- Score
- 68/100
- State rank
- #273
- US rank
- #9237
Category grades
Schools grade is shown separately in the Schools card above.
Census & demographics
- Census place
- Los Angeles, CA
- County
- Los Angeles County · 9,444,647 people
- City population
- 3,838,149
- Metro
- Los Angeles-Long Beach-Anaheim, CA
- Population (ZIP)
- 65,482
- Household income
- $57,622
- Rent vs Own
- Severe rent burden
- 4200.0
Population outlook (Los Angeles County) Hauer SSP2
- Today (2025)
- 10,940,515 people
- By 2030
- 11,256,481 · +2.9%
- By 2040
- 11,729,929 · +7.2%
- By 2050
- 11,948,407 · +9.2%
- By 2075
- 11,818,114 · +8.0%
- By 2100
- 10,842,928 · -0.9%
Race, ethnicity, and origin ACS 2023
- Neighborhood character
- Predominantly Hispanic (80%)
- Race & ethnicity
- Hispanic / Latino 80% Two or more races 15% Black 15% Native American 3% White 2% Asian 1%
- Hispanic origin (detail)
- Mexican 43%
- Common ancestry
- British 1%
- Foreign-born
- 44% · Canada, South Korea
- Languages at home
- 23% English-only · Spanish 74% Korean 1% French/Haitian/Cajun 1%
Political lean MEDSL · Los Angeles
- 2024 margin
- Solid D (+32.9) · D 64.8% · R 31.9% · Other 3.3%
- 2008→2024 swing
- -7.4pp toward R · 2008: 40.4pp · 2024: 32.9pp
- All cycles
- 2024: D+32.9 2020: D+44.2 2016: D+48.0 2012: D+40.0 2008: D+40.4
Not yet ingested
- Civics
- —
Market trends
- HPI YoY
- ▼ -639.09%
- Current HPI
- 467.0371
- Rent YoY
- ▲ 1.69%
- Metro
- Los Angeles-Long Beach-Anaheim, CA
- State GDP YoY
- ▲ 3.21%
- F500 in state
- 116
Industry mix (Fortune 500 HQ in CA)
| Industry | F500 HQs | Revenue |
|---|---|---|
| Technology | 27 | $1,492B |
|
||
| Financial Services | 3 | $174B |
|
||
| Retail | 3 | $44B |
|
||
| Insurance | 3 | $26B |
|
||
| Media / Entertainment | 2 | $115B |
|
||
| Pharmaceuticals / Biotech | 2 | $62B |
|
||
Price history
+460.4% since first listed35 events — show timeline
- 2026-06-02 Sold (Public Records) $700,000 Public Records
- 2026-06-02 Sold (MLS) $700,000 TheMLS
- 2026-05-13 Pending — TheMLS
- 2026-04-30 Listed $700,000 TheMLS
- 2022-09-20 Listed — TheMLS
- 2016-02-29 Listing Removed — SDMLS
- 2015-12-10 Delisted — TheMLS
- 2015-11-07 Listed $520,000 SDMLS
- 2015-11-07 Listed — TheMLS
- 2015-06-13 Pending — CRMLS
- 2015-06-12 Sold (Public Records) $436,500 Public Records
- 2015-06-12 Sold (MLS) $436,450 SDMLS
- 2015-06-12 Sold (MLS) $436,450 SDMLS
- 2015-06-12 Sold (MLS) $436,450 CRMLS
- 2015-06-12 Sold (MLS) $436,450 CRMLS
- 2015-04-15 Pending — CRMLS
- 2015-04-15 Listing Removed — CRMLS
- 2015-04-07 Price Changed $465,000 CRMLS
- 2015-03-19 Listed $475,000 CRMLS
- 2015-03-18 Listed $465,000 SDMLS
- 2015-03-18 Listed $465,000 SDMLS
- 2015-03-18 Listed $465,000 CRMLS
- 2014-04-22 Sold (Public Records) $390,000 Public Records
- 2014-04-22 Sold (MLS) $390,000 TheMLS
- 2014-03-21 Pending — TheMLS
- 2014-03-03 Listed $378,000 TheMLS
- 2008-10-27 Delisted — TheMLS
- 2008-05-13 Listed — TheMLS
- 2003-02-19 Sold (MLS) $282,880 CRMLS
- 2001-11-01 Listed $234,000 CRMLS
- 1999-06-23 Sold (Public Records) $225,000 Public Records
- 1998-01-05 Sold (Public Records) $120,000 Public Records
- 1998-01-05 Sold (MLS) $120,000 TheMLS
- 1997-12-10 Delisted — TheMLS
- 1997-11-06 Listed $124,900 TheMLS
Property tax history
+3.0%/yrLatest (2025): $6,785 · +1.4% YoY. Source: county tax records.
Cash-flow waterfall
monthlySold comps — $/sqft
last 12 mo · ≤1 miLoading sold comps…