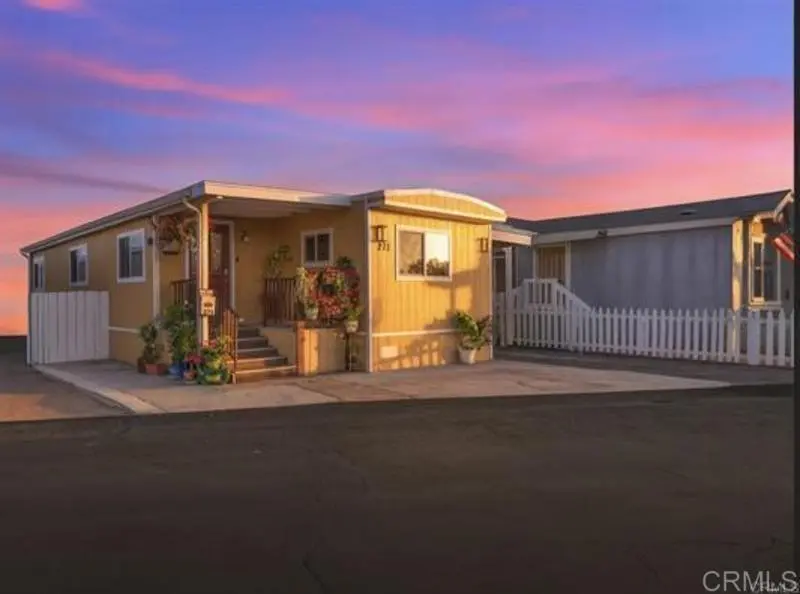
6460 Convoy #271 Ct · San Diego, CA
Flood risk 1/10 · Minimal
- FEMA flood zone
- X (unshaded)
- Chance of flooding over 30 yrs
- 0.0%
- Est. flood insurance / yr
- $507 – $1,088
Fire risk 3/10 · Minor
- Est. fire insurance / yr
- $659 – $1,223
Heat risk 3/10 · Minor
- Hot days now (above 89°F)
- 6 days/yr
- Hot days in 30 yrs
- 18 days/yr
Wind risk 1/10 · Minimal
- Chance of severe wind over 30 yrs
- —
Air-quality risk 3/10 · Minor
- Unhealthy air days now
- 4 days/yr
- Unhealthy air days in 30 yrs
- 4 days/yr
Risk factors via First Street. Map © Google.
Why this score? — see what drove the B- grade
The composite is a weighted blend of 9 inputs, each scored 0–100. Each bar is that input's sub-score; the figure is the points it added to the 100-point composite (weight × sub-score).
- Cash flow +30.0/30.0
- DSCR +10.0/10.0
- 1% rule +8.8/10.0
- ARV discount +7.5/15.0
- Livability +3.8/5.0
- Rent growth +2.9/5.0
- Condition / age +2.5/5.0
- Schools +2.2/10.0
- Appreciation +0.0/10.0
$234,999
🖨 Deal sheet 📄 Offer letter ✓ Due diligence
Listing remarks MLS
CUTE HOME IN POPULAR PARK NEAR HWY 805 & CLAIREMONT MESA BLVD. NEAR SHOPPING, MEDICAL, TRANSPORTATION; GET ANYWHERE IN A FEW MINUTES! GREAT PARK, GOOD MANAGEMENT, HAPPY RESIDENTS. SOME DEFERRED MAINTENANCE (MOSTLY COSMETIC) REFLECTED IN "AS IS" PRICE. EZ LAUNDRY HOOK-UP AREA IN UNIT; PARK LAUNDRY NEARBY.
Key facts
- Clubhouse
- Swimming pools
- Dual-pane windows
Tags
Property features AI
Finance
- Other: Lot described as 0-1 unit/acre; Lot and living area info from public records
- Financial info: Monthly land lease approximately $1,030
- HOA & community: Land lease community
Exterior
- Parking: Attached garage; Located in Kearney Lodge Mobile Home Park
- Utilities: Public sewer
- Home design: Mobile home remains on site; One story
- Construction: Mobile home dimensions approximately 12' x 56'
- Exterior features: No pool; Curbs
Interior
- Bedrooms: All bedrooms located on the ground floor
- Bathrooms: 1 full bathroom
- Heating & cooling: Wall/window cooling
- Interior features: Single-level home; Front entry; All bedrooms on main level; Has view
- Laundry & utility: Laundry inside the home
Neighborhood map
What this means for you Summary
Snapshot
- This is a 3-bed/1.0-bath land listed at $235k.
Deal economics
- At list price, monthly cash flow is $933 ($11k/yr) — positive.
- The deal already cash-flows at list — no discount required.
- Meets the 1% rule at list price ($3k rent vs $235k).
- Recommended offer: $228k (3.0% below list) — sets the bar for market timing.
- Cap rate 11.1% vs local median 2.0% in San Diego — top-decile yield for the area; either an underpriced asset or a hidden risk that comps aren't pricing in. Stress-test before assuming the spread holds.
Location & tenants
- Location reads 75/100 on livability (#123 in CA, #4,206 nationally) — a middle-class / working-renter tenant base. Strengths: amenities A+, commute A+, employment A+; Watch: health & safety C-, crime D+, cost of living F.
- San Diego Unified (urban): math 19% / reading 29% proficiency, ranked #393 of 517 in CA (top 76%) — low school quality limits family demand, transient renter base, plan for 1-2y turnover.
- Market conditions: Rents rising (+1.4%/yr); 126 active listings in the ZIP; 9 comparable units currently listed for rent nearby; rentals leasing fast (median 3d on market — plan ~1-2 weeks tenant-placement turnaround); solid renter incomes; 11,759 units permitted in San Diego County in 2024 (7,244 in 5+ unit buildings).
- This rent runs 37% of the median local income ($104k/yr) — at the standard rent-burdened threshold; future hikes will face affordability resistance.
Forward outlook
- Local home prices are declining (-3.0%/yr); year-one equity from $2k of loan paydown is wiped out by about $7k of value loss. Plan a longer hold.
- San Diego County population projected at +20% by 2050 — long-run rental-demand tailwind backs the buy-and-hold thesis.
- At projected returns (-3.0% appreciation + 1.4% rent growth), your $66k cash investment doubles in ~9 years — after that, you're playing with house money.
Negotiation context
- It's been on market 38 days — a 3% lower offer ($228k) is reasonable based on typical stale-listing flexibility.
- 46 sale attempts since 30y ago; this cycle's ask is 2250% above the opening price — seller raised mid-cycle; expect resistance to lowballs.
- Current owner paid $10k; list at $235k implies a 2250% gain — meaningful room to come down on a strong offer.
Questions for the listing agent
- It's been on market 38 days. Have you received any prior offers? Is the seller open to a 3% concession, seller financing, or rate buy-down credit?
- Built in 1970 — when were the roof, HVAC, electrical panel, plumbing, and water heater last replaced?
- Is there a deadline driving the sale (1031 exchange, divorce, estate, relocation)? That informs how much negotiation room exists.
- Schools are B-rated — typically a magnet for longer-tenancy family renters. What's the average tenant stay here, and is there a school-zone premium baked into asking?
- Crime grade is D in this area — have there been break-ins, vandalism, or insurance claims at this property in the last 3 years? What carrier currently insures it and at what premium?
- What's the average days-on-market for RENTAL listings here right now (not sales)? A rising rental-DOM trend means longer vacancies and softer asking-rent achievability than the comps imply.
- What's the recent tenant-quality profile in this submarket — average credit score on applications, eviction rate, late-payment / NSF rate, and stable-employment percentage? A property-management company in the area should have these aggregated.
- How much new for-sale + rental construction is in the pipeline within 1–3 miles? Heavy new supply typically softens prices + rents 12–24 months out; constrained supply supports both.
Investment metrics
- 1% rule
- 1.38% ✓
- Cap rate
- 11.06%
- Cash-on-cash
- 17.01%
- DSCR
- 1.76
- GRM
- 6.1
CMA / ARV
No comps found within radius.
Projected returns pro-forma
-3.0% appreciation · 1.42% rent growth · sell at horizon
- IRR
- 6.5%
- Equity multiple
- 1.25×
- Total profit
- $16,321
- Equity at exit
- $35,039
- IRR
- 14.4%
- Equity multiple
- 2.08×
- Total profit
- $70,783
- Equity at exit
- $20,318
Cash invested: $65,800 (down + closing). Projections, not guarantees.
Landlord ↔ Tenant lean methodology
- Overall (STATE)
- 18 Strongly Tenant-Friendly
- State California
- 18 Strongly Tenant-Friendly · D+13
- County
- — inherits STATE
- City
- — inherits STATE
ZIP-level market 92117
- Rents YoY
- 1.4%
- Active inventory
- 126
- Price-to-rent
- 6.1×
Monthly cashflow live
- Estimated rent
- $3,237 high interval (Pro) →
- Mortgage (P&I)
- −$1,232
- Tax est. 1.5%
- −$294 /mo · $3,525/yr
- Insurance
- −$98
- HOA
- −$0
- Vacancy / Maint / Mgmt
- −$680
- Net cashflow
- $933
Break-even live
UW: 25.0% down · 7.5% · 30yr · 1.5% tax · 5.0% vac · 8.0% maint · 8.0% mgmt
Financing live
Cash to close
- Down payment
- $58,750
- Closing costs
- $7,050
- Reserves months
- —
- Total cash needed
- —
Loan-product check · same deal, 3 products live
Conventional
25% down · 7.5% · 30yr
- Down + closing
- —
- Monthly P&I
- —
- Monthly cashflow
- —
- DSCR
- —
- Eligible?
- —
Personal DTI + credit; lowest rate.
DSCR
20% down · 8.5% · 30yr
- Down + closing
- —
- Monthly P&I
- —
- Monthly cashflow
- —
- DSCR
- —
- Eligible?
- —
No personal income docs; deal must DSCR.
Hard money
10% down · 12.0% · 12mo
- Down + closing
- —
- Monthly P&I
- —
- Monthly cashflow
- —
- DSCR
- —
- Eligible?
- —
Short-term bridge; refi at stabilization.
Rent comps 9 comps
| Address | Beds | Baths | Sqft | Rent | $/sqft | DOM | Units | Dist |
|---|---|---|---|---|---|---|---|---|
| 4822 Doliva Dr Unit 4826 201 San Diego, CA | 2.0 | 1.0 | 623 | $2,768 | $4.44 | 24d | 1 | 0.48mi |
| 4975 Clairemont Mesa Blvd San Diego, CA | 1.0–2.0 | 1.0–1.5 | 626 | $2,295 | $3.67 | 17d | 2 | 0.82mi |
| 4880 Clairemont Mesa Blvd San Diego, CA | 3.0 | 1.0–2.0 | 657 | $3,795 | $5.77 | 1d | 14 | 0.86mi |
| 4888 Convoy St San Diego, CA | 2.0 | 1.0–2.0 | 860 | $4,468 | $5.19 | 1d | 306 | 1.01mi |
| 5550 Balboa Arms Dr San Diego, CA | 1.0–2.0 | 1.0–2.0 | 807 | $2,893 | $3.58 | 3d | 7 | 1.06mi |
| 5252 Balboa Arms Dr San Diego, CA | 1.0–2.0 | 1.0–2.0 | 692 | $3,600 | $5.20 | 10d | 3 | 1.09mi |
| 5252 Balboa Arms Dr San Diego, CA | 1.0–2.0 | 1.0–2.0 | 692 | $3,600 | $5.20 | 1d | 3 | 1.09mi |
| 5150 Balboa Arms Dr San Diego, CA | 2.0 | 1.0–2.0 | 665 | $2,495 | $3.75 | 3d | 3 | 1.12mi |
| 5251 Mount Etna Dr San Diego, CA | 1.0–3.0 | 1.0–2.0 | 735 | $2,439 | $3.32 | 24d | 1 | 1.39mi |
Listing history 50 events
-
2026-06-18days on market $234,999 Active 38 DOM
-
2026-06-17days on market $234,999 Active 37 DOM
-
2026-06-16days on market $234,999 Active 36 DOM
-
2026-06-15days on market $234,999 Active 35 DOM
-
2026-06-13days on market $234,999 Active 33 DOM
-
2026-06-09days on market $234,999 Active 29 DOM
-
2026-06-08days on market $234,999 Active 28 DOM
-
2026-06-07days on market $234,999 Active 27 DOM
-
2026-06-04days on market $234,999 Active 24 DOM
-
2026-06-03days on market $234,999 Active 23 DOM
-
2026-06-02days on market $234,999 Active 22 DOM
-
2026-06-01days on market $234,999 Active 21 DOM
-
2026-05-31days on market $234,999 Active 20 DOM
-
2000-05-31soldstatus $10,000 321-char remark
Show marketing remark (321 chars)
CUTE HOME IN POPULAR PARK NEAR HWY 805 & CLAIREMONT MESA BLVD. NEAR SHOPPING, MEDICAL, TRANSPORTATION; GET ANYWHERE IN A FEW MINUTES! GREAT PARK, GOOD MANAGEMENT, HAPPY RESIDENTS. SOME DEFERRED MAINTENANCE (MOSTLY COSMETIC) REFLECTED IN "AS IS" PRICE. EZ LAUNDRY HOOK-UP AREA IN UNIT; PARK LAUNDRY NEARBY.
-
2000-01-22$10,000 321-char remark
Show marketing remark (321 chars)
CUTE HOME IN POPULAR PARK NEAR HWY 805 & CLAIREMONT MESA BLVD. NEAR SHOPPING, MEDICAL, TRANSPORTATION; GET ANYWHERE IN A FEW MINUTES! GREAT PARK, GOOD MANAGEMENT, HAPPY RESIDENTS. SOME DEFERRED MAINTENANCE (MOSTLY COSMETIC) REFLECTED IN "AS IS" PRICE. EZ LAUNDRY HOOK-UP AREA IN UNIT; PARK LAUNDRY NEARBY.
-
1999-12-14soldstatus $18,500 276-char remark
Show marketing remark (276 chars)
CUTE, COZY HOME IN POPULAR FAMILY PARK WITH HAPPY RESIDENTS & GOOD MANAGEMENT. LOTS OF UPGRADES INCLUDE CERAMIC TILE FLOORING, NEW REFRIGERATOR & OVEN, CEILING FANS, PAINT, ETC. VACANT & READY FOR YOU. .. .. QUICK ESCROW POSSIBLE. .. .YOU MUST SEE THIS ONE!!
-
1999-12-01soldstatus $22,500
-
1999-11-18$18,500 276-char remark
Show marketing remark (276 chars)
CUTE, COZY HOME IN POPULAR FAMILY PARK WITH HAPPY RESIDENTS & GOOD MANAGEMENT. LOTS OF UPGRADES INCLUDE CERAMIC TILE FLOORING, NEW REFRIGERATOR & OVEN, CEILING FANS, PAINT, ETC. VACANT & READY FOR YOU. .. .. QUICK ESCROW POSSIBLE. .. .YOU MUST SEE THIS ONE!!
-
1999-10-22$22,500
-
1999-08-13soldstatus $32,500
-
1999-08-13soldstatus $15,000
-
1999-07-17soldstatus $22,000
-
1999-07-14$32,500
-
1999-06-28soldstatus $19,500
-
1999-05-20soldstatus $22,000
-
1999-04-20soldstatus $34,500
-
1999-04-10$24,900
-
1999-03-02$15,900
-
1999-01-12$34,500
-
1998-11-14$23,000
-
1998-11-05soldstatus $29,900
-
1998-10-30$19,500
-
1998-10-09soldstatus $24,000
-
1998-09-30soldstatus $43,000
-
1998-09-08$25,000
-
1998-08-17soldstatus $14,000
-
1998-08-17soldstatus $14,000
-
1998-08-14$43,000
-
1998-08-14soldstatus $28,000
-
1998-08-07historical
-
1998-08-07historical
-
1998-07-17$29,900
-
1998-07-05soldstatus $13,000
-
1998-06-18soldstatus $10,000
-
1998-06-06$28,000
-
1998-06-05soldstatus $22,000
-
1998-06-05soldstatus $22,000
-
1998-05-28$10,500
-
1998-05-22soldstatus $24,000
-
1998-05-19soldstatus $13,500
ⓘ Source: listings_history table (triggers on properties + properties_extension) + one-shot
backfill from property_details.listing_events for pre-trigger history.
Climate risk First Street
- Flood 1/10 Low FEMA zone X (unshaded) · 0% chance over 30 yrs
- Wildfire 3/10 Moderate
- Heat 3/10 Moderate 6 d/yr ≥89°F today · 18 d/yr by 30 yrs out
- Wind 1/10 Low
- Air quality 3/10 Moderate 4 unhealthy d/yr today · 4 by 30 yrs out
Nearby sold comps map
Loading sold comps map…
Walkable amenities ~0.75 mi
Loading nearby amenities…
Taxation est. · year 1
- Rental income
- $38,840
- − Mortgage interest
- −$13,164
- − Property taxes
- −$3,525
- − Insurance
- −$1,175
- − Repairs & maintenance
- −$3,107
- − Management
- −$3,107
- − Depreciation
- −$6,836
- Taxable income
- $7,925
- Est. tax owed @ 24.0%
- −$1,902
- After-tax cash flow
- $9,293/yr
For passive investors: Depreciation is non-cash, so a rental often shows a tax loss while cash-flowing — sheltering income. Rental losses are passive: they offset passive income freely, and up to $25,000/yr can offset ordinary (W-2) income if you actively participate and your MAGI is under $100k (phasing out to $0 by $150k); unused losses carry forward. On sale, claimed depreciation is recaptured at up to 25%, and gains may owe capital-gains tax (a 1031 exchange can defer both). Figures are a year-1 estimate at your 24.0% rate — not tax advice; consult a CPA.
Schools (NCES district)
- District
- San Diego Unified
- NCES district ID
- 0634320
- Math proficiency
- 19% ▼ -29.00%
- Reading proficiency
- 29% ▼ -28.00%
- Median HH income
- $61,673
- Composite
- 22.31/100
- National rank
- #8135
- State rank
- #393 of 517 in CA
Livability — San Diego
- Score
- 75/100
- State rank
- #123
- US rank
- #4206
Category grades
Schools grade is shown separately in the Schools card above.
Census & demographics
- Census place
- San Diego, CA
- County
- San Diego County · 3,178,799 people
- City population
- 1,397,612
- Metro
- San Diego-Chula Vista-Carlsbad, CA
- Population (ZIP)
- 52,275
- Household income
- $103,661
- Rent vs Own
- Severe rent burden
- 2209.0
Population outlook (San Diego County) Hauer SSP2
- Today (2025)
- 3,678,185 people
- By 2030
- 3,856,546 · +4.8%
- By 2040
- 4,171,407 · +13.4%
- By 2050
- 4,421,607 · +20.2%
- By 2075
- 4,831,599 · +31.4%
- By 2100
- 4,832,502 · +31.4%
Race, ethnicity, and origin ACS 2023
- Neighborhood character
- Diverse neighborhood (Simpson 0.60)
- Race & ethnicity
- White 57% Hispanic / Latino 25% Two or more races 17% Asian 9% Black 2%
- Hispanic origin (detail)
- Mexican 20%
- Common ancestry
- Lithuanian 2% Italian 2% Slovak 2%
- Foreign-born
- 19% · Canada, Vietnam, Jamaica
- Languages at home
- 73% English-only · Spanish 17% Other Indo-European 3% Vietnamese 2%
Political lean MEDSL · San Diego
- 2024 margin
- D (+16.8) · D 56.9% · R 40.1% · Other 2.9%
- 2008→2024 swing
- +6.6pp toward D · 2008: 10.2pp · 2024: 16.8pp
- All cycles
- 2024: D+16.8 2020: D+22.8 2016: D+17.8 2012: D+5.1 2008: D+10.2
Not yet ingested
- Civics
- —
Market trends
- HPI YoY
- ▼ -1228.75%
- Current HPI
- 398.6104
- Rent YoY
- ▲ 1.42%
- Metro
- San Diego-Chula Vista-Carlsbad, CA
- State GDP YoY
- ▲ 3.21%
- F500 in state
- 116
Industry mix (Fortune 500 HQ in CA)
| Industry | F500 HQs | Revenue |
|---|---|---|
| Technology | 27 | $1,492B |
|
||
| Financial Services | 3 | $174B |
|
||
| Retail | 3 | $44B |
|
||
| Insurance | 3 | $26B |
|
||
| Media / Entertainment | 2 | $115B |
|
||
| Pharmaceuticals / Biotech | 2 | $62B |
|
||
Price history
-72.6% since first listed103 events — show timeline
- 2000-05-31 Sold (MLS) $10,000 CRMLS
- 2000-01-22 Listed $10,000 CRMLS
- 1999-12-14 Sold (MLS) $18,500 CRMLS
- 1999-12-01 Sold (MLS) $22,500 CRMLS
- 1999-11-18 Listed $18,500 CRMLS
- 1999-10-22 Listed $22,500 CRMLS
- 1999-08-13 Sold (MLS) $32,500 CRMLS
- 1999-08-13 Sold (MLS) $15,000 CRMLS
- 1999-07-17 Sold (MLS) $22,000 CRMLS
- 1999-07-14 Listed $32,500 CRMLS
- 1999-06-28 Sold (MLS) $19,500 CRMLS
- 1999-05-20 Sold (MLS) $22,000 CRMLS
- 1999-04-20 Sold (MLS) $34,500 CRMLS
- 1999-04-10 Listed $24,900 CRMLS
- 1999-03-02 Listed $15,900 CRMLS
- 1999-01-12 Listed $34,500 CRMLS
- 1998-11-14 Listed $23,000 CRMLS
- 1998-11-05 Sold (MLS) $29,900 CRMLS
- 1998-10-30 Listed $19,500 CRMLS
- 1998-10-09 Sold (MLS) $24,000 CRMLS
- 1998-09-30 Sold (MLS) $43,000 CRMLS
- 1998-09-08 Listed $25,000 CRMLS
- 1998-08-17 Sold (Public Records) $14,000 Public Records
- 1998-08-17 Sold (Public Records) $14,000 Public Records
- 1998-08-14 Listed $43,000 CRMLS
- 1998-08-14 Sold (MLS) $28,000 CRMLS
- 1998-08-07 Listing Removed — CRMLS
- 1998-08-07 Listing Removed — SDMLS
- 1998-07-17 Listed $29,900 CRMLS
- 1998-07-05 Sold (MLS) $13,000 CRMLS
- 1998-06-18 Sold (MLS) $10,000 CRMLS
- 1998-06-06 Listed $28,000 CRMLS
- 1998-06-05 Sold (Public Records) $22,000 Public Records
- 1998-06-05 Sold (Public Records) $22,000 Public Records
- 1998-05-28 Listed $10,500 CRMLS
- 1998-05-22 Sold (MLS) $24,000 CRMLS
- 1998-05-19 Sold (MLS) $13,500 CRMLS
- 1998-04-16 Sold (MLS) $25,000 CRMLS
- 1998-03-27 Sold (MLS) $19,500 CRMLS
- 1998-02-26 Sold (MLS) $35,500 CRMLS
- 1998-02-26 Sold (MLS) $25,000 CRMLS
- 1998-02-10 Sold (MLS) $8,500 CRMLS
- 1998-02-09 Listed $29,500 CRMLS
- 1998-02-08 Listed $19,500 CRMLS
- 1998-02-04 Listing Removed — SDMLS
- 1998-01-29 Listed $16,000 CRMLS
- 1998-01-12 Listed $13,500 CRMLS
- 1998-01-05 Listed $37,000 CRMLS
- 1998-01-02 Listed $26,500 CRMLS
- 1997-12-31 Sold (Public Records) $14,000 Public Records
- 1997-12-31 Sold (Public Records) $14,000 Public Records
- 1997-12-30 Sold (Public Records) $22,000 Public Records
- 1997-12-30 Sold (MLS) $21,000 CRMLS
- 1997-12-29 Sold (MLS) $20,000 CRMLS
- 1997-12-22 Listing Removed — CRMLS
- 1997-12-22 Listing Removed — SDMLS
- 1997-12-18 Sold (MLS) $28,500 CRMLS
- 1997-12-11 Sold (MLS) $35,000 CRMLS
- 1997-12-03 Sold (MLS) $44,000 CRMLS
- 1997-12-02 Sold (MLS) $19,000 CRMLS
- 1997-11-25 Listing Removed — SDMLS
- 1997-11-25 Listing Removed — CRMLS
- 1997-11-19 Listed $28,500 CRMLS
- 1997-11-04 Sold (MLS) $25,000 CRMLS
- 1997-11-01 Listed $17,000 SDMLS
- 1997-11-01 Listed $8,500 CRMLS
- 1997-10-20 Listed $25,000 CRMLS
- 1997-10-14 Listing Removed — SDMLS
- 1997-10-11 Listed $19,900 CRMLS
- 1997-10-09 Listing Removed — CRMLS
- 1997-10-09 Listing Removed — SDMLS
- 1997-10-04 Listed $45,000 CRMLS
- 1997-09-22 Listed $37,000 CRMLS
- 1997-09-22 Listed $37,000 SDMLS
- 1997-09-04 Sold (MLS) $19,000 CRMLS
- 1997-08-26 Listed $24,500 CRMLS
- 1997-08-14 Listed $21,500 CRMLS
- 1997-06-26 Listed $27,000 CRMLS
- 1997-06-26 Sold (MLS) $20,000 CRMLS
- 1997-06-24 Sold (MLS) $29,000 CRMLS
- 1997-06-17 Sold (MLS) $11,000 CRMLS
- 1997-06-08 Listing Removed — SDMLS
- 1997-05-24 Listed $23,900 CRMLS
- 1997-05-24 Listed $23,900 SDMLS
- 1997-05-22 Listed $18,200 SDMLS
- 1997-05-22 Listed $18,200 CRMLS
- 1997-05-20 Listed $18,000 SDMLS
- 1997-05-07 Listing Removed — CRMLS
- 1997-05-07 Listing Removed — SDMLS
- 1997-05-06 Sold (MLS) $25,000 CRMLS
- 1997-04-29 Listing Removed — CRMLS
- 1997-04-29 Listing Removed — SDMLS
- 1997-04-24 Listed $29,500 CRMLS
- 1997-04-12 Listing Removed — SDMLS
- 1997-04-12 Listed $13,000 CRMLS
- 1997-04-12 Listed $9,500 CRMLS
- 1997-04-12 Listed $9,500 SDMLS
- 1997-03-25 Listed $38,500 CRMLS
- 1997-03-25 Listed $23,500 CRMLS
- 1997-03-25 Listed $38,500 SDMLS
- 1997-02-27 Listed $24,500 CRMLS
- 1997-01-08 Listed $9,900 SDMLS
- 1996-12-14 Listed $36,500 CRMLS
Property tax history
+21.9%/yrLatest (2025): $33,846 · -31.0% YoY. Source: county tax records.
Cash-flow waterfall
monthlySold comps — $/sqft
last 12 mo · ≤1 miLoading sold comps…