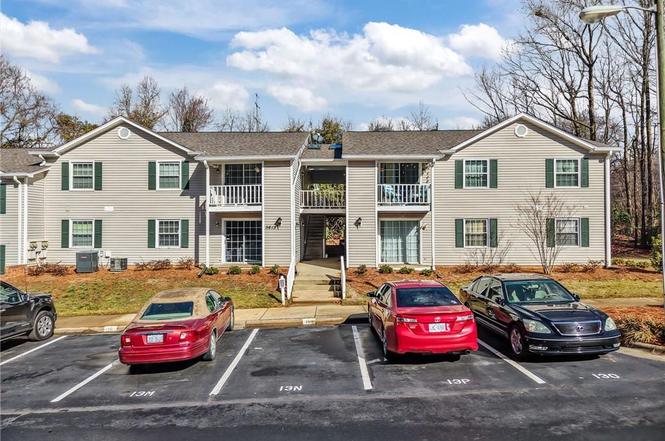
5613 Hornaday Rd Unit N · Greensboro, NC
Flood risk 4/10 · Minor
- FEMA flood zone
- X (unshaded)
- Chance of flooding over 30 yrs
- 0.22%
- Est. flood insurance / yr
- $507 – $1,088
Fire risk 1/10 · Minimal
- Est. fire insurance / yr
- $906 – $1,684
Heat risk 5/10 · Moderate
- Hot days now (above 103°F)
- 7 days/yr
- Hot days in 30 yrs
- 17 days/yr
Wind risk 4/10 · Minor
- Chance of severe wind over 30 yrs
- 13.0%
Air-quality risk 2/10 · Minimal
- Unhealthy air days now
- 1 days/yr
- Unhealthy air days in 30 yrs
- 1 days/yr
Risk factors via First Street. Map © Google.
Why this score? — see what drove the C grade
The composite is a weighted blend of 9 inputs, each scored 0–100. Each bar is that input's sub-score; the figure is the points it added to the 100-point composite (weight × sub-score).
- Cash flow +21.9/30.0
- 1% rule +7.6/10.0
- ARV discount +7.5/15.0
- DSCR +7.0/10.0
- Livability +4.0/5.0
- Schools +3.6/10.0
- Rent growth +2.8/5.0
- Condition / age +2.5/5.0
- Appreciation +0.0/10.0
$105,000
🖨 Deal sheet 📄 Offer letter ✓ Due diligence
Listing remarks
Upper-level 2-bedroom, 1-bath condo offering a fantastic opportunity to make it your own! Whether you're looking to start or grow your investment portfolio, this unit has proven rental history and solid potential. Privately positioned in the last building of the subdivision, it’s tucked away and backs to mature trees for added privacy and a peaceful setting. Enjoy the quiet location while still being convenient to everyday amenities. With a little vision and personal touch, this condo can truly shine—ideal for investors or buyers ready to create value and build equity.
Key facts
- Added privacy
- Quiet location
- $180 HOA
Tags
Neighborhood map
What this means for you Summary
Snapshot
- This is a 2-bed/1.0-bath condo listed at $105k.
Deal economics
- At list price, monthly cash flow is $165 ($2k/yr) — positive.
- The deal already cash-flows at list — no discount required.
- Meets the 1% rule at list price ($1k rent vs $105k).
- Recommended offer: $102k (3.0% below list) — sets the bar for market timing.
- Cap rate 8.2% vs local median 3.8% in Greensboro — top-decile yield for the area; either an underpriced asset or a hidden risk that comps aren't pricing in. Stress-test before assuming the spread holds.
Location & tenants
- Location reads 81/100 on livability (#12 in NC, #1,335 nationally) — a professional / high-income tenant draw. Strengths: amenities A+, commute A+, cost of living A+; Watch: employment D, crime F.
- Guilford County Schools (urban): math 39% / reading 45% proficiency, ranked #99 of 178 in NC (top 56%) — families likely to look elsewhere, expect single-tenant / working-renter base with shorter leases.
- Zoned schools: Florence Elementary (math 59% / reading 51%, grade C, #299 of 1,410 statewide, top 21%, 633 students, 55% FRL); Southwest Guilford Middle (math 35% / reading 51%, grade D-, #191 of 475 statewide, top 41%, 1,101 students, 55% FRL); Southwest Guilford High (math 52% / reading 59%, grade C, #265 of 535 statewide, top 50%, 1,662 students, 51% FRL) — zoned schools at 54% FRL track the district average.
- Market conditions: Rents rising (+1.2%/yr); 77 active listings in the ZIP; 15 comparable units currently listed for rent nearby; rentals at typical pace (median 22d on market — plan ~3-4 weeks tenant-placement turnaround); 3,843 units permitted in Guilford County in 2024 (2,397 in 5+ unit buildings).
Forward outlook
- Local home prices are declining (-3.0%/yr); year-one equity from $726 of loan paydown is wiped out by about $3k of value loss. Plan a longer hold.
- Guilford County population projected at +26% by 2050 — long-run rental-demand tailwind backs the buy-and-hold thesis.
Negotiation context
- It's been on market 57 days — a 3% lower offer ($102k) is reasonable based on typical stale-listing flexibility.
- Current owner paid $39k; list at $105k implies a 169% gain — meaningful room to come down on a strong offer.
Risks & watch-outs
- Climate carrying-cost: extreme-heat days projected 7→17/yr by 2055 (HVAC capex compounding) — expect insurance premiums to compound above CPI over the hold.
Questions for the listing agent
- It's been on market 57 days. Have you received any prior offers? Is the seller open to a 3% concession, seller financing, or rate buy-down credit?
- What does the HOA fee cover, when was the last increase, and are there any pending special assessments or reserve-fund shortfalls?
- Any open or pending special assessments — roof, HVAC, plumbing, elevator, façade? What's the per-unit balance and payoff schedule, and is the seller paying it off at close or rolling it to the buyer?
- Is there a deadline driving the sale (1031 exchange, divorce, estate, relocation)? That informs how much negotiation room exists.
- Crime grade is F in this area — have there been break-ins, vandalism, or insurance claims at this property in the last 3 years? What carrier currently insures it and at what premium?
- What's the average days-on-market for RENTAL listings here right now (not sales)? A rising rental-DOM trend means longer vacancies and softer asking-rent achievability than the comps imply.
- What's the recent tenant-quality profile in this submarket — average credit score on applications, eviction rate, late-payment / NSF rate, and stable-employment percentage? A property-management company in the area should have these aggregated.
- How much new apartment / multifamily construction is in the pipeline within 1–3 miles? Heavy new supply (>2% of stock underway) typically softens rents 12–24 months out; light construction supports rent growth.
Investment metrics
- 1% rule
- 1.26% ✓
- Cap rate
- 8.18%
- Cash-on-cash
- 6.73%
- DSCR
- 1.30
- GRM
- 6.6
CMA / ARV
No comps found within radius.
Projected returns pro-forma
-3.0% appreciation · 1.19% rent growth · sell at horizon
- IRR
- -8.3%
- Equity multiple
- 0.70×
- Total profit
- $-8,768
- Equity at exit
- $15,656
- IRR
- -1.7%
- Equity multiple
- 0.90×
- Total profit
- $-3,009
- Equity at exit
- $9,078
Cash invested: $29,400 (down + closing). Projections, not guarantees.
Landlord ↔ Tenant lean methodology
- Overall (STATE)
- 85 Strongly Landlord-Friendly
- State North Carolina
- 85 Strongly Landlord-Friendly · R+3
- County
- — inherits STATE
- City
- — inherits STATE
ZIP-level market 27409
- Home prices YoY
- -15.3%
- Rents YoY
- 1.2%
- Active inventory
- 77
- Price-to-rent
- 6.6×
Monthly cashflow live
- Estimated rent
- $1,322 high interval (Pro) →
- Mortgage (P&I)
- −$551
- Tax from tax record
- −$105 /mo · $1,258/yr
- Insurance
- −$44
- HOA
- −$180
- Vacancy / Maint / Mgmt
- −$278
- Net cashflow
- $165
Break-even live
UW: 25.0% down · 7.5% · 30yr · 1.5% tax · 5.0% vac · 8.0% maint · 8.0% mgmt
Financing live
Cash to close
- Down payment
- $26,250
- Closing costs
- $3,150
- Reserves months
- —
- Total cash needed
- —
Loan-product check · same deal, 3 products live
Conventional
25% down · 7.5% · 30yr
- Down + closing
- —
- Monthly P&I
- —
- Monthly cashflow
- —
- DSCR
- —
- Eligible?
- —
Personal DTI + credit; lowest rate.
DSCR
20% down · 8.5% · 30yr
- Down + closing
- —
- Monthly P&I
- —
- Monthly cashflow
- —
- DSCR
- —
- Eligible?
- —
No personal income docs; deal must DSCR.
Hard money
10% down · 12.0% · 12mo
- Down + closing
- —
- Monthly P&I
- —
- Monthly cashflow
- —
- DSCR
- —
- Eligible?
- —
Short-term bridge; refi at stabilization.
Rent comps 15 comps
| Address | Beds | Baths | Sqft | Rent | $/sqft | DOM | Units | Dist |
|---|---|---|---|---|---|---|---|---|
| 5637 Hornaday Rd Unit A Greensboro, NC | 2.0 | 1.0 | 836 | $1,295 | $1.55 | 14d | 1 | 0.12mi |
| 5661 Hornaday Rd Unit G Greensboro, NC | 2.0 | 1.0 | 836 | $1,195 | $1.43 | 23d | 1 | 0.14mi |
| 5729 Bramblegate Rd Unit F Greensboro, NC | 2.0 | 2.5 | 1100 | $1,300 | $1.18 | 23d | 1 | 0.19mi |
| 5729 Bramblegate Rd Unit F Greensboro, NC | 2.0 | 2.5 | 1100 | $1,300 | $1.18 | 19d | 1 | 0.19mi |
| 5715 Bramblegate Rd Greensboro, NC | 2.0 | 2.5 | 1054 | $1,245 | $1.18 | 23d | 1 | 0.24mi |
| 6227 Nile Pl Greensboro, NC | 1.0–2.0 | 1.0–2.0 | 831 | $1,365 | $1.64 | 21d | 38 | 0.94mi |
| 407 Guilford College Rd Greensboro, NC | 1.0–2.0 | 1.0–2.0 | 865 | $1,284 | $1.48 | 14d | 6 | 0.96mi |
| 1402 Bridford Pkwy Greensboro, NC | 1.0–3.0 | 1.0–2.0 | 1047 | $1,562 | $1.49 | 19d | 13 | 1.08mi |
| 405 Tullow Trl Greensboro, NC | 1.0–3.0 | 1.0–2.0 | 1174 | $1,628 | $1.39 | 14d | 10 | 1.14mi |
| 4750 Piedmont Pkwy Unit 214 Jamestown, NC | 1.0 | 1.0 | 974 | $1,445 | $1.48 | 23d | 1 | 1.19mi |
| 4227 Edith Ln Unit A Greensboro, NC | 2.0 | 1.0 | 938 | $1,500 | $1.60 | 14d | 1 | 1.43mi |
| 5500 Weslo Willow Cir Greensboro, NC | 2.0 | 1.0 | 703 | $1,089 | $1.55 | 19d | 72 | 1.45mi |
| 4480 Platinum Dr Unit 4428-2B Greensboro, NC | 1.0 | 1.5 | 883 | $1,250 | $1.42 | 23d | 1 | 1.48mi |
| 4480 Platinum Dr Unit 4450-1C Greensboro, NC | 2.0 | 2.0 | 1123 | $1,420 | $1.26 | 23d | 1 | 1.48mi |
| 4480 Platinum Dr Unit 4415-2A Greensboro, NC | 1.0 | 1.5 | 834 | $1,225 | $1.47 | 23d | 1 | 1.48mi |
HOA detail condo
- Monthly dues
- $180 · $2,160/yr
- Assessments
- None detected in remarks — confirm with the listing agent.
Listing history 6 events
-
2026-04-18status Pending
-
2026-04-07historical Due Diligence Period
-
2026-03-18price $105,000
-
2026-02-18$112,000 Active
-
1994-10-01soldstatus $39,000
-
1989-12-01soldstatus $45,000
ⓘ Source: listings_history table (triggers on properties + properties_extension) + one-shot
backfill from property_details.listing_events for pre-trigger history.
Tax reassessment forecast NC · Resets to sale price
- Current annual tax
- $1,258 · $105/mo
- Projected year-2 tax
- $1,258 · $105/mo
- Expected delta
- $0/yr ($0/mo · 0.0%)
ⓘ Screening estimate from a state-policy table — verify with the county assessor before closing.
Climate risk First Street
- Flood 4/10 Moderate FEMA zone X (unshaded) · 22% chance over 30 yrs
- Wildfire 1/10 Low
- Heat 5/10 Major 7 d/yr ≥103°F today · 17 d/yr by 30 yrs out
- Wind 4/10 Moderate 13% chance of damaging wind over 30 yrs
- Air quality 2/10 Low 1 unhealthy d/yr today · 1 by 30 yrs out
Nearby sold comps map
Loading sold comps map…
Walkable amenities ~0.75 mi
Loading nearby amenities…
Taxation est. · year 1
- Rental income
- $15,859
- − Mortgage interest
- −$5,882
- − Property taxes
- −$1,258
- − Insurance
- −$525
- − Repairs & maintenance
- −$1,269
- − Management
- −$1,269
- − HOA
- −$2,160
- − Depreciation
- −$3,055
- Taxable income
- $442
- Est. tax owed @ 24.0%
- −$106
- After-tax cash flow
- $1,872/yr
For passive investors: Depreciation is non-cash, so a rental often shows a tax loss while cash-flowing — sheltering income. Rental losses are passive: they offset passive income freely, and up to $25,000/yr can offset ordinary (W-2) income if you actively participate and your MAGI is under $100k (phasing out to $0 by $150k); unused losses carry forward. On sale, claimed depreciation is recaptured at up to 25%, and gains may owe capital-gains tax (a 1031 exchange can defer both). Figures are a year-1 estimate at your 24.0% rate — not tax advice; consult a CPA.
Schools (NCES district)
- District
- Guilford County Schools
- NCES district ID
- 3701920
- Math proficiency
- 39% ▲ 1.00%
- Reading proficiency
- 45% ▲ 1.00%
- Median HH income
- $46,315
- Composite
- 35.78/100
- National rank
- #4842
- State rank
- #99 of 178 in NC
Livability — Greensboro
- Score
- 81/100
- State rank
- #12
- US rank
- #1335
Category grades
Schools grade is shown separately in the Schools card above.
Census & demographics
- Census place
- Greensboro, NC
- County
- Guilford County · 487,190 people
- City population
- 329,421
- Metro
- Greensboro-High Point, NC
- Population (ZIP)
- 17,551
- Household income
- $60,281
- Rent vs Own
- Severe rent burden
- 1396.0
Population outlook (Guilford County) Hauer SSP2
- Today (2025)
- 584,596 people
- By 2030
- 616,851 · +5.5%
- By 2040
- 678,451 · +16.1%
- By 2050
- 734,788 · +25.7%
- By 2075
- 862,985 · +47.6%
- By 2100
- 948,704 · +62.3%
Race, ethnicity, and origin ACS 2023
- Neighborhood character
- Diverse neighborhood (Simpson 0.66)
- Race & ethnicity
- Black 41% White 40% Two or more races 9% Hispanic / Latino 8% Asian 3%
- Hispanic origin (detail)
- Mexican 3% Puerto Rican 1%
- Common ancestry
- Serbian 2% Romanian 1% Slovak 1%
- Foreign-born
- 14% · Canada, China
- Languages at home
- 85% English-only · Spanish 3% Other Indo-European 2% French/Haitian/Cajun 1%
Political lean MEDSL · Guilford
- 2024 margin
- Strong D (+21.8) · D 60.2% · R 38.4% · Other 1.4%
- 2008→2024 swing
- +3.5pp toward D · 2008: 18.4pp · 2024: 21.8pp
- All cycles
- 2024: D+21.8 2020: D+23.1 2016: D+20.0 2012: D+16.5 2008: D+18.4
Not yet ingested
- Civics
- —
Market trends
- HPI YoY
- ▼ -42.18%
- Current HPI
- 232.6805
- Rent YoY
- ▲ 1.19%
- Metro
- Greensboro-High Point, NC
- State GDP YoY
- ▲ 3.28%
- F500 in state
- 26
Industry mix (Fortune 500 HQ in NC)
| Industry | F500 HQs | Revenue |
|---|---|---|
| Financial Services | 2 | $213B |
|
||
| Retail | 2 | $95B |
|
||
| Industrial Conglomerate | 1 | $38B |
|
||
| Metals / Steel | 1 | $35B |
|
||
| Utilities | 1 | $30B |
|
||
| Industrial Machinery | 1 | $19B |
|
||
Price history
+133.3% since first listed6 events — show timeline
- 2026-04-18 Pending — Triad MLS
- 2026-04-07 Contingent — Triad MLS
- 2026-03-18 Price Changed $105,000 Triad MLS
- 2026-02-18 Listed $112,000 Triad MLS
- 1994-10-01 Sold (Public Records) $39,000 Public Records
- 1989-12-01 Sold (Public Records) $45,000 Public Records
Property tax history
+6.0%/yrLatest (2025): $1,258 · -1.0% YoY. Source: county tax records.
Cash-flow waterfall
monthlySold comps — $/sqft
last 12 mo · ≤1 miLoading sold comps…