2709 Alan Dale St · Farwell, MI
Flood risk No data
- FEMA flood zone
- —
- Chance of flooding over 30 yrs
- —
- Est. flood insurance / yr
- —
Fire risk No data
- Est. fire insurance / yr
- —
Heat risk No data
- Hot days now (above threshold)
- —
- Hot days in 30 yrs
- —
Wind risk No data
- Chance of severe wind over 30 yrs
- —
Air-quality risk No data
- Unhealthy air days now
- —
- Unhealthy air days in 30 yrs
- —
Risk factors via First Street. Map © Google.
Why this score? — see what drove the B- grade
The composite is a weighted blend of 9 inputs, each scored 0–100. Each bar is that input's sub-score; the figure is the points it added to the 100-point composite (weight × sub-score).
- Cash flow +30.0/30.0
- DSCR +10.0/10.0
- 1% rule +9.2/10.0
- ARV discount +7.5/15.0
- Livability +2.9/5.0
- Rent growth +2.5/5.0
- Condition / age +2.5/5.0
- Schools +2.4/10.0
- Appreciation +0.0/10.0
$60,000
🖨 Deal sheet 📄 Offer letter ✓ Due diligence
Listing remarks
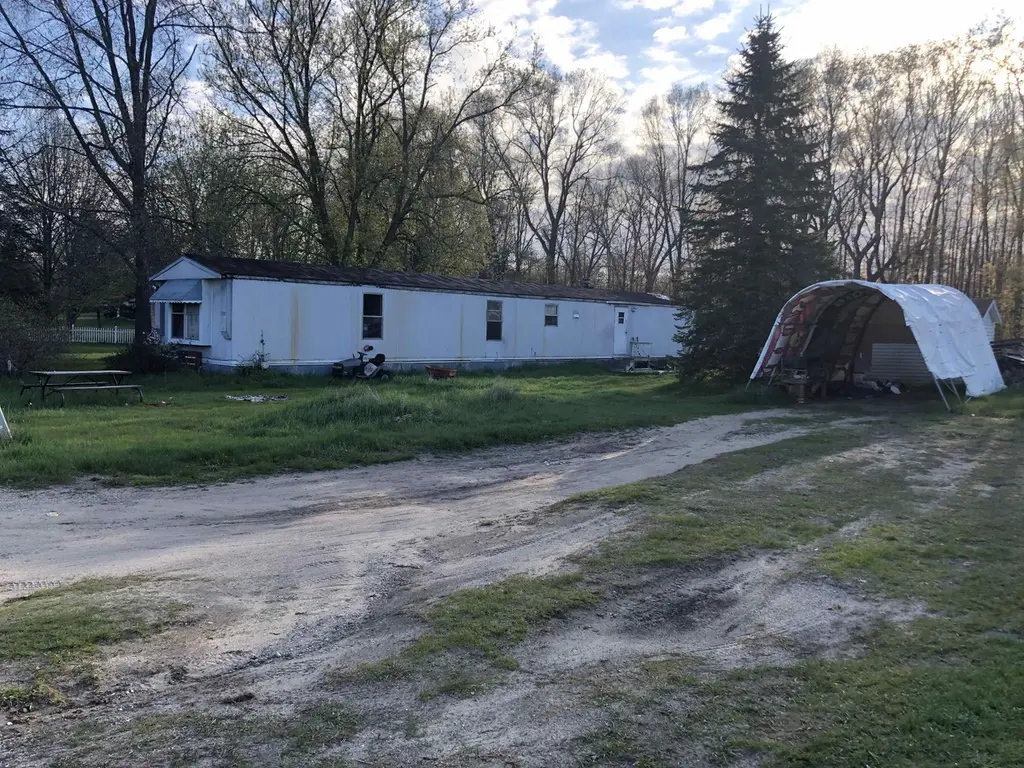
Surrey Lake access, 3 off water lots with 1987 Redman single wide, two sheds, canopy carport, mobile is in need of upgrades and repairs or could be taken off for your new homesite, well, septic, natural gas heat, cable available, blacktop road, frontage on Huckleberry Trail and Alan Dale, short distance to boat lauch Possession no sooner than 7-15-2026. Shown by advance appointment only #8026
Key facts
- Surrey lake access
- Canopy carport
- Natural gas heat
Tags
Property features AI
Finance
- Other: Approximately 0.79 acre lot; 212 ft frontage; Paved city/county road access; Subdivision: Surrey Lake #3; Municipality: Surrey Township (mailing city Farwell)
- HOA & community: Optional HOA/fee schedule
Exterior
- Utilities: Private well water; Septic sewage
- Home design: Single-wide manufactured home; Manufactured after 1976; One-story
- Construction: Built in 1987; Crawl space foundation
- Exterior features: Aluminum exterior; Deck; Shed (outbuilding); Subdivision setting; Lake/river privileges; Road frontage
Interior
- Kitchen: Kitchen on the main level (14 x 13)
- Bedrooms: Main-level primary bedroom (13 x 12); Main-level bedroom two (9 x 13); Main-level bedroom three (approx. 9 ft wide); First-floor bedroom
- Bathrooms: Two full bathrooms (both on main level)
- Heating & cooling: Forced air heating; Natural gas fuel
- Interior features: Main-level living room; Main-level kitchen; Main-level full bathroom
Neighborhood map
What this means for you Summary
Snapshot
- This is a 3-bed/2.0-bath single-family listed at $60k.
Deal economics
- At list price, monthly cash flow is $298 ($4k/yr) — positive.
- The deal already cash-flows at list — no discount required.
- Meets the 1% rule at list price ($854 rent vs $60k).
- Recommended offer: $59k (1.5% below list) — sets the bar for market timing.
Location & tenants
- Location reads 58/100 on livability (#622 in MI) — a working-class tenant base; expect higher turnover. Strengths: cost of living A+, housing A+; Watch: schools D-, crime F, amenities F.
- Farwell Area Schools (town): math 24% / reading 34% proficiency, ranked #388 of 540 in MI (top 72%) — low school quality limits family demand, transient renter base, plan for 1-2y turnover; 62% free/reduced lunch — lower-income household profile, screen leases tightly.
- Market conditions: 126 active listings in the ZIP; 77 units permitted in Clare County in 2024 (0 in 5+ unit buildings).
Forward outlook
- Local home prices are declining (-3.0%/yr); year-one equity from $415 of loan paydown is wiped out by about $2k of value loss. Plan a longer hold.
- Clare County population projected at -20% by 2050 — secular population decline; favor cash flow + early exit over multi-decade hold.
- At projected returns (-3.0% appreciation + 3.0% rent growth), your $17k cash investment doubles in ~6 years — after that, you're playing with house money.
Negotiation context
- It's been on market 22 days — a 2% lower offer ($59k) is reasonable based on typical stale-listing flexibility.
Questions for the listing agent
- Is there a deadline driving the sale (1031 exchange, divorce, estate, relocation)? That informs how much negotiation room exists.
- Schools are D-rated, which usually means shorter tenancies and higher turnover. Who's the typical renter profile here, and what's been the actual vacancy rate?
- Crime grade is F in this area — have there been break-ins, vandalism, or insurance claims at this property in the last 3 years? What carrier currently insures it and at what premium?
- What's the average days-on-market for RENTAL listings here right now (not sales)? A rising rental-DOM trend means longer vacancies and softer asking-rent achievability than the comps imply.
- What's the recent tenant-quality profile in this submarket — average credit score on applications, eviction rate, late-payment / NSF rate, and stable-employment percentage? A property-management company in the area should have these aggregated.
- How much new for-sale + rental construction is in the pipeline within 1–3 miles? Heavy new supply typically softens prices + rents 12–24 months out; constrained supply supports both.
Investment metrics
- 1% rule
- 1.42% ✓
- Cap rate
- 12.24%
- Cash-on-cash
- 21.26%
- DSCR
- 1.95
- GRM
- 5.9
CMA / ARV
- ARV (median comp)
- $215,820
- List price
- $60,000
- Delta
- -72.20%
- Verdict
- UNDERPRICED
- Comps
- 20 within 1.0 mi
Show comp detail 9 sales within ~0.75 mi
| Address | Dist | Beds/Ba | Sqft | Sold | Price | $/sf | Match |
|---|---|---|---|---|---|---|---|
| 2709 Alan Dale St | 0.00mi | 3/2.0 | 1,064 (0%) | 0mo | $60,000 | $56 | 100 |
| 9270 Birch Isle Rd | 0.20mi | 2/1.5 (-1) | 1,094 (+3%) | 20mo | $255,900 | $234 | 62 |
| 2191 Pine Crescent Dr | 0.61mi | 3/1.0 | 1,056 (-1%) | 7mo | $127,500 | $121 | 60 |
| 2510 Huckleberry Trl | 0.25mi | 3/1.5 | 1,164 (+9%) | 13mo | $235,000 | $202 | 59 |
| 3152 Brier Ln | 0.38mi | 2/2.0 (-1) | 1,008 (-5%) | 23mo | $260,000 | $258 | 49 |
| 3143 Brier Ln | 0.34mi | 2/1.0 (-1) | 1,120 (+5%) | 21mo | $245,000 | $219 | 49 |
| 9440 Lydell Rd | 0.73mi | 3/2.0 | 1,064 (0%) | 24mo | $60,000 | $56 | 46 |
| 2243 Oakridge Dr | 0.53mi | 3/2.0 | 924 (-13%) | 10mo | $66,000 | $71 | 45 |
| 2243 Oakridge Dr Lot : 65 | 0.60mi | 3/2.0 | 924 (-13%) | 10mo | $57,000 | $62 | 41 |
Match score weights: distance 35% · size 25% · config 20% · recency 20%. Top-matched comps best support the ARV.
Projected returns pro-forma
-3.0% appreciation · 3.0% rent growth · sell at horizon
- IRR
- 13.7%
- Equity multiple
- 1.55×
- Total profit
- $9,222
- Equity at exit
- $8,946
- IRR
- 22.5%
- Equity multiple
- 2.93×
- Total profit
- $32,396
- Equity at exit
- $5,188
Cash invested: $16,800 (down + closing). Projections, not guarantees.
Landlord ↔ Tenant lean methodology
- Overall (STATE)
- 62 Landlord-Friendly
- State Michigan
- 62 Landlord-Friendly · EVEN
- County
- — inherits STATE
- City
- — inherits STATE
ZIP-level market 48622
- Home prices YoY
- -23.9%
- Active inventory
- 126
- Price-to-rent
- 5.9×
Monthly cashflow live
- Estimated rent
- $854 medium interval (Pro) →
- Mortgage (P&I)
- −$315
- Tax from tax record
- −$37 /mo · $450/yr
- Insurance
- −$25
- HOA
- −$0
- Vacancy / Maint / Mgmt
- −$179
- Net cashflow
- $298
Break-even live
UW: 25.0% down · 7.5% · 30yr · 1.5% tax · 5.0% vac · 8.0% maint · 8.0% mgmt
Financing live
Cash to close
- Down payment
- $15,000
- Closing costs
- $1,800
- Reserves months
- —
- Total cash needed
- —
Loan-product check · same deal, 3 products live
Conventional
25% down · 7.5% · 30yr
- Down + closing
- —
- Monthly P&I
- —
- Monthly cashflow
- —
- DSCR
- —
- Eligible?
- —
Personal DTI + credit; lowest rate.
DSCR
20% down · 8.5% · 30yr
- Down + closing
- —
- Monthly P&I
- —
- Monthly cashflow
- —
- DSCR
- —
- Eligible?
- —
No personal income docs; deal must DSCR.
Hard money
10% down · 12.0% · 12mo
- Down + closing
- —
- Monthly P&I
- —
- Monthly cashflow
- —
- DSCR
- —
- Eligible?
- —
Short-term bridge; refi at stabilization.
Listing history 2 events
-
2026-05-13historical Accepting Backup Offers 399-char remark
-
2026-05-06$60,000 Active 399-char remark
ⓘ Source: listings_history table (triggers on properties + properties_extension) + one-shot
backfill from property_details.listing_events for pre-trigger history.
Tax reassessment forecast MI · Partial reset (capped growth)
- Current annual tax
- $450 · $37/mo
- Projected year-2 tax
- $687 · $57/mo
- Expected delta
- +$237/yr (+$20/mo · 52.7%)
ⓘ Screening estimate from a state-policy table — verify with the county assessor before closing.
Nearby sold comps map
Loading sold comps map…
Walkable amenities ~0.75 mi
Loading nearby amenities…
Taxation est. · year 1
- Rental income
- $10,249
- − Mortgage interest
- −$3,361
- − Property taxes
- −$450
- − Insurance
- −$300
- − Repairs & maintenance
- −$820
- − Management
- −$820
- − Depreciation
- −$1,745
- Taxable income
- $2,753
- Est. tax owed @ 24.0%
- −$661
- After-tax cash flow
- $2,910/yr
For passive investors: Depreciation is non-cash, so a rental often shows a tax loss while cash-flowing — sheltering income. Rental losses are passive: they offset passive income freely, and up to $25,000/yr can offset ordinary (W-2) income if you actively participate and your MAGI is under $100k (phasing out to $0 by $150k); unused losses carry forward. On sale, claimed depreciation is recaptured at up to 25%, and gains may owe capital-gains tax (a 1031 exchange can defer both). Figures are a year-1 estimate at your 24.0% rate — not tax advice; consult a CPA.
Schools (NCES district)
- District
- Farwell Area Schools
- NCES district ID
- 2614100
- Math proficiency
- 24% ▼ -8.00%
- Reading proficiency
- 34% ▼ -8.00%
- Median HH income
- $36,696
- Composite
- 24.07/100
- National rank
- #7760
- State rank
- #388 of 540 in MI
Livability — Farwell
- Score
- 58/100
- State rank
- #622
- US rank
- #20973
Category grades
Schools grade is shown separately in the Schools card above.
Census & demographics
- Population (ZIP)
- 5,970
Population outlook (Clare County) Hauer SSP2
- Today (2025)
- 29,283 people
- By 2030
- 28,199 · -3.7%
- By 2040
- 25,722 · -12.2%
- By 2050
- 23,372 · -20.2%
- By 2075
- 18,569 · -36.6%
- By 2100
- 14,320 · -51.1%
Race, ethnicity, and origin ACS 2023
- Neighborhood character
- Predominantly White (91%)
- Race & ethnicity
- White 91% Two or more races 4% Hispanic / Latino 3% Black 1%
- Common ancestry
- Romanian 5% Lithuanian 3% Iranian 2%
- Foreign-born
- 0%
- Languages at home
- 98% English-only · German/W. Germanic 2%
Political lean MEDSL · Clare
- 2024 margin
- Solid R (+37.6) · D 30.5% · R 68.1% · Other 1.4%
- 2008→2024 swing
- -42.4pp toward R · 2008: 4.8pp · 2024: -37.6pp
- All cycles
- 2024: R+37.6 2020: R+34.8 2016: R+31.8 2012: R+4.8 2008: D+4.8
Not yet ingested
- Civics
- —
Market trends
- HPI YoY
- ▼ -71.95%
- Current HPI
- 229.7867
- Rent YoY
- —
- Metro
- —
- State GDP YoY
- ▲ 1.37%
- F500 in state
- 28
Industry mix (Fortune 500 HQ in MI)
| Industry | F500 HQs | Revenue |
|---|---|---|
| Automotive Parts | 3 | $48B |
|
||
| Automotive | 2 | $372B |
|
||
| Chemicals | 1 | $45B |
|
||
| Automotive Retail | 1 | $29B |
|
||
| Healthcare / Medical Devices | 1 | $23B |
|
||
| Automotive Technology | 1 | $20B |
|
||
Price history
+0.0% since first listed4 events — show timeline
- 2026-06-15 Sold (MLS) $60,000 MiRealSource-MiMLS
- 2026-05-29 Pending — MiRealSource-MiMLS
- 2026-05-13 Contingent — MiRealSource-MiMLS
- 2026-05-06 Listed $60,000 MiRealSource-MiMLS
Property tax history
-9.2%/yrLatest (2020): $450 · -30.1% YoY. Source: county tax records.
Cash-flow waterfall
monthlySold comps — $/sqft
last 12 mo · ≤1 miLoading sold comps…