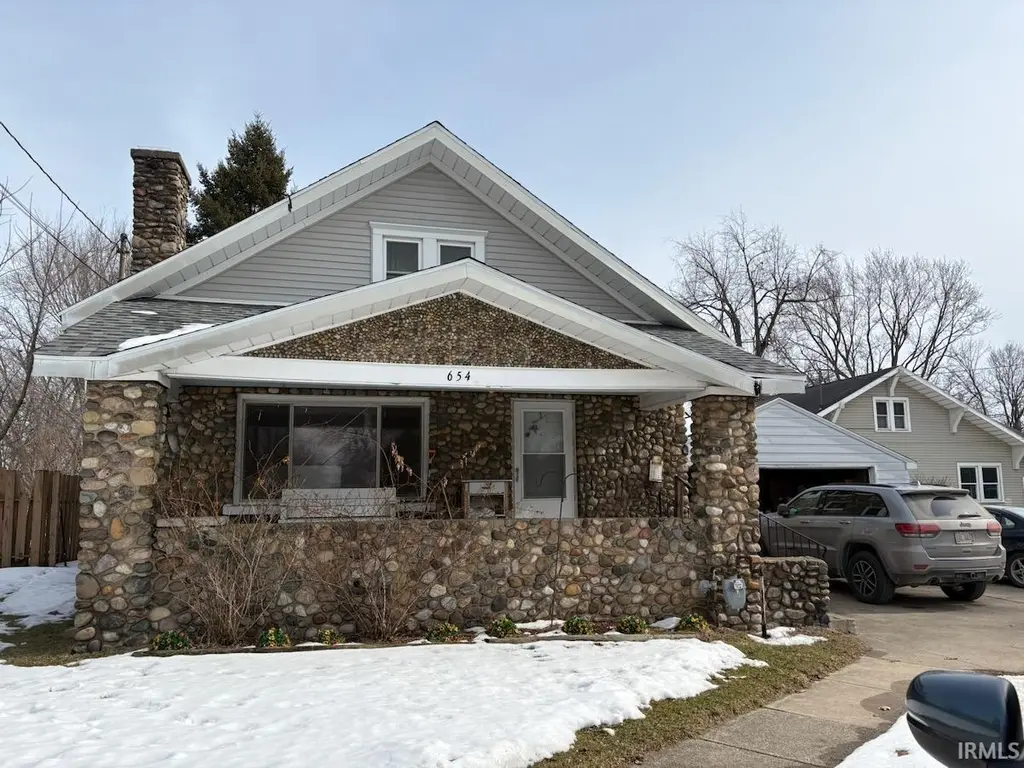
654 James St · Elkhart, IN
Flood risk 1/10 · Minimal
- FEMA flood zone
- X (unshaded)
- Chance of flooding over 30 yrs
- 0.0%
- Est. flood insurance / yr
- $473 – $860
Fire risk 1/10 · Minimal
- Est. fire insurance / yr
- $717 – $1,331
Heat risk 3/10 · Minor
- Hot days now (above 101°F)
- 7 days/yr
- Hot days in 30 yrs
- 16 days/yr
Wind risk 2/10 · Minimal
- Chance of severe wind over 30 yrs
- —
Air-quality risk 2/10 · Minimal
- Unhealthy air days now
- 1 days/yr
- Unhealthy air days in 30 yrs
- 2 days/yr
Risk factors via First Street. Map © Google.
Why this score? — see what drove the B grade
The composite is a weighted blend of 9 inputs, each scored 0–100. Each bar is that input's sub-score; the figure is the points it added to the 100-point composite (weight × sub-score).
- Cash flow +30.0/30.0
- ARV discount +15.0/15.0
- DSCR +10.0/10.0
- 1% rule +8.0/10.0
- Livability +3.4/5.0
- Rent growth +2.5/5.0
- Condition / age +2.5/5.0
- Schools +1.8/10.0
- Appreciation +0.0/10.0
$104,900
🖨 Deal sheet (PDF) 📄 Offer letter ✓ Due diligence
Listing remarks
. New windows and roof, house being sold as is.
Key facts
- 3,049 sq ft lot
- 2 garage spots
- Built 1920
Property features AI
Exterior
- Parking: Detached 2-car garage
- Utilities: Public water; Public sewer
- Home design: Single-family residence (site-built); 2 stories
- Construction: Stone construction
- Exterior features: Irregular lot; Lot dimensions approximately 66 x 48
Interior
- Bedrooms: 6 total rooms (bedroom count not specified)
- Bathrooms: 1 full bathroom; 1 half bathroom; One main-level bathroom
- Heating & cooling: Natural gas heating with forced air; Central air conditioning
- Interior features: Wood-burning fireplace (1); Unfinished basement
- Laundry & utility: Laundry in basement
Neighborhood map
What this means for you Summary
Snapshot
- This is a 2-bed/1.5-bath single-family listed at $105k.
Deal economics
- At list price, monthly cash flow is $409 ($5k/yr) — positive.
- The deal already cash-flows at list — no discount required.
- Meets the 1% rule at list price ($1k rent vs $105k).
- Cap rate 11.0% vs local median 3.9% in Elkhart — top-decile yield for the area; either an underpriced asset or a hidden risk that comps aren't pricing in. Stress-test before assuming the spread holds.
Location & tenants
- Location reads 68/100 on livability (#224 in IN) — a middle-class / working-renter tenant base. Strengths: cost of living A+, housing A+, health & safety A+; Watch: amenities C-, crime F, commute F.
- Elkhart Community Schools (urban): math 18% / reading 25% proficiency, ranked #271 of 301 in IN (top 90%) — low school quality limits family demand, transient renter base, plan for 1-2y turnover.
- Zoned schools: Riverview Elementary School (math 36% / reading 31%, grade F, #631 of 994 statewide, top 64%, 458 students, 78% FRL); North Side Middle School (math 15% / reading 31%, grade F, #263 of 330 statewide, top 80%, 627 students, 72% FRL); Elkhart High School (math 17% / reading 51%, grade F, #285 of 369 statewide, top 78%, 3,325 students, 63% FRL).
- Market conditions: 150 active listings in the ZIP; 6 comparable units currently listed for rent nearby; rentals lingering (median 45d on market — plan ~5-8 weeks vacancy on turnover, expect pricing pressure); 50% of comp listings sitting > 30 days — soft ceiling on asking rent; 484 units permitted in Elkhart County in 2024 (136 in 5+ unit buildings).
Forward outlook
- Local home prices are declining (-3.0%/yr); year-one equity from $725 of loan paydown is wiped out by about $3k of value loss. Plan a longer hold.
- Elkhart County population projected at +7% by 2050 — modest demand growth; plan on rents tracking national, not racing it.
- At projected returns (-3.0% appreciation + 3.0% rent growth), your $29k cash investment doubles in ~8 years — after that, you're playing with house money.
Negotiation context
- Only 1 days on market — expect competitive offers; lowballing is unlikely to land.
Risks & watch-outs
- Watch-outs: built in 1920 — expect roof / HVAC / electrical / plumbing capex.
Questions for the listing agent
- Built in 1920 — when were the roof, HVAC, electrical panel, plumbing, and water heater last replaced?
- Is there a deadline driving the sale (1031 exchange, divorce, estate, relocation)? That informs how much negotiation room exists.
- Schools are F-rated, which usually means shorter tenancies and higher turnover. Who's the typical renter profile here, and what's been the actual vacancy rate?
- Crime grade is F in this area — have there been break-ins, vandalism, or insurance claims at this property in the last 3 years? What carrier currently insures it and at what premium?
- What's the average days-on-market for RENTAL listings here right now (not sales)? A rising rental-DOM trend means longer vacancies and softer asking-rent achievability than the comps imply.
- What's the recent tenant-quality profile in this submarket — average credit score on applications, eviction rate, late-payment / NSF rate, and stable-employment percentage? A property-management company in the area should have these aggregated.
- How much new for-sale + rental construction is in the pipeline within 1–3 miles? Heavy new supply typically softens prices + rents 12–24 months out; constrained supply supports both.
Investment metrics
- 1% rule
- 1.30% ✓
- Cap rate
- 10.98%
- Cash-on-cash
- 16.72%
- DSCR
- 1.74
- GRM
- 6.4
CMA / ARV
- ARV (median comp)
- $163,560
- List price
- $104,900
- Delta
- -35.86%
- Verdict
- UNDERPRICED
- Comps
- 20 within 1.0 mi
Show comp detail 12 sales within ~0.75 mi
| Address | Dist | Beds/Ba | Sqft | Sold | Price | $/sf | Match |
|---|---|---|---|---|---|---|---|
| 1030 Middlebury St | 0.25mi | 1/2.0 (-1) | 1,324 (-2%) | 2mo | $130,000 | $98 | 76 |
| 1102 Carolyn Ave | 0.28mi | 2/2.0 | 1,310 (-3%) | 4mo | $157,000 | $120 | 76 |
| 240 Gage Ave | 0.50mi | 3/1.0 (+1) | 1,368 (+1%) | 2mo | $200,000 | $146 | 66 |
| 208 Alfred St | 0.61mi | 2/1.5 | 1,316 (-3%) | 1mo | $194,900 | $148 | 66 |
| 1031 Middlebury St | 0.26mi | 3/2.0 (+1) | 1,232 (-9%) | 5mo | $50,400 | $41 | 62 |
| 1016 Princeton St | 0.67mi | 3/1.5 (+1) | 1,353 (+0%) | 3mo | $140,000 | $103 | 62 |
| 455 James St | 0.28mi | 3/2.0 (+1) | 1,500 (+11%) | 2mo | $267,000 | $178 | 60 |
| 137 Bank St | 0.69mi | 3/2.0 (+1) | 1,344 (-1%) | 2mo | $220,000 | $164 | 58 |
| 229 Manor Ave | 0.52mi | 2/2.5 | 1,220 (-10%) | 0mo | $189,900 | $156 | 55 |
| 112 Crescent St | 0.73mi | 3/1.0 (+1) | 1,264 (-6%) | 1mo | $180,000 | $142 | 47 |
| 143 Kenyon Ave | 0.71mi | 3/2.5 (+1) | 1,514 (+12%) | 4mo | $205,000 | $135 | 35 |
| 162 Home Ave | 0.75mi | 3/1.0 (+1) | 1,539 (+14%) | 4mo | $199,000 | $129 | 31 |
Match score weights: distance 35% · size 25% · config 20% · recency 20%. Top-matched comps best support the ARV.
Projected returns pro-forma
-3.0% appreciation · 3.0% rent growth · sell at horizon
- IRR
- 7.9%
- Equity multiple
- 1.31×
- Total profit
- $9,056
- Equity at exit
- $15,641
- IRR
- 17.1%
- Equity multiple
- 2.41×
- Total profit
- $41,395
- Equity at exit
- $9,070
Cash invested: $29,372 (down + closing). Projections, not guarantees.
Landlord ↔ Tenant lean methodology
- Overall (STATE)
- 90 Strongly Landlord-Friendly
- State Indiana
- 90 Strongly Landlord-Friendly · R+11
- County
- — inherits STATE
- City
- — inherits STATE
ZIP-level market 46516
- Active inventory
- 150
- Price-to-rent
- 6.4×
Monthly cashflow live
- Estimated rent
- $1,364 high interval (Pro) →
- Mortgage (P&I)
- −$550
- Tax from tax record
- −$75 /mo · $894/yr
- Insurance
- −$44
- HOA
- −$0
- Vacancy / Maint / Mgmt
- −$286
- Net cashflow
- $409
Break-even live
Sensitivity live
| Price | -10% $469 | -5% $439 | +0% $409 | +5% $380 | +10% $350 |
|---|---|---|---|---|---|
| Rent | -10% $302 | -5% $355 | +0% $409 | +5% $463 | +10% $517 |
| Rate | -1.0pp $462 | -0.5pp $436 | base $409 | +0.5pp $382 | +1.0pp $354 |
UW: 25.0% down · 7.5% · 30yr · 1.5% tax · 5.0% vac · 8.0% maint · 8.0% mgmt
Financing live
Cash to close
- Down payment
- $26,225
- Closing costs
- $3,147
- Reserves months
- —
- Total cash needed
- —
Loan-product check · same deal, 3 products live
Conventional
25% down · 7.5% · 30yr
- Down + closing
- —
- Monthly P&I
- —
- Monthly cashflow
- —
- DSCR
- —
- Eligible?
- —
Personal DTI + credit; lowest rate.
DSCR
20% down · 8.5% · 30yr
- Down + closing
- —
- Monthly P&I
- —
- Monthly cashflow
- —
- DSCR
- —
- Eligible?
- —
No personal income docs; deal must DSCR.
Hard money
10% down · 12.0% · 12mo
- Down + closing
- —
- Monthly P&I
- —
- Monthly cashflow
- —
- DSCR
- —
- Eligible?
- —
Short-term bridge; refi at stabilization.
Rent comps 6 comps
| Address | Beds | Baths | Sqft | Rent | $/sqft | DOM | Units | Dist |
|---|---|---|---|---|---|---|---|---|
| 1308 Princeton St Elkhart, IN | 2.0 | 1.0 | 981 | $1,350 | $1.38 | 22d | 1 | 0.75mi |
| 1401 S Main St Elkhart, IN | 1.0 | 1.0 | 875 | $1,750 | $2.00 | 45d | 1 | 0.88mi |
| 200 Jr. Achievement Dr Elkhart, IN | 1.0–2.0 | 1.0–2.0 | 946 | $1,770 | $1.87 | 22d | 10 | 1.02mi |
| 1120 Worthmore Ave Elkhart, IN | 2.0 | 1.0 | 987 | $1,700 | $1.72 | 22d | 1 | 1.25mi |
| 1023 Cone St Elkhart, IN | 2.0 | 1.0 | 1112 | $1,200 | $1.08 | 46d | 1 | 1.39mi |
| 209 S 2nd St Unit B Elkhart, IN | 1.0 | 1.0 | 1200 | $1,100 | $0.92 | 45d | 1 | 1.39mi |
Listing history 2 events
-
2026-05-31status $104,900 Pending 1 DOM
-
2026-05-09historical $104,900 99-char remark
ⓘ Source: listings_history table (triggers on properties + properties_extension) + one-shot
backfill from property_details.listing_events for pre-trigger history.
Tax reassessment forecast IN · Partial reset (capped growth)
- Current annual tax
- $894 · $75/mo
- Projected year-2 tax
- $894 · $75/mo
- Expected delta
- $0/yr ($0/mo · 0.0%)
ⓘ Screening estimate from a state-policy table — verify with the county assessor before closing.
Climate risk First Street
- Flood 1/10 Low FEMA zone X (unshaded) · 0% chance over 30 yrs
- Wildfire 1/10 Low
- Heat 3/10 Moderate 7 d/yr ≥101°F today · 16 d/yr by 30 yrs out
- Wind 2/10 Low
- Air quality 2/10 Low 1 unhealthy d/yr today · 2 by 30 yrs out
Nearby sold comps map
Loading sold comps map…
Walkable amenities ~0.75 mi
Loading nearby amenities…
Taxation est. · year 1
- Rental income
- $16,369
- − Mortgage interest
- −$5,876
- − Property taxes
- −$894
- − Insurance
- −$524
- − Repairs & maintenance
- −$1,310
- − Management
- −$1,310
- − Depreciation
- −$3,052
- Taxable income
- $3,404
- Est. tax owed @ 24.0%
- −$817
- After-tax cash flow
- $4,095/yr
For passive investors: Depreciation is non-cash, so a rental often shows a tax loss while cash-flowing — sheltering income. Rental losses are passive: they offset passive income freely, and up to $25,000/yr can offset ordinary (W-2) income if you actively participate and your MAGI is under $100k (phasing out to $0 by $150k); unused losses carry forward. On sale, claimed depreciation is recaptured at up to 25%, and gains may owe capital-gains tax (a 1031 exchange can defer both). Figures are a year-1 estimate at your 24.0% rate — not tax advice; consult a CPA.
Schools (NCES district)
- District
- Elkhart Community Schools
- NCES district ID
- 1803270
- Math proficiency
- 18% ▼ -12.00%
- Reading proficiency
- 25% ▼ -9.00%
- Median HH income
- $42,881
- Composite
- 18.45/100
- National rank
- #8928
- State rank
- #271 of 301 in IN
Livability — Elkhart
- Score
- 68/100
- State rank
- #224
- US rank
- #9852
Category grades
Schools grade is shown separately in the Schools card above.
Census & demographics
- Census place
- Elkhart, IN
- County
- Elkhart County · 107,928 people
- City population
- 74,260
- Metro
- Elkhart-Goshen, IN
- Population (ZIP)
- 31,871
- Household income
- $56,492
- Rent vs Own
- Severe rent burden
- 995.0
Population outlook (Elkhart County) Hauer SSP2
- Today (2025)
- 213,761 people
- By 2030
- 218,103 · +2.0%
- By 2040
- 225,381 · +5.4%
- By 2050
- 229,447 · +7.3%
- By 2075
- 232,856 · +8.9%
- By 2100
- 214,088 · +0.2%
Race, ethnicity, and origin ACS 2023
- Neighborhood character
- Diverse neighborhood (Simpson 0.56)
- Race & ethnicity
- White 60% Hispanic / Latino 26% Black 9% Two or more races 8% Asian 1%
- Hispanic origin (detail)
- Mexican 15%
- Common ancestry
- Romanian 2% Iranian 2% Lithuanian 2%
- Foreign-born
- 15% · Canada
- Languages at home
- 77% English-only · Spanish 19% Other Indo-European 3%
Political lean MEDSL · Elkhart
- 2024 margin
- Solid R (+32.4) · D 33.1% · R 65.5% · Other 1.4%
- 2008→2024 swing
- -21.2pp toward R · 2008: -11.2pp · 2024: -32.4pp
- All cycles
- 2024: R+32.4 2020: R+28.1 2016: R+32.4 2012: R+26.5 2008: R+11.2
Not yet ingested
- Civics
- —
Market trends
- HPI YoY
- ▼ -233.42%
- Current HPI
- 239.2508
- Rent YoY
- —
- Metro
- Elkhart-Goshen, IN
- State GDP YoY
- ▲ 2.90%
- F500 in state
- 18
Industry mix (Fortune 500 HQ in IN)
| Industry | F500 HQs | Revenue |
|---|---|---|
| Industrial Machinery | 2 | $37B |
|
||
| Healthcare | 1 | $177B |
|
||
| Pharmaceuticals | 1 | $45B |
|
||
| Metals / Steel | 1 | $18B |
|
||
| Agriculture | 1 | $17B |
|
||
| Packaging | 1 | $12B |
|
||
Price history
+0.0% since first listed3 events — show timeline
- 2026-05-30 Pending — IRMLS
- 2026-05-29 Listed $104,900 IRMLS
- 2026-05-09 Coming Soon $104,900 IRMLS
Property tax history
+10.3%/yrLatest (2025): $894 · +58.0% YoY. Source: county tax records.
Cash-flow waterfall
monthlySold comps — $/sqft
last 12 mo · ≤1 miLoading sold comps…