211 Cole Rd · Loch Sheldrake, NY
Flood risk 1/10 · Minimal
- FEMA flood zone
- X (unshaded)
- Chance of flooding over 30 yrs
- 0.0%
- Est. flood insurance / yr
- $473 – $860
Fire risk 1/10 · Minimal
- Est. fire insurance / yr
- $691 – $1,283
Heat risk 2/10 · Minimal
- Hot days now (above 91°F)
- 7 days/yr
- Hot days in 30 yrs
- 16 days/yr
Wind risk 2/10 · Minimal
- Chance of severe wind over 30 yrs
- 4.0%
Air-quality risk 2/10 · Minimal
- Unhealthy air days now
- 0 days/yr
- Unhealthy air days in 30 yrs
- 1 days/yr
Risk factors via First Street. Map © Google.
Why this score? — see what drove the D grade
The composite is a weighted blend of 9 inputs, each scored 0–100. Each bar is that input's sub-score; the figure is the points it added to the 100-point composite (weight × sub-score).
- Appreciation +10.0/10.0
- Cash flow +7.6/30.0
- ARV discount +7.5/15.0
- Schools +3.6/10.0
- Livability +3.2/5.0
- Rent growth +2.5/5.0
- Condition / age +2.5/5.0
- 1% rule +2.1/10.0
- DSCR +1.7/10.0
$249,000
🖨 Deal sheet (PDF) 📄 Offer letter ✓ Due diligence
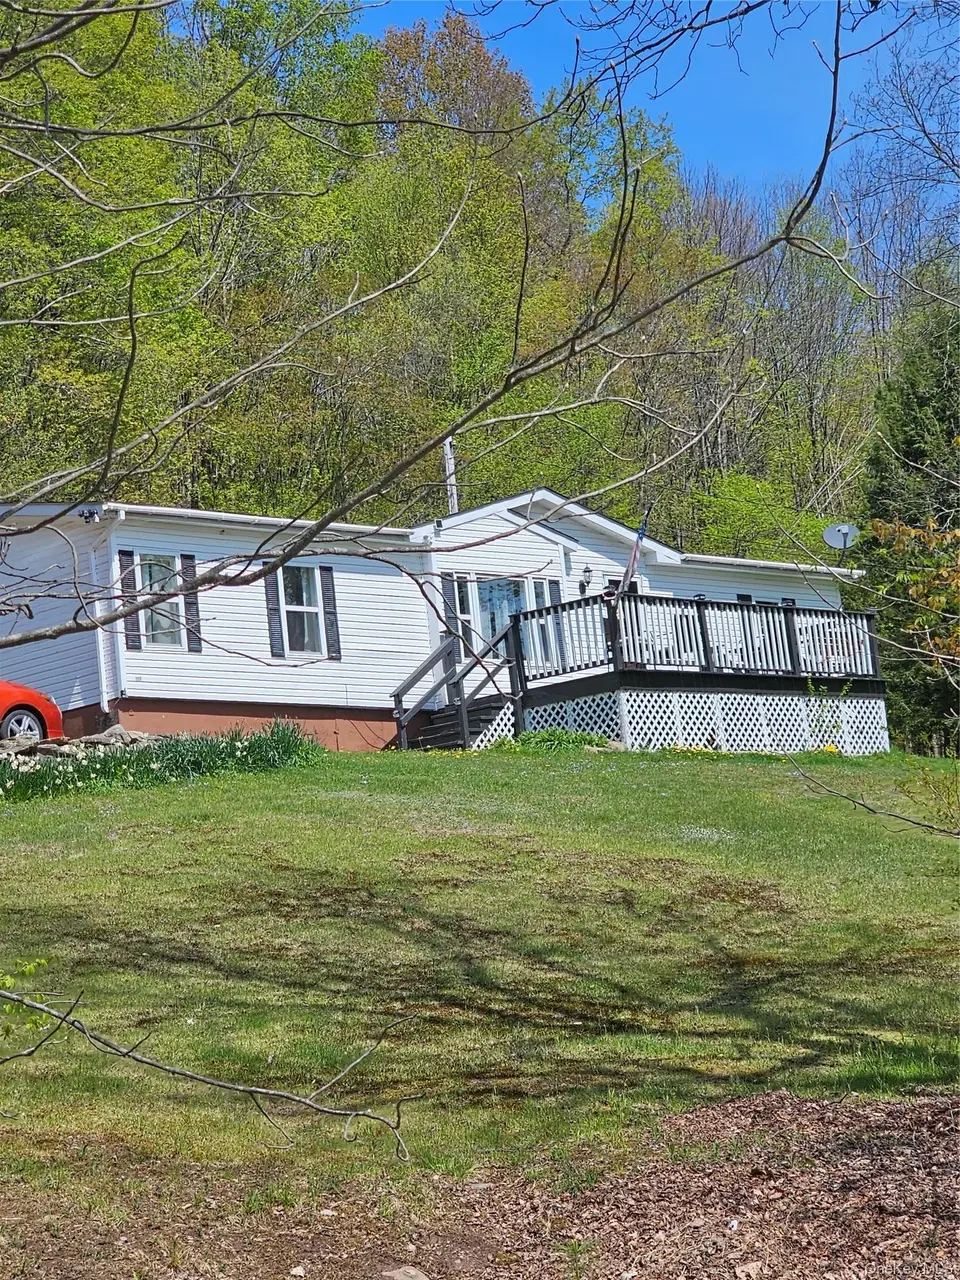
Listing remarks
Welcome to the heart of the Catskills! Nestled on 1.25 beautiful private acres in desirable Hurleyville, this charming and well-maintained 3-bedroom, 2-bath home offers the perfect blend of comfort, privacy, and convenience. With 1,456 sq ft of living space, the home features a spacious and functional layout, generously sized bedrooms, a large primary suite with private bath, bright eat-in kitchen, central air, and forced hot air heat for year-round comfort. Enjoy peaceful mornings surrounded by nature and relaxing evenings in your own private country setting, while still being just minutes from shopping, restaurants, schools, and major roadways. The property offers plenty of outdoor space
Key facts
- Private acres
- Outdoor space
- 1.25 acre lot
Tags
Property features AI
Exterior
- Parking: Driveway; No carport
- Utilities: Electricity connected (NYSEG); Natural gas connected; Septic tank
- Home design: Manufactured on land (double wide)
- Construction: Double wide manufactured home; Dormer attic; Property condition: Actual
- Exterior features: Frame construction; Not waterfront
Interior
- Kitchen: Dishwasher; Range; Refrigerator
- Bedrooms: 5 rooms total (includes bedrooms and living spaces)
- Bathrooms: 2 full bathrooms
- Heating & cooling: Central air conditioning; Propane heating
- Interior features: First-floor bedroom; Washer/dryer hookup
- Laundry & utility: Inside laundry; Electric dryer hookup; Gas dryer hookup
Neighborhood map
What this means for you Summary
Snapshot
- This is a 3-bed/2.0-bath manufactured listed at $249k.
Deal economics
- At list price, monthly cash flow is $-298 ($-4k/yr) — negative.
- To cash-flow at today's rent, offer at most $196k (21.2% below list).
- To meet the 1% rule (rent ≥ 1% of price), the offer needs to be $176k (29.1% below list).
- Recommended offer: $176k (29.1% below list) — sets the bar for 1% rule.
Location & tenants
- Location reads 63/100 on livability (#793 in NY) — a middle-class / working-renter tenant base. Strengths: cost of living A+, crime A-, housing A-; Watch: amenities F, commute F, health & safety D-.
- Tri-Valley Central School District (rural): math 38% / reading 46% proficiency, ranked #488 of 590 in NY (top 83%) — families likely to look elsewhere, expect single-tenant / working-renter base with shorter leases.
- Zoned schools: Tri-Valley Elementary School (math 27% / reading 47%, grade F, #1,519 of 2,108 statewide, top 74%, 462 students, 50% FRL); Tri-Valley Secondary School (math 52% / reading 47%, grade D, #974 of 1,100 statewide, top 91%, 435 students, 49% FRL) — zoned schools average 50% FRL vs 28% district-wide (21 pts higher); higher-poverty schools than district average — tighter screening recommended.
- Market conditions: 21 active listings in the ZIP; 739 units permitted in Sullivan County in 2024 (5 in 5+ unit buildings).
Forward outlook
- In year one you build about $27k of equity ($2k loan paydown + $25k appreciation (10.0% local appreciation)).
- Sullivan County population projected at -24% by 2050 — secular population decline; favor cash flow + early exit over multi-decade hold.
- By year 2, paydown + projected appreciation supports a ~$43k cash-out refi (75% LTV) — recoverable capital for the next deal without selling this one.
Negotiation context
- It's been on market 39 days — a 3% lower offer ($242k) is reasonable based on typical stale-listing flexibility.
- 3 sale attempts since 12y ago with the ask held roughly flat each time — persistent listings suggest the price (not the market) is what's stuck; bring a comps-based counter.
- Current owner paid $80k; list at $249k implies a 212% gain — meaningful room to come down on a strong offer.
Questions for the listing agent
- What do current leases actually rent for vs. the listed asking? Can we see a recent rent roll and the last 12 months of T-12 income?
- It's been on market 39 days. Have you received any prior offers? Is the seller open to a 29% concession, seller financing, or rate buy-down credit?
- Is there a deadline driving the sale (1031 exchange, divorce, estate, relocation)? That informs how much negotiation room exists.
- Schools are F-rated, which usually means shorter tenancies and higher turnover. Who's the typical renter profile here, and what's been the actual vacancy rate?
- The area grade is low — what's the realistic commute time and amenity access for the typical tenant pool here? Any planned neighborhood developments (good or bad) we should know about?
- What's the average days-on-market for RENTAL listings here right now (not sales)? A rising rental-DOM trend means longer vacancies and softer asking-rent achievability than the comps imply.
- What's the recent tenant-quality profile in this submarket — average credit score on applications, eviction rate, late-payment / NSF rate, and stable-employment percentage? A property-management company in the area should have these aggregated.
- How much new for-sale + rental construction is in the pipeline within 1–3 miles? Heavy new supply typically softens prices + rents 12–24 months out; constrained supply supports both.
Investment metrics
- 1% rule
- 0.71% ✗
- Cap rate
- 4.86%
- Cash-on-cash
- -5.13%
- DSCR
- 0.77
- GRM
- 11.8
CMA / ARV
No comps found within radius.
Projected returns pro-forma
10.0% appreciation · 3.0% rent growth · sell at horizon
- IRR
- 20.6%
- Equity multiple
- 2.67×
- Total profit
- $116,630
- Equity at exit
- $224,319
- IRR
- 18.8%
- Equity multiple
- 6.14×
- Total profit
- $358,408
- Equity at exit
- $483,752
Cash invested: $69,720 (down + closing). Projections, not guarantees.
Landlord ↔ Tenant lean methodology
- Overall (STATE)
- 15 Strongly Tenant-Friendly
- State New York
- 15 Strongly Tenant-Friendly · D+10
- County
- — inherits STATE
- City
- — inherits STATE
ZIP-level market 12747
- Home prices YoY
- 3.2%
- Active inventory
- 21
- Price-to-rent
- 11.8×
Monthly cashflow live
- Estimated rent
- $1,765 medium interval (Pro) →
- Mortgage (P&I)
- −$1,306
- Tax from tax record
- −$283 /mo · $3,393/yr
- Insurance
- −$104
- HOA
- −$0
- Vacancy / Maint / Mgmt
- −$371
- Net cashflow
- $-298
Break-even live
Sensitivity live
| Price | -10% $-157 | -5% $-228 | +0% $-298 | +5% $-369 | +10% $-439 |
|---|---|---|---|---|---|
| Rent | -10% $-438 | -5% $-368 | +0% $-298 | +5% $-228 | +10% $-159 |
| Rate | -1.0pp $-173 | -0.5pp $-235 | base $-298 | +0.5pp $-363 | +1.0pp $-428 |
UW: 25.0% down · 7.5% · 30yr · 1.5% tax · 5.0% vac · 8.0% maint · 8.0% mgmt
Financing live
Cash to close
- Down payment
- $62,250
- Closing costs
- $7,470
- Reserves months
- —
- Total cash needed
- —
Loan-product check · same deal, 3 products live
Conventional
25% down · 7.5% · 30yr
- Down + closing
- —
- Monthly P&I
- —
- Monthly cashflow
- —
- DSCR
- —
- Eligible?
- —
Personal DTI + credit; lowest rate.
DSCR
20% down · 8.5% · 30yr
- Down + closing
- —
- Monthly P&I
- —
- Monthly cashflow
- —
- DSCR
- —
- Eligible?
- —
No personal income docs; deal must DSCR.
Hard money
10% down · 12.0% · 12mo
- Down + closing
- —
- Monthly P&I
- —
- Monthly cashflow
- —
- DSCR
- —
- Eligible?
- —
Short-term bridge; refi at stabilization.
Listing history 22 events
-
2026-06-21days on market $249,000 Active 39 DOM
-
2026-06-21days on market $249,000 Active 38 DOM
-
2026-06-18days on market $249,000 Active 36 DOM
-
2026-06-17days on market $249,000 Active 35 DOM
-
2026-06-16days on market $249,000 Active 34 DOM
-
2026-06-15days on market $249,000 Active 33 DOM
-
2026-06-13days on market $249,000 Active 31 DOM
-
2026-06-12days on market $249,000 Active 30 DOM
-
2026-06-09days on market $249,000 Active 27 DOM
-
2026-06-08days on market $249,000 Active 26 DOM
-
2026-06-07days on market $249,000 Active 25 DOM
-
2026-06-07days on market $249,000 Active 24 DOM
-
2026-06-04days on market $249,000 Active 21 DOM
-
2026-06-02days on market $249,000 Active 20 DOM
-
2026-06-01days on market $249,000 Active 19 DOM
-
2026-05-31days on market $249,000 Active 18 DOM
-
2026-05-13$249,000 Active 1282-char remark
-
2014-10-10historical
-
2014-10-10historical
-
2014-09-10
-
2014-09-10$129,000
-
2003-08-29soldstatus $79,900
ⓘ Source: listings_history table (triggers on properties + properties_extension) + one-shot
backfill from property_details.listing_events for pre-trigger history.
Tax reassessment forecast NY · Partial reset (capped growth)
- Current annual tax
- $3,393 · $283/mo
- Projected year-2 tax
- $3,801 · $317/mo
- Expected delta
- +$407/yr (+$34/mo · 12.0%)
ⓘ Screening estimate from a state-policy table — verify with the county assessor before closing.
Climate risk First Street
- Flood 1/10 Low FEMA zone X (unshaded) · 0% chance over 30 yrs
- Wildfire 1/10 Low
- Heat 2/10 Low 7 d/yr ≥91°F today · 16 d/yr by 30 yrs out
- Wind 2/10 Low 4% chance of damaging wind over 30 yrs
- Air quality 2/10 Low 0 unhealthy d/yr today · 1 by 30 yrs out
Nearby sold comps map
Loading sold comps map…
Walkable amenities ~0.75 mi
Loading nearby amenities…
Taxation est. · year 1
- Rental income
- $21,177
- − Mortgage interest
- −$13,948
- − Property taxes
- −$3,393
- − Insurance
- −$1,245
- − Repairs & maintenance
- −$1,694
- − Management
- −$1,694
- − Depreciation
- −$7,244
- Taxable loss
- −$8,041
- Est. tax savings @ 24.0%
- +$1,930
- After-tax cash flow
- $-1,648/yr
For passive investors: Depreciation is non-cash, so a rental often shows a tax loss while cash-flowing — sheltering income. Rental losses are passive: they offset passive income freely, and up to $25,000/yr can offset ordinary (W-2) income if you actively participate and your MAGI is under $100k (phasing out to $0 by $150k); unused losses carry forward. On sale, claimed depreciation is recaptured at up to 25%, and gains may owe capital-gains tax (a 1031 exchange can defer both). Figures are a year-1 estimate at your 24.0% rate — not tax advice; consult a CPA.
Schools (NCES district)
- District
- Tri-Valley Central School District
- NCES district ID
- 3628890
- Math proficiency
- 38% ▼ -10.00%
- Reading proficiency
- 46% ▲ 2.00%
- Median HH income
- $53,543
- Composite
- 36.47/100
- National rank
- #4662
- State rank
- #488 of 590 in NY
Livability — Loch Sheldrake
- Score
- 63/100
- State rank
- #793
- US rank
- #15202
Category grades
Schools grade is shown separately in the Schools card above.
Census & demographics
- City population
- 2,036
- Population (ZIP)
- 2,036
Population outlook (Sullivan County) Hauer SSP2
- Today (2025)
- 68,974 people
- By 2030
- 65,609 · -4.9%
- By 2040
- 58,878 · -14.6%
- By 2050
- 52,500 · -23.9%
- By 2075
- 39,941 · -42.1%
- By 2100
- 28,880 · -58.1%
Race, ethnicity, and origin ACS 2023
- Neighborhood character
- Predominantly White (75%)
- Race & ethnicity
- White 75% Hispanic / Latino 12% Two or more races 11% Black 8% Asian 2%
- Hispanic origin (detail)
- Puerto Rican 5%
- Common ancestry
- Romanian 14% Lithuanian 10% Scotch-Irish 5%
- Foreign-born
- 7% · Canada
- Languages at home
- 88% English-only · Spanish 10% Chinese 1%
Political lean MEDSL · Sullivan
- 2024 margin
- R (+16.7) · D 41.6% · R 58.4%
- 2008→2024 swing
- -26.2pp toward R · 2008: 9.5pp · 2024: -16.7pp
- All cycles
- 2024: R+16.7 2020: R+9.2 2016: R+13.7 2012: D+10.4 2008: D+9.5
Not yet ingested
- Civics
- —
Market trends
- HPI YoY
- ▲ 15.46%
- Current HPI
- 504.332
- Rent YoY
- —
- Metro
- —
- State GDP YoY
- ▲ 2.60%
- F500 in state
- 92
Industry mix (Fortune 500 HQ in NY)
| Industry | F500 HQs | Revenue |
|---|---|---|
| Financial Services | 10 | $950B |
|
||
| Consumer Goods | 9 | $162B |
|
||
| Insurance | 4 | $225B |
|
||
| Telecommunications | 2 | $144B |
|
||
| Pharmaceuticals | 2 | $112B |
|
||
| Media / Entertainment | 2 | $69B |
|
||
Price history
+211.6% since first listed6 events — show timeline
- 2026-05-13 Listed $249,000 OneKey® MLS as Distributed by MLS Grid
- 2014-10-10 Listing Removed — OneKey® MLS as Distributed by MLS Grid
- 2014-10-10 Delisted — HGMLS
- 2014-09-10 Listed $129,000 OneKey® MLS as Distributed by MLS Grid
- 2014-09-10 Listed — HGMLS
- 2003-08-29 Sold (Public Records) $79,900 Public Records
Property tax history
+1.7%/yrLatest (2025): $3,393 · +2.4% YoY. Source: county tax records.
Cash-flow waterfall
monthlySold comps — $/sqft
last 12 mo · ≤1 miLoading sold comps…