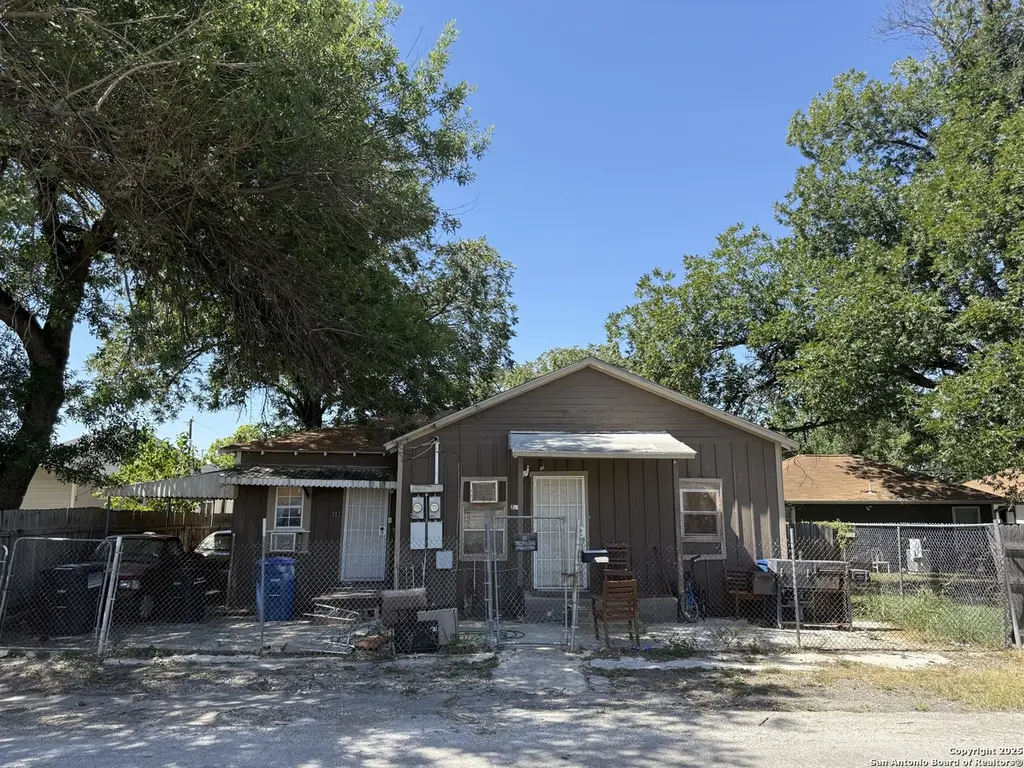
215 Gulf · San Antonio, TX
Flood risk 1/10 · Minimal
- FEMA flood zone
- X (unshaded)
- Chance of flooding over 30 yrs
- 0.0%
- Est. flood insurance / yr
- $507 – $1,088
Fire risk 1/10 · Minimal
- Est. fire insurance / yr
- $1,222 – $2,270
Heat risk 8/10 · Major
- Hot days now (above 108°F)
- 7 days/yr
- Hot days in 30 yrs
- 22 days/yr
Wind risk 8/10 · Major
- Chance of severe wind over 30 yrs
- 80.0%
Air-quality risk 2/10 · Minimal
- Unhealthy air days now
- 1 days/yr
- Unhealthy air days in 30 yrs
- 2 days/yr
Risk factors via First Street. Map © Google.
Why this score? — see what drove the C+ grade
The composite is a weighted blend of 9 inputs, each scored 0–100. Each bar is that input's sub-score; the figure is the points it added to the 100-point composite (weight × sub-score).
- Cash flow +17.8/30.0
- ARV discount +13.0/15.0
- Appreciation +10.0/10.0
- DSCR +5.6/10.0
- 1% rule +4.9/10.0
- Rent growth +4.5/5.0
- Livability +4.0/5.0
- Condition / age +2.5/5.0
- Schools +1.4/10.0
$125,000
🖨 Deal sheet 📄 Offer letter ✓ Due diligence
Listing remarks MLS
Great Investment Opportunity for INVESTORS!! Could be a duplex and or one house. One side of the house has 1 bedroom, 1 bath and kitchen. Other side as well.
Key facts
- 2,308 sq ft lot
- Built 1940
- Listed 250 days
Neighborhood map
What this means for you Summary
Snapshot
- This is a 2-bed/1.0-bath single-family listed at $125k.
Deal economics
- At list price, monthly cash flow is $103 ($1k/yr) — positive.
- The deal already cash-flows at list — no discount required.
- To meet the 1% rule (rent ≥ 1% of price), the offer needs to be $123k (1.2% below list).
- Recommended offer: $110k (12.0% below list) — sets the bar for market timing.
- Cap rate 7.3% vs local median 3.8% in San Antonio — top-decile yield for the area; either an underpriced asset or a hidden risk that comps aren't pricing in. Stress-test before assuming the spread holds.
Location & tenants
- Location reads 80/100 on livability (#31 in TX, #1,616 nationally) — a professional / high-income tenant draw. Strengths: amenities A+, commute A+, cost of living A+; Watch: schools C-, crime F.
- San Antonio ISD (urban): math 12% / reading 22% proficiency, ranked #805 of 826 in TX (top 98%) — low school quality limits family demand, transient renter base, plan for 1-2y turnover; 80% free/reduced lunch — lower-income household profile, screen leases tightly.
- Market conditions: Rents rising fast (+8.2%/yr); 196 active listings in the ZIP; 40 comparable units currently listed for rent nearby; rentals at typical pace (median 24d on market — plan ~3-4 weeks tenant-placement turnaround); 48% of comp listings sitting > 30 days — soft ceiling on asking rent; 8,308 units permitted in Bexar County in 2024 (2,506 in 5+ unit buildings).
- This rent runs 31% of the median local income ($47k/yr) — at the standard rent-burdened threshold; future hikes will face affordability resistance.
Forward outlook
- In year one you build about $13k of equity ($864 loan paydown + $12k appreciation (10.0% local appreciation)).
- Bexar County population projected at +50% by 2050 — long-run rental-demand tailwind backs the buy-and-hold thesis.
- At projected returns (10.0% appreciation + 8.0% rent growth), your $35k cash investment doubles in ~3 years — after that, you're playing with house money.
- By year 3, paydown + projected appreciation supports a ~$34k cash-out refi (75% LTV) — recoverable capital for the next deal without selling this one.
Negotiation context
- It's been on market 250 days — a 12% lower offer ($110k) is reasonable based on typical stale-listing flexibility.
Risks & watch-outs
- Watch-outs: built in 1940 — expect roof / HVAC / electrical / plumbing capex.
- Climate carrying-cost: severe wind risk, 80% chance of damaging wind over 30y; extreme-heat days projected 7→22/yr by 2055 (HVAC capex compounding) — expect insurance premiums to compound above CPI over the hold.
Questions for the listing agent
- It's been on market 250 days. Have you received any prior offers? Is the seller open to a 12% concession, seller financing, or rate buy-down credit?
- Built in 1940 — when were the roof, HVAC, electrical panel, plumbing, and water heater last replaced?
- Why hasn't it sold? Are there any deal-killer items the seller is aware of (foundation, flood, title, zoning, code violations)?
- Is there a deadline driving the sale (1031 exchange, divorce, estate, relocation)? That informs how much negotiation room exists.
- Crime grade is F in this area — have there been break-ins, vandalism, or insurance claims at this property in the last 3 years? What carrier currently insures it and at what premium?
- What's the average days-on-market for RENTAL listings here right now (not sales)? A rising rental-DOM trend means longer vacancies and softer asking-rent achievability than the comps imply.
- What's the recent tenant-quality profile in this submarket — average credit score on applications, eviction rate, late-payment / NSF rate, and stable-employment percentage? A property-management company in the area should have these aggregated.
- How much new for-sale + rental construction is in the pipeline within 1–3 miles? Heavy new supply typically softens prices + rents 12–24 months out; constrained supply supports both.
Investment metrics
- 1% rule
- 0.99% ✗
- Cap rate
- 7.28%
- Cash-on-cash
- 3.52%
- DSCR
- 1.16
- GRM
- 8.4
CMA / ARV
- ARV (median comp)
- $142,360
- List price
- $125,000
- Delta
- -12.19%
- Verdict
- UNDERPRICED
- Comps
- 20 within 1.0 mi
Show comp detail 12 sales within ~0.75 mi
| Address | Dist | Beds/Ba | Sqft | Sold | Price | $/sf | Match |
|---|---|---|---|---|---|---|---|
| 1607 Hays | 0.43mi | 2/1.0 | 892 (+3%) | 0mo | $145,000 | $163 | 74 |
| 401 Canton | 0.26mi | 2/1.0 | 808 (-6%) | 8mo | $65,000 | $80 | 70 |
| 151 Canton | 0.12mi | 2/1.0 | 744 (-14%) | 2mo | $130,000 | $175 | 69 |
| 1531 Burnet | 0.29mi | 2/2.0 | 913 (+6%) | 7mo | $215,000 | $235 | 67 |
| 426 N Monumental St | 0.31mi | 2/1.5 | 960 (+11%) | 2mo | $209,000 | $218 | 63 |
| 122 Belmont | 0.43mi | 3/1.0 (+1) | 902 (+4%) | 6mo | $95,000 | $105 | 63 |
| 1046 Paso Hondo | 0.41mi | 2/1.0 | 953 (+10%) | 3mo | $140,000 | $147 | 62 |
| 1206 Nolan | 0.18mi | 2/1.0 | 987 (+14%) | 9mo | $145,000 | $147 | 61 |
| 342 Canton | 0.25mi | 2/1.0 | 990 (+15%) | 5mo | $130,000 | $131 | 60 |
| 418 Muncey | 0.42mi | 2/1.0 | 936 (+8%) | 8mo | $165,000 | $176 | 60 |
| 632 Canton | 0.60mi | 2/1.0 | 920 (+6%) | 10mo | $70,000 | $76 | 54 |
| 121 Boston | 0.49mi | 2/1.0 | 752 (-13%) | 7mo | $89,000 | $118 | 50 |
Match score weights: distance 35% · size 25% · config 20% · recency 20%. Top-matched comps best support the ARV.
Projected returns pro-forma
10.0% appreciation · 8.0% rent growth · sell at horizon
- IRR
- 28.8%
- Equity multiple
- 3.32×
- Total profit
- $81,167
- Equity at exit
- $112,610
- IRR
- 26.6%
- Equity multiple
- 8.15×
- Total profit
- $250,095
- Equity at exit
- $242,848
Cash invested: $35,000 (down + closing). Projections, not guarantees.
Landlord ↔ Tenant lean methodology
- Overall (STATE)
- 87 Strongly Landlord-Friendly
- State Texas
- 87 Strongly Landlord-Friendly · R+5
- County
- — inherits STATE
- City
- — inherits STATE
ZIP-level market 78202
- Home prices YoY
- 27.0%
- Rents YoY
- 8.2%
- Active inventory
- 196
- Price-to-rent
- 8.4×
Monthly cashflow live
- Estimated rent
- $1,235 high interval (Pro) →
- Mortgage (P&I)
- −$656
- Tax from tax record
- −$165 /mo · $1,982/yr
- Insurance
- −$52
- HOA
- −$0
- Vacancy / Maint / Mgmt
- −$259
- Net cashflow
- $103
Break-even live
UW: 25.0% down · 7.5% · 30yr · 1.5% tax · 5.0% vac · 8.0% maint · 8.0% mgmt
Financing live
Cash to close
- Down payment
- $31,250
- Closing costs
- $3,750
- Reserves months
- —
- Total cash needed
- —
Loan-product check · same deal, 3 products live
Conventional
25% down · 7.5% · 30yr
- Down + closing
- —
- Monthly P&I
- —
- Monthly cashflow
- —
- DSCR
- —
- Eligible?
- —
Personal DTI + credit; lowest rate.
DSCR
20% down · 8.5% · 30yr
- Down + closing
- —
- Monthly P&I
- —
- Monthly cashflow
- —
- DSCR
- —
- Eligible?
- —
No personal income docs; deal must DSCR.
Hard money
10% down · 12.0% · 12mo
- Down + closing
- —
- Monthly P&I
- —
- Monthly cashflow
- —
- DSCR
- —
- Eligible?
- —
Short-term bridge; refi at stabilization.
Rent comps 40 comps
| Address | Beds | Baths | Sqft | Rent | $/sqft | DOM | Units | Dist |
|---|---|---|---|---|---|---|---|---|
| 103 Saint John San Antonio, TX | 2.0 | 1.0 | 943 | $1,245 | $1.32 | 44d | 1 | 0.05mi |
| 103 Saint Charles Unit NA San Antonio, TX | 2.0 | 2.0 | 995 | $1,300 | $1.31 | 44d | 1 | 0.10mi |
| 155 Canton San Antonio, TX | 2.0 | 2.0 | 1078 | $1,250 | $1.16 | 24d | 1 | 0.11mi |
| 1615 Nolan St San Antonio, TX | 1.0 | 1.0 | 978 | $1,200 | $1.23 | 11d | 1 | 0.18mi |
| 1615 Nolan St Unit A San Antonio, TX | 2.0 | 1.0 | 1066 | $1,400 | $1.31 | 11d | 1 | 0.18mi |
| 1619 Nolan St Unit B San Antonio, TX | 2.0 | 1.0 | 600 | $1,050 | $1.75 | 24d | 1 | 0.19mi |
| 721 Potomac San Antonio, TX | 1.0 | 1.0 | 914 | $1,100 | $1.20 | 24d | 1 | 0.21mi |
| 622 Potomac St San Antonio, TX | 1.0 | 1.0 | 700 | $975 | $1.39 | 44d | 1 | 0.22mi |
| 620 Potomac San Antonio, TX | 2.0 | 1.0 | 900 | $1,050 | $1.17 | 22d | 1 | 0.22mi |
| 2023 Beaver Ln San Antonio, TX | 1.0 | 1.0 | 600 | $960 | $1.60 | 44d | 1 | 0.23mi |
| 438 Gulf St San Antonio, TX | 2.0 | 1.0 | 799 | $975 | $1.22 | 15d | 1 | 0.33mi |
| 203 Gorman San Antonio, TX | 1.0 | 1.0 | 578 | $745 | $1.29 | 44d | 1 | 0.34mi |
| 1101 Gibbs San Antonio, TX | 3.0 | 1.0 | 1100 | $1,345 | $1.22 | 24d | 1 | 0.37mi |
| 1101 Gibbs San Antonio, TX | 3.0 | 1.0 | 1100 | $1,345 | $1.22 | 15d | 1 | 0.37mi |
| 1323 Lamar St #1 San Antonio, TX | 2.0 | 1.0 | 900 | $999 | $1.11 | 44d | 1 | 0.43mi |
| 1411 Lamar St San Antonio, TX | 2.0 | 1.0 | 700 | $1,125 | $1.61 | 44d | 1 | 0.45mi |
| 1810 Burnet St San Antonio, TX | 2.0 | 1.0 | 620 | $1,045 | $1.69 | 15d | 1 | 0.48mi |
| 146 Eross San Antonio, TX | 2.0 | 1.0 | 696 | $900 | $1.29 | 16d | 1 | 0.49mi |
| 732 Lamar St Unit 1 San Antonio, TX | 1.0 | 1.0 | 1100 | $1,550 | $1.41 | 44d | 1 | 0.50mi |
| 323 Gabriel Unit 1 201 San Antonio, TX | 2.0 | 2.5 | 1000 | $1,375 | $1.38 | 44d | 1 | 0.54mi |
| 323 Gabriel San Antonio, TX | 2.0 | 2.0 | 1000 | $1,375 | $1.38 | 24d | 1 | 0.54mi |
| 1617 E Commerce St San Antonio, TX | 1.0 | 1.0 | 844 | $814 | $0.96 | 44d | 1 | 0.55mi |
| 308 Belmont San Antonio, TX | 1.0 | 1.0 | 700 | $850 | $1.21 | 24d | 1 | 0.58mi |
| 210 Piedmont Ave Unit 101 San Antonio, TX | 2.0 | 2.5 | 1050 | $1,395 | $1.33 | 44d | 1 | 0.60mi |
| 1017 N Mittman St San Antonio, TX | 1.0 | 1.0 | 726 | $910 | $1.25 | 44d | 1 | 0.61mi |
| 639 Canton San Antonio, TX | 2.0 | 1.0 | 1008 | $1,295 | $1.28 | 44d | 1 | 0.62mi |
| 628 Sherman Unit 2 San Antonio, TX | 1.0 | 1.0 | 675 | $995 | $1.47 | 44d | 1 | 0.65mi |
| 313 Toledo San Antonio, TX | 2.0 | 1.0 | 924 | $1,400 | $1.52 | 11d | 1 | 0.67mi |
| 118 Glorietta San Antonio, TX | 1.0 | 1.0 | 913 | $1,600 | $1.75 | 4d | 1 | 0.67mi |
| 706 Canton San Antonio, TX | 2.0 | 1.0 | 994 | $1,545 | $1.55 | 24d | 1 | 0.68mi |
| 1223 N Walters St Unit 610 San Antonio, TX | 1.0 | 1.0 | 732 | $877 | $1.20 | 3d | 1 | 0.68mi |
| 1223 N Walters St Unit 710 San Antonio, TX | 2.0 | 2.0 | 970 | $1,047 | $1.08 | 3d | 1 | 0.68mi |
| 1414 Gorman San Antonio, TX | 2.0 | 1.0 | 900 | $1,175 | $1.31 | 44d | 1 | 0.69mi |
| 710 Poinsettia San Antonio, TX | 2.0 | 1.0 | 708 | $1,195 | $1.69 | 44d | 1 | 0.69mi |
| 630 Montana St Unit 202 San Antonio, TX | 1.0 | 1.0 | 969 | $1,950 | $2.01 | 24d | 1 | 0.69mi |
| 630 Montana St Unit 201 San Antonio, TX | 1.0 | 1.5 | 1060 | $1,950 | $1.84 | 44d | 1 | 0.69mi |
| 2118 Burnet St San Antonio, TX | 3.0 | 2.0 | 1008 | $1,650 | $1.64 | 3d | 1 | 0.72mi |
| 1205 Wyoming St San Antonio, TX | 2.0 | 2.0 | 1114 | $2,300 | $2.06 | 44d | 1 | 0.72mi |
| 1510 Gorman San Antonio, TX | 2.0 | 1.0 | 996 | $1,300 | $1.31 | 18d | 1 | 0.73mi |
| 1218 Wyoming St Unit 1 San Antonio, TX | 1.0 | 1.0 | 744 | $1,299 | $1.75 | 44d | 1 | 0.75mi |
Listing history 17 events
-
2026-06-18days on market $125,000 Active 250 DOM
-
2026-06-17days on market $125,000 Active 249 DOM
-
2026-06-16days on market $125,000 Active 248 DOM
-
2026-06-15days on market $125,000 Active 247 DOM
-
2026-06-13days on market $125,000 Active 245 DOM
-
2026-06-09days on market $125,000 Active 241 DOM
-
2026-06-08days on market $125,000 Active 240 DOM
-
2026-06-07days on market $125,000 Active 239 DOM
-
2026-06-04days on market $125,000 Active 236 DOM
-
2026-06-03days on market $125,000 Active 235 DOM
-
2026-06-02days on market $125,000 Active 234 DOM
-
2026-06-01days on market $125,000 Active 233 DOM
-
2026-05-31days on market $125,000 Active 232 DOM
-
2025-10-11$125,000 New 158-char remark
Show marketing remark (158 chars)
Great Investment Opportunity for INVESTORS!! Could be a duplex and or one house. One side of the house has 1 bedroom, 1 bath and kitchen. Other side as well.
-
2025-03-03soldstatus
-
2025-03-03soldstatus
-
1998-05-26soldstatus
ⓘ Source: listings_history table (triggers on properties + properties_extension) + one-shot
backfill from property_details.listing_events for pre-trigger history.
Tax reassessment forecast TX · Resets to sale price
- Current annual tax
- $1,982 · $165/mo
- Projected year-2 tax
- $2,288 · $191/mo
- Expected delta
- +$305/yr (+$25/mo · 15.4%)
ⓘ Screening estimate from a state-policy table — verify with the county assessor before closing.
Climate risk First Street
- Flood 1/10 Low FEMA zone X (unshaded) · 0% chance over 30 yrs
- Wildfire 1/10 Low
- Heat 8/10 Severe 7 d/yr ≥108°F today · 22 d/yr by 30 yrs out
- Wind 8/10 Severe 80% chance of damaging wind over 30 yrs
- Air quality 2/10 Low 1 unhealthy d/yr today · 2 by 30 yrs out
Nearby sold comps map
Loading sold comps map…
Walkable amenities ~0.75 mi
Loading nearby amenities…
Taxation est. · year 1
- Rental income
- $14,817
- − Mortgage interest
- −$7,002
- − Property taxes
- −$1,982
- − Insurance
- −$625
- − Repairs & maintenance
- −$1,185
- − Management
- −$1,185
- − Depreciation
- −$3,636
- Taxable loss
- −$799
- Est. tax savings @ 24.0%
- +$192
- After-tax cash flow
- $1,424/yr
For passive investors: Depreciation is non-cash, so a rental often shows a tax loss while cash-flowing — sheltering income. Rental losses are passive: they offset passive income freely, and up to $25,000/yr can offset ordinary (W-2) income if you actively participate and your MAGI is under $100k (phasing out to $0 by $150k); unused losses carry forward. On sale, claimed depreciation is recaptured at up to 25%, and gains may owe capital-gains tax (a 1031 exchange can defer both). Figures are a year-1 estimate at your 24.0% rate — not tax advice; consult a CPA.
Schools (NCES district)
- District
- San Antonio ISD
- NCES district ID
- 4838730
- Math proficiency
- 12% ▼ -21.00%
- Reading proficiency
- 22% ▼ -7.00%
- Median HH income
- $30,952
- Composite
- 13.57/100
- National rank
- #9512
- State rank
- #805 of 826 in TX
Livability — San Antonio
- Score
- 80/100
- State rank
- #31
- US rank
- #1616
Category grades
Schools grade is shown separately in the Schools card above.
Census & demographics
- Census place
- San Antonio, TX
- County
- Bexar County · 1,990,555 people
- City population
- 1,806,925
- Metro
- San Antonio-New Braunfels, TX
- Population (ZIP)
- 10,224
- Household income
- $47,478
- Rent vs Own
- Severe rent burden
- 543.0
Population outlook (Bexar County) Hauer SSP2
- Today (2025)
- 2,336,851 people
- By 2030
- 2,560,728 · +9.6%
- By 2040
- 3,020,569 · +29.3%
- By 2050
- 3,493,522 · +49.5%
- By 2075
- 4,668,459 · +99.8%
- By 2100
- 5,533,242 · +136.8%
Race, ethnicity, and origin ACS 2023
- Neighborhood character
- Predominantly Hispanic (66%)
- Race & ethnicity
- Hispanic / Latino 66% Two or more races 28% White 17% Black 16% Native American 1%
- Hispanic origin (detail)
- Mexican 57% Puerto Rican 1% Cuban 1%
- Common ancestry
- Italian 2% Slovak 1%
- Foreign-born
- 14% · Canada
- Languages at home
- 59% English-only · Spanish 41%
Political lean MEDSL · Bexar
- 2024 margin
- Lean D (+9.8) · D 54.3% · R 44.6% · Other 1.1%
- 2008→2024 swing
- +4.2pp toward D · 2008: 5.6pp · 2024: 9.8pp
- All cycles
- 2024: D+9.8 2020: D+18.2 2016: D+13.5 2012: D+4.6 2008: D+5.6
Not yet ingested
- Civics
- —
Market trends
- HPI YoY
- ▲ 53.82%
- Current HPI
- 253.3196
- Rent YoY
- ▲ 8.20%
- Metro
- San Antonio-New Braunfels, TX
- State GDP YoY
- ▲ 3.95%
- F500 in state
- 110
Industry mix (Fortune 500 HQ in TX)
| Industry | F500 HQs | Revenue |
|---|---|---|
| Energy | 16 | $1,198B |
|
||
| Technology | 5 | $198B |
|
||
| Engineering / Construction | 4 | $72B |
|
||
| Energy Services | 3 | $60B |
|
||
| Utilities | 3 | $41B |
|
||
| Healthcare | 2 | $330B |
|
||
Price history
4 events — show timeline
- 2025-10-11 Listed $125,000 LERA
- 2025-03-03 Sold (Public Records) — Public Records
- 2025-03-03 Sold (Public Records) — Public Records
- 1998-05-26 Sold (Public Records) — Public Records
Property tax history
+9.5%/yrLatest (2025): $1,982 · +0.0% YoY. Source: county tax records.
Cash-flow waterfall
monthlySold comps — $/sqft
last 12 mo · ≤1 miLoading sold comps…