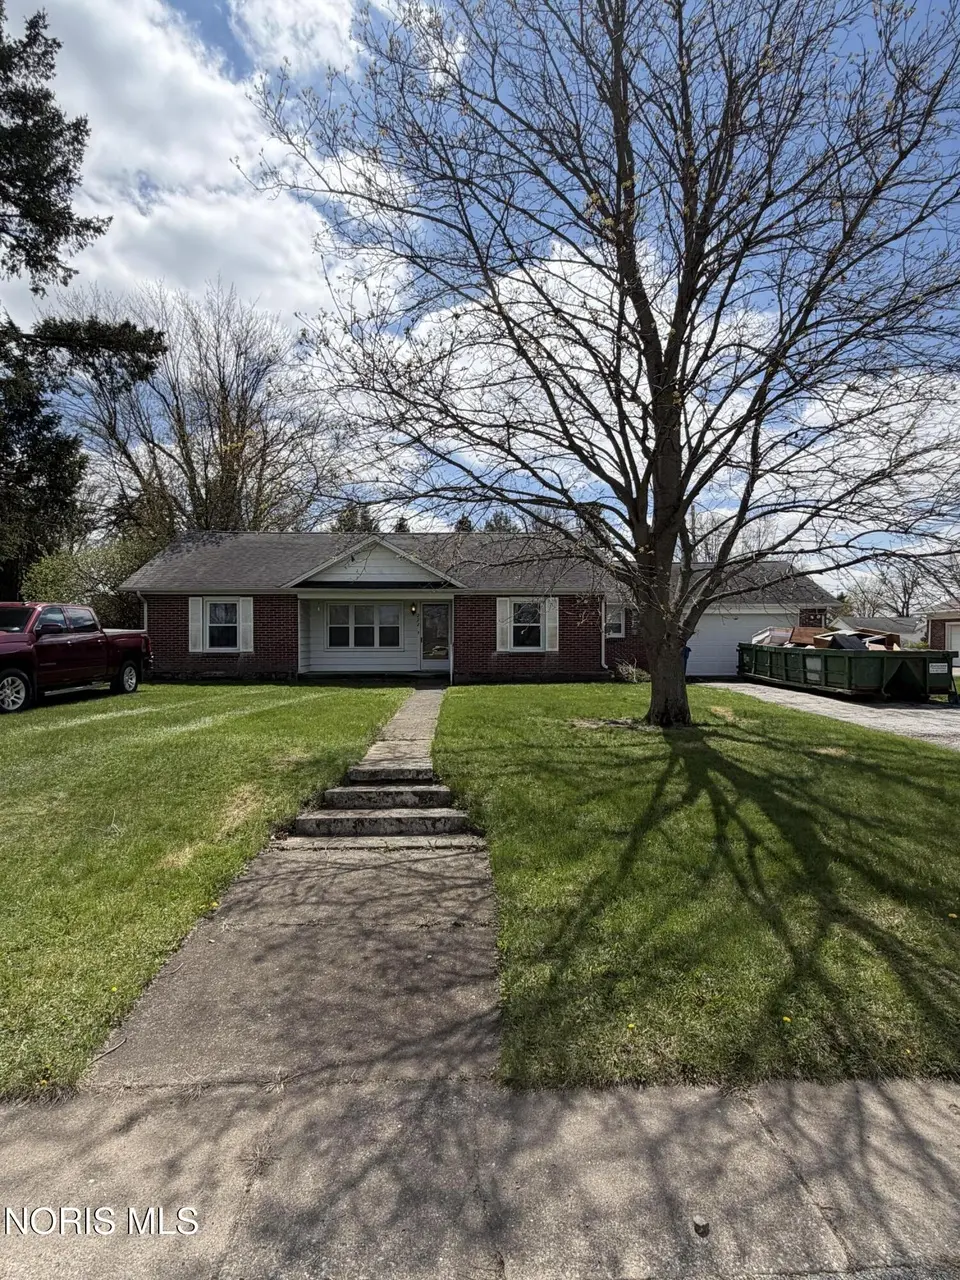
222 High St · North Baltimore, OH
Flood risk 1/10 · Minimal
- FEMA flood zone
- X (unshaded)
- Chance of flooding over 30 yrs
- 0.0%
- Est. flood insurance / yr
- $507 – $1,088
Fire risk 1/10 · Minimal
- Est. fire insurance / yr
- $713 – $1,323
Heat risk 3/10 · Minor
- Hot days now (above 99°F)
- 7 days/yr
- Hot days in 30 yrs
- 17 days/yr
Wind risk 2/10 · Minimal
- Chance of severe wind over 30 yrs
- —
Air-quality risk 2/10 · Minimal
- Unhealthy air days now
- 1 days/yr
- Unhealthy air days in 30 yrs
- 2 days/yr
Risk factors via First Street. Map © Google.
Why this score? — see what drove the C grade
The composite is a weighted blend of 9 inputs, each scored 0–100. Each bar is that input's sub-score; the figure is the points it added to the 100-point composite (weight × sub-score).
- Cash flow +16.9/30.0
- ARV discount +15.0/15.0
- DSCR +5.3/10.0
- 1% rule +5.0/10.0
- Schools +4.4/10.0
- Livability +3.9/5.0
- Rent growth +2.5/5.0
- Condition / age +2.5/5.0
- Appreciation +0.0/10.0
$119,900
🖨 Deal sheet 📄 Offer letter ✓ Due diligence
Listing remarks MLS
FOR COMPARISON PURPOSES ONLY.
Key facts
- 0.47 acre lot
- 4 garage spots
- Built 1950
Neighborhood map
What this means for you Summary
Snapshot
- This is a 2-bed/1.0-bath single-family listed at $120k.
Deal economics
- At list price, monthly cash flow is $79 ($951/yr) — positive.
- The deal already cash-flows at list — no discount required.
- To meet the 1% rule (rent ≥ 1% of price), the offer needs to be $119k (0.3% below list).
- Recommended offer: $119k (0.3% below list) — sets the bar for 1% rule.
Location & tenants
- Location reads 78/100 on livability (#159 in OH, #2,395 nationally) — a middle-class / working-renter tenant base. Strengths: cost of living A+, housing A+, health & safety A+; Watch: amenities F, commute F.
- North Baltimore Local (town): math 45% / reading 58% proficiency, ranked #424 of 656 in OH (top 65%) — acceptable for families but not a draw, mixed tenant base, ~2y average lease.
- Zoned schools: E A Powell Elementary School (math 47% / reading 57%, grade C-, #851 of 1,584 statewide, top 56%, 367 students, 46% FRL); North Baltimore Middle School (math 52% / reading 57%, grade B-, #342 of 654 statewide, top 54%, 95 students, 0% FRL); North Baltimore High School (math 34% / reading 74%, grade C-, #303 of 781 statewide, top 42%, 136 students, 84% FRL) — zoned schools at 43% FRL track the district average.
- Market conditions: 32 active listings in the ZIP; 493 units permitted in Wood County in 2024 (48 in 5+ unit buildings).
Forward outlook
- Local home prices are declining (-3.0%/yr); year-one equity from $829 of loan paydown is wiped out by about $4k of value loss. Plan a longer hold.
- Wood County population projected at +14% by 2050 — modest demand growth; plan on rents tracking national, not racing it.
Negotiation context
- Only 4 days on market — expect competitive offers; lowballing is unlikely to land.
- 3 sale attempts since 26y ago with the ask held roughly flat each time — persistent listings suggest the price (not the market) is what's stuck; bring a comps-based counter.
- Current owner paid $98k; 23% above their basis — modest negotiation headroom, anchor on the comps not their cost.
Risks & watch-outs
- Watch-outs: built in 1950 — expect roof / HVAC / electrical / plumbing capex.
Questions for the listing agent
- Built in 1950 — when were the roof, HVAC, electrical panel, plumbing, and water heater last replaced?
- Is there a deadline driving the sale (1031 exchange, divorce, estate, relocation)? That informs how much negotiation room exists.
- Schools are B-rated — typically a magnet for longer-tenancy family renters. What's the average tenant stay here, and is there a school-zone premium baked into asking?
- What's the average days-on-market for RENTAL listings here right now (not sales)? A rising rental-DOM trend means longer vacancies and softer asking-rent achievability than the comps imply.
- What's the recent tenant-quality profile in this submarket — average credit score on applications, eviction rate, late-payment / NSF rate, and stable-employment percentage? A property-management company in the area should have these aggregated.
- How much new for-sale + rental construction is in the pipeline within 1–3 miles? Heavy new supply typically softens prices + rents 12–24 months out; constrained supply supports both.
Investment metrics
- 1% rule
- 1.00% ✗
- Cap rate
- 7.09%
- Cash-on-cash
- 2.83%
- DSCR
- 1.13
- GRM
- 8.4
CMA / ARV
- ARV (on-the-fly)
- $194,432
- Comps found
- 12
Show comp detail 12 sales within ~0.75 mi
| Address | Dist | Beds/Ba | Sqft | Sold | Price | $/sf | Match |
|---|---|---|---|---|---|---|---|
| 222 High St | 0.00mi | 3/1.0 (+1) | 1,736 (0%) | 1mo | $151,000 | $87 | 94 |
| 300 W Water St | 0.41mi | 3/2.0 (+1) | 1,640 (-6%) | 6mo | $141,999 | $87 | 58 |
| 201 Briar Hill Rd | 0.34mi | 2/2.0 | 1,532 (-12%) | 6mo | $242,900 | $159 | 56 |
| 201 W Broadway St | 0.56mi | 3/2.0 (+1) | 1,703 (-2%) | 12mo | $175,000 | $103 | 52 |
| 114 East St | 0.33mi | 3/2.0 (+1) | 1,536 (-12%) | 5mo | $172,000 | $112 | 52 |
| 206 Rudolph Rd | 0.73mi | 3/1.5 (+1) | 1,688 (-3%) | 8mo | $245,000 | $145 | 48 |
| 114 N Beecher St | 0.49mi | 3/1.0 (+1) | 1,478 (-15%) | 2mo | $45,000 | $30 | 45 |
| 504 W State St | 0.66mi | 3/1.5 (+1) | 1,612 (-7%) | 14mo | $180,000 | $112 | 39 |
| 221 Poplar St | 0.58mi | 3/1.0 (+1) | 1,520 (-12%) | 12mo | $185,000 | $122 | 37 |
| 115 Rhodes Ave | 0.68mi | 3/2.0 (+1) | 1,616 (-7%) | 16mo | $45,000 | $28 | 35 |
| 209 Rudolph Rd | 0.70mi | 3/2.0 (+1) | 1,518 (-13%) | 7mo | $218,500 | $144 | 32 |
| 801 E Broadway St | 0.71mi | 3/2.0 (+1) | 1,620 (-7%) | 19mo | $253,000 | $156 | 30 |
Match score weights: distance 35% · size 25% · config 20% · recency 20%. Top-matched comps best support the ARV.
Projected returns pro-forma
-3.0% appreciation · 3.0% rent growth · sell at horizon
- IRR
- -11.8%
- Equity multiple
- 0.57×
- Total profit
- $-14,343
- Equity at exit
- $17,877
- IRR
- -2.6%
- Equity multiple
- 0.83×
- Total profit
- $-5,828
- Equity at exit
- $10,367
Cash invested: $33,572 (down + closing). Projections, not guarantees.
Landlord ↔ Tenant lean methodology
- Overall (STATE)
- 73 Landlord-Friendly
- State Ohio
- 73 Landlord-Friendly · R+6
- County
- — inherits STATE
- City
- — inherits STATE
ZIP-level market 45872
- Home prices YoY
- -11.5%
- Active inventory
- 32
- Price-to-rent
- 8.4×
Monthly cashflow live
- Estimated rent
- $1,195 medium interval (Pro) →
- Mortgage (P&I)
- −$629
- Tax from tax record
- −$186 /mo · $2,232/yr
- Insurance
- −$50
- HOA
- −$0
- Vacancy / Maint / Mgmt
- −$251
- Net cashflow
- $79
Break-even live
UW: 25.0% down · 7.5% · 30yr · 1.5% tax · 5.0% vac · 8.0% maint · 8.0% mgmt
Financing live
Cash to close
- Down payment
- $29,975
- Closing costs
- $3,597
- Reserves months
- —
- Total cash needed
- —
Loan-product check · same deal, 3 products live
Conventional
25% down · 7.5% · 30yr
- Down + closing
- —
- Monthly P&I
- —
- Monthly cashflow
- —
- DSCR
- —
- Eligible?
- —
Personal DTI + credit; lowest rate.
DSCR
20% down · 8.5% · 30yr
- Down + closing
- —
- Monthly P&I
- —
- Monthly cashflow
- —
- DSCR
- —
- Eligible?
- —
No personal income docs; deal must DSCR.
Hard money
10% down · 12.0% · 12mo
- Down + closing
- —
- Monthly P&I
- —
- Monthly cashflow
- —
- DSCR
- —
- Eligible?
- —
Short-term bridge; refi at stabilization.
Listing history 11 events
-
2026-04-21status Pending
-
2026-04-17$119,900 Active
-
2026-04-13historical $119,900
-
2025-10-09price $97,500 29-char remark
Show marketing remark (29 chars)
FOR COMPARISON PURPOSES ONLY.
-
2005-08-22soldstatus $97,500
-
2005-08-15soldstatus $97,500 29-char remark
Show marketing remark (29 chars)
FOR COMPARISON PURPOSES ONLY.
-
2005-08-15$99,000 29-char remark
Show marketing remark (29 chars)
FOR COMPARISON PURPOSES ONLY.
-
2001-02-21historical
-
2000-08-25$104,900
-
1996-10-10soldstatus $72,000
-
1990-01-05soldstatus $67,000
ⓘ Source: listings_history table (triggers on properties + properties_extension) + one-shot
backfill from property_details.listing_events for pre-trigger history.
Tax reassessment forecast OH · Partial reset (capped growth)
- Current annual tax
- $2,232 · $186/mo
- Projected year-2 tax
- $2,232 · $186/mo
- Expected delta
- $0/yr ($0/mo · 0.0%)
ⓘ Screening estimate from a state-policy table — verify with the county assessor before closing.
Climate risk First Street
- Flood 1/10 Low FEMA zone X (unshaded) · 0% chance over 30 yrs
- Wildfire 1/10 Low
- Heat 3/10 Moderate 7 d/yr ≥99°F today · 17 d/yr by 30 yrs out
- Wind 2/10 Low
- Air quality 2/10 Low 1 unhealthy d/yr today · 2 by 30 yrs out
Nearby sold comps map
Loading sold comps map…
Walkable amenities ~0.75 mi
Loading nearby amenities…
Taxation est. · year 1
- Rental income
- $14,339
- − Mortgage interest
- −$6,716
- − Property taxes
- −$2,232
- − Insurance
- −$600
- − Repairs & maintenance
- −$1,147
- − Management
- −$1,147
- − Depreciation
- −$3,488
- Taxable loss
- −$991
- Est. tax savings @ 24.0%
- +$238
- After-tax cash flow
- $1,189/yr
For passive investors: Depreciation is non-cash, so a rental often shows a tax loss while cash-flowing — sheltering income. Rental losses are passive: they offset passive income freely, and up to $25,000/yr can offset ordinary (W-2) income if you actively participate and your MAGI is under $100k (phasing out to $0 by $150k); unused losses carry forward. On sale, claimed depreciation is recaptured at up to 25%, and gains may owe capital-gains tax (a 1031 exchange can defer both). Figures are a year-1 estimate at your 24.0% rate — not tax advice; consult a CPA.
Schools (NCES district)
- District
- North Baltimore Local
- NCES district ID
- 3905070
- Math proficiency
- 45% ▼ -21.00%
- Reading proficiency
- 58% ▼ -12.00%
- Median HH income
- $47,242
- Composite
- 43.72/100
- National rank
- #2951
- State rank
- #424 of 656 in OH
Livability — North Baltimore
- Score
- 78/100
- State rank
- #159
- US rank
- #2395
Category grades
Schools grade is shown separately in the Schools card above.
Census & demographics
- Census place
- North Baltimore, OH
- County
- Wood · 127,168 people
- City population
- 4,572
- Metro
- Toledo, OH
- Population (ZIP)
- 4,572
- Household income
- $62,380
- Rent vs Own
- Severe rent burden
- 3.8
Population outlook (Wood County) Hauer SSP2
- Today (2025)
- 138,744 people
- By 2030
- 143,189 · +3.2%
- By 2040
- 150,896 · +8.8%
- By 2050
- 158,589 · +14.3%
- By 2075
- 182,166 · +31.3%
- By 2100
- 196,533 · +41.7%
Race, ethnicity, and origin ACS 2023
- Neighborhood character
- Predominantly White (94%)
- Race & ethnicity
- White 94% Hispanic / Latino 4% Two or more races 2% Black 2%
- Common ancestry
- Iranian 4% Romanian 2% Slovak 1%
- Foreign-born
- 0%
- Languages at home
- 98% English-only · Spanish 2%
Political lean MEDSL · Wood
- 2024 margin
- R (+10.2) · D 44.4% · R 54.6%
- 2008→2024 swing
- -17.3pp toward R · 2008: 7.1pp · 2024: -10.2pp
- All cycles
- 2024: R+10.2 2020: R+7.6 2016: R+8.5 2012: D+4.2 2008: D+7.1
Not yet ingested
- Civics
- —
Market trends
- HPI YoY
- ▼ -29.19%
- Current HPI
- 225.1072
- Rent YoY
- —
- Metro
- —
- State GDP YoY
- ▲ 1.98%
- F500 in state
- 48
Industry mix (Fortune 500 HQ in OH)
| Industry | F500 HQs | Revenue |
|---|---|---|
| Insurance | 3 | $145B |
|
||
| Industrial Machinery | 3 | $49B |
|
||
| Financial Services | 3 | $24B |
|
||
| Consumer Goods | 2 | $93B |
|
||
| Aerospace / Defense | 2 | $47B |
|
||
| Utilities | 2 | $33B |
|
||
Price history
+79.0% since first listed11 events — show timeline
- 2026-04-21 Pending — NORIS
- 2026-04-17 Listed $119,900 NORIS
- 2026-04-13 Coming Soon $119,900 NORIS
- 2025-10-09 Price Changed $97,500 NORIS
- 2005-08-22 Sold (Public Records) $97,500 Public Records
- 2005-08-15 Listed $99,000 NORIS
- 2005-08-15 Sold (MLS) $97,500 NORIS
- 2001-02-21 Listing Removed — NORIS
- 2000-08-25 Listed $104,900 NORIS
- 1996-10-10 Sold (Public Records) $72,000 Public Records
- 1990-01-05 Sold (Public Records) $67,000 Public Records
Property tax history
+1.6%/yrLatest (2025): $2,232 · +1.1% YoY. Source: county tax records.
Cash-flow waterfall
monthlySold comps — $/sqft
last 12 mo · ≤1 miLoading sold comps…