 🌊 Lakefront
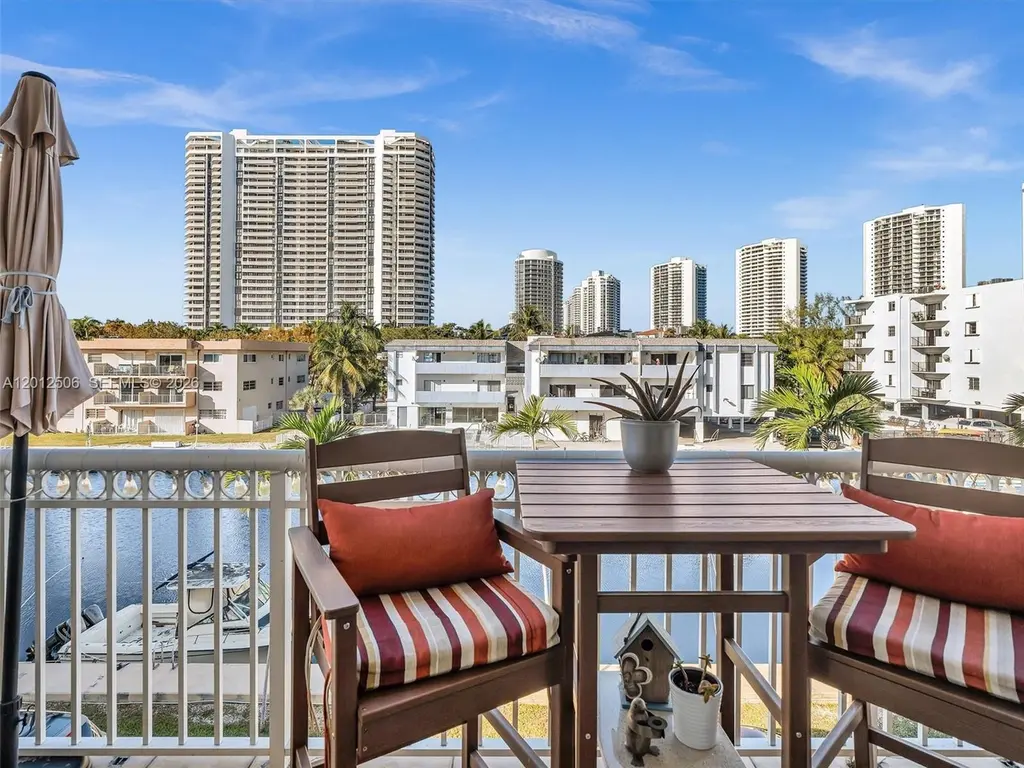
3601 NE 170th St Unit 301 - DOCK INCLUDED · North Miami Beach, FL
Flood risk 9/10 · Severe
- FEMA flood zone
- AE
- Chance of flooding over 30 yrs
- 0.99%
- Est. flood insurance / yr
- $1,737 – $8,500
Fire risk 1/10 · Minimal
- Est. fire insurance / yr
- $947 – $1,759
Heat risk 10/10 · Severe
- Hot days now (above 103°F)
- 7 days/yr
- Hot days in 30 yrs
- 27 days/yr
Wind risk 10/10 · Severe
- Chance of severe wind over 30 yrs
- 99.0%
Air-quality risk 2/10 · Minimal
- Unhealthy air days now
- 1 days/yr
- Unhealthy air days in 30 yrs
- 2 days/yr
Risk factors via First Street. Map © Google.
Why this score? — see what drove the C- grade
The composite is a weighted blend of 9 inputs, each scored 0–100. Each bar is that input's sub-score; the figure is the points it added to the 100-point composite (weight × sub-score).
- Cash flow +16.4/30.0
- ARV discount +7.5/15.0
- 1% rule +6.2/10.0
- Appreciation +5.3/10.0
- DSCR +5.1/10.0
- Schools +5.0/10.0
- Livability +4.1/5.0
- Rent growth +2.7/5.0
- Condition / age +2.5/5.0
$349,000
🖨 Deal sheet 📄 Offer letter ✓ Due diligence
Listing remarks
CORNER UNIT AND DOCK SPACE!!!! Gorgeous is an understatement! Move-in ready 2-bedroom, waterfront condo located in the exclusive Eastern Shores community, just off the Intracoastal Waterway. The unit is very bright and offers spectacular water views from a spacious private balcony and a generous living area. DOCK UP TO 30 Feet!!!! The building features a common dock for the exclusive use of homeowners, with dockage available for boats up to 30 feet . Enjoy direct ocean access with no fixed bridges and deep water—ideal for boating enthusiasts. Building has completed the 40 year and 50 year recertification! Additional highlights include a 24/7 guard-gated community, assigned parking spa
Key facts
- Water views
- Private balcony
- Dock space
Tags
Property features AI
Finance
- Other: Waterfront property with canal access; Association pool
- Financial info: Pets allowed with size limit (maximum 20 lbs)
- HOA & community: Monthly association fee; Association fee includes hot water, insurance, laundry, legal/accounting, parking, and pest control; Association amenities include clubhouse and pool
Exterior
- Parking: Assigned covered parking; Attached garage; 1 garage space
- Security: Intercom; Key card entry; Security guard
- Utilities: Cable available; Central electric cooling; Electric water heater
- Home design: One-story unit within a multi-story building; Property is attached; Has a view; Entry located on level 3
- Construction: Block construction; Resale property
- Exterior features: Balcony; Open balcony/porch
Interior
- Kitchen: Dishwasher; Electric range; Microwave; Refrigerator; Icemaker; Electric water heater
- Bedrooms: Bedroom located on main level
- Flooring: Tile
- Bathrooms: 2 full bathrooms
- Heating & cooling: Central air conditioning
- Interior features: Sliding windows; Closet cabinetry; Dining area; Separate/formal dining room; Bedroom on main level
- Laundry & utility: Laundry included in association amenities
Neighborhood map
What this means for you Summary
Snapshot
- This is a 2-bed/1.0-bath condo listed at $349k.
Deal economics
- At list price, monthly cash flow is $-228 ($-3k/yr) — negative.
- To cash-flow at today's rent, offer at most $309k (11.5% below list).
- Meets the 1% rule at list price ($4k rent vs $349k).
- Recommended offer: $309k (11.5% below list) — sets the bar for cash-flow.
- Cap rate 7.0% vs local median 5.2% in North Miami Beach — top-decile yield for the area; either an underpriced asset or a hidden risk that comps aren't pricing in. Stress-test before assuming the spread holds.
Location & tenants
- Location reads 82/100 on livability (#71 in FL, #1,177 nationally) — a professional / high-income tenant draw. Strengths: commute A+, housing A+, health & safety A+; Watch: employment D+, crime F.
- Market conditions: Rents flat; 1870 active listings in the ZIP; 1 comparable units currently listed for rent nearby; 10,051 units permitted in Miami-Dade County in 2024 (7,758 in 5+ unit buildings).
- At $3,920/mo this rent would consume 70% of the median local household income ($67k/yr) (locally 3106% of renters already pay >50% of income on rent) — very limited rent-growth headroom before tenants either downsize or default.
Forward outlook
- In year one you build about $4k of equity ($2k loan paydown + $2k appreciation (0.5% local appreciation)).
- Miami-Dade County population projected at +28% by 2050 — long-run rental-demand tailwind backs the buy-and-hold thesis.
- By year 7, paydown + projected appreciation supports a ~$31k cash-out refi (75% LTV) — recoverable capital for the next deal without selling this one.
Negotiation context
- Only 5 days on market — expect competitive offers; lowballing is unlikely to land.
- 2 sale attempts with the ask held roughly flat each time — persistent listings suggest the price (not the market) is what's stuck; bring a comps-based counter.
- Current owner paid $85k; list at $349k implies a 311% gain — meaningful room to come down on a strong offer.
Risks & watch-outs
- Watch-outs: flood insurance adds $427/mo; HOA is 21% of rent.
- Climate carrying-cost: in FEMA flood zone AE (mandatory federal flood insurance); severe wind risk, 99% chance of damaging wind over 30y; extreme-heat days projected 7→27/yr by 2055 (HVAC capex compounding) — expect insurance premiums to compound above CPI over the hold.
Questions for the listing agent
- What do current leases actually rent for vs. the listed asking? Can we see a recent rent roll and the last 12 months of T-12 income?
- Built in 1974 — when were the roof, HVAC, electrical panel, plumbing, and water heater last replaced?
- What's the actual annual flood-insurance premium (NFIP or private), and is the property in a SFHA with mandatory coverage?
- What does the HOA fee cover, when was the last increase, and are there any pending special assessments or reserve-fund shortfalls?
- Any open or pending special assessments — roof, HVAC, plumbing, elevator, façade? What's the per-unit balance and payoff schedule, and is the seller paying it off at close or rolling it to the buyer?
- Is there a deadline driving the sale (1031 exchange, divorce, estate, relocation)? That informs how much negotiation room exists.
- Crime grade is F in this area — have there been break-ins, vandalism, or insurance claims at this property in the last 3 years? What carrier currently insures it and at what premium?
- This sits on a lake — are riparian / water-frontage rights deeded with the parcel? Any dock permits, shoreline easements, or HOA water-use restrictions?
- What's the documented flood / surge / shoreline-erosion history here (FEMA AND non-FEMA — e.g., storm surge, creek backup, septic-field saturation)?
- Any water-quality or seasonal algae-bloom issues that affect tenant satisfaction or short-term-rental demand?
- What's the average days-on-market for RENTAL listings here right now (not sales)? A rising rental-DOM trend means longer vacancies and softer asking-rent achievability than the comps imply.
- What's the recent tenant-quality profile in this submarket — average credit score on applications, eviction rate, late-payment / NSF rate, and stable-employment percentage? A property-management company in the area should have these aggregated.
- How much new apartment / multifamily construction is in the pipeline within 1–3 miles? Heavy new supply (>2% of stock underway) typically softens rents 12–24 months out; light construction supports rent growth.
Investment metrics
- 1% rule
- 1.12% ✓
- Cap rate
- 6.98%
- Cash-on-cash
- 2.44%
- DSCR
- 1.11
- GRM
- 7.4
CMA / ARV
No comps found within radius.
Projected returns pro-forma
0.53% appreciation · 0.94% rent growth · sell at horizon
- IRR
- -5.0%
- Equity multiple
- 0.76×
- Total profit
- $-23,345
- Equity at exit
- $110,631
- IRR
- -1.1%
- Equity multiple
- 0.88×
- Total profit
- $-11,983
- Equity at exit
- $140,645
Cash invested: $97,720 (down + closing). Projections, not guarantees.
Landlord ↔ Tenant lean methodology
- Overall (STATE)
- 87 Strongly Landlord-Friendly
- State Florida
- 87 Strongly Landlord-Friendly · R+3
- County
- — inherits STATE
- City
- — inherits STATE
ZIP-level market 33160
- Home prices YoY
- 0.2%
- Rents YoY
- 0.9%
- Active inventory
- 1870
- Price-to-rent
- 7.4×
Monthly cashflow live
- Estimated rent
- $3,920 medium interval (Pro) →
- Mortgage (P&I)
- −$1,830
- Tax from tax record
- −$108 /mo · $1,295/yr
- Insurance
- −$145
- Flood insurance flood zone
- −$427 /mo · $5,118/yr
- HOA
- −$815
- Vacancy / Maint / Mgmt
- −$823
- Net cashflow
- $-228
Break-even live
UW: 25.0% down · 7.5% · 30yr · 1.5% tax · 5.0% vac · 8.0% maint · 8.0% mgmt
Financing live
Cash to close
- Down payment
- $87,250
- Closing costs
- $10,470
- Reserves months
- —
- Total cash needed
- —
Loan-product check · same deal, 3 products live
Conventional
25% down · 7.5% · 30yr
- Down + closing
- —
- Monthly P&I
- —
- Monthly cashflow
- —
- DSCR
- —
- Eligible?
- —
Personal DTI + credit; lowest rate.
DSCR
20% down · 8.5% · 30yr
- Down + closing
- —
- Monthly P&I
- —
- Monthly cashflow
- —
- DSCR
- —
- Eligible?
- —
No personal income docs; deal must DSCR.
Hard money
10% down · 12.0% · 12mo
- Down + closing
- —
- Monthly P&I
- —
- Monthly cashflow
- —
- DSCR
- —
- Eligible?
- —
Short-term bridge; refi at stabilization.
Rent comps 1 comps
| Address | Beds | Baths | Sqft | Rent | $/sqft | DOM | Units | Dist |
|---|---|---|---|---|---|---|---|---|
| 15701 Collins Ave Sunny Isles Beach, FL | 2.0–4.0 | 2.5–5.5 | 2325 | $18,000 | $7.74 | 2d | 9 | 1.37mi |
HOA detail condo
- Monthly dues
- $815 · $9,780/yr
- Likely covers
- watersecurityparking
- Assessments
- None detected in remarks — confirm with the listing agent.
Listing history 20 events
-
2026-06-18days on market $349,000 Active 5 DOM
-
2026-06-17days on market $349,000 Active 4 DOM
-
2026-06-16days on market $349,000 Active 3 DOM
-
2026-06-15days on market $349,000 Active 2 DOM
-
2026-06-13days on market $349,000 Active 40 DOM
-
2026-06-09days on market $349,000 Active 36 DOM
-
2026-06-08days on market $349,000 Active 35 DOM
-
2026-06-07days on market $349,000 Active 34 DOM
-
2026-06-04days on market $349,000 Active 31 DOM
-
2026-06-03days on market $349,000 Active 30 DOM
-
2026-06-02days on market $349,000 Active 29 DOM
-
2026-06-01days on market $349,000 Active 28 DOM
-
2026-05-31days on market $349,000 Active 27 DOM
-
2026-05-04historical
-
2026-05-04$349,000 Active
-
2026-02-08price $349,000
-
2026-01-23$365,000 Active
-
2002-04-17soldstatus $85,000
-
1986-02-01soldstatus $53,000
-
1982-03-01soldstatus $50,000
ⓘ Source: listings_history table (triggers on properties + properties_extension) + one-shot
backfill from property_details.listing_events for pre-trigger history.
Tax reassessment forecast FL · Resets to sale price
- Current annual tax
- $1,295 · $108/mo
- Projected year-2 tax
- $2,897 · $241/mo
- Expected delta
- +$1,602/yr (+$133/mo · 123.7%)
ⓘ Screening estimate from a state-policy table — verify with the county assessor before closing.
Climate risk First Street
- Flood 9/10 Extreme FEMA zone AE · 99% chance over 30 yrs
- Wildfire 1/10 Low
- Heat 10/10 Extreme 7 d/yr ≥103°F today · 27 d/yr by 30 yrs out
- Wind 10/10 Extreme 99% chance of damaging wind over 30 yrs
- Air quality 2/10 Low 1 unhealthy d/yr today · 2 by 30 yrs out
Nearby sold comps map
Loading sold comps map…
Walkable amenities ~0.75 mi
Loading nearby amenities…
Taxation est. · year 1
- Rental income
- $47,043
- − Mortgage interest
- −$19,549
- − Property taxes
- −$1,295
- − Insurance
- −$6,864
- − Repairs & maintenance
- −$3,763
- − Management
- −$3,763
- − HOA
- −$9,780
- − Depreciation
- −$10,153
- Taxable loss
- −$8,125
- Est. tax savings @ 24.0%
- +$1,950
- After-tax cash flow
- $-787/yr
For passive investors: Depreciation is non-cash, so a rental often shows a tax loss while cash-flowing — sheltering income. Rental losses are passive: they offset passive income freely, and up to $25,000/yr can offset ordinary (W-2) income if you actively participate and your MAGI is under $100k (phasing out to $0 by $150k); unused losses carry forward. On sale, claimed depreciation is recaptured at up to 25%, and gains may owe capital-gains tax (a 1031 exchange can defer both). Figures are a year-1 estimate at your 24.0% rate — not tax advice; consult a CPA.
Schools (NCES district)
No district data.
Livability — North Miami Beach
- Score
- 82/100
- State rank
- #71
- US rank
- #1177
Category grades
Schools grade is shown separately in the Schools card above.
Census & demographics
- Census place
- North Miami Beach, FL
- County
- Miami-Dade County · 2,697,751 people
- City population
- 90,324
- Metro
- Miami-Fort Lauderdale-Pompano Beach, FL
- Population (ZIP)
- 43,718
- Household income
- $67,040
- Rent vs Own
- Severe rent burden
- 3106.0
Population outlook (Miami-Dade County) Hauer SSP2
- Today (2025)
- 3,126,439 people
- By 2030
- 3,325,765 · +6.4%
- By 2040
- 3,697,561 · +18.3%
- By 2050
- 4,012,134 · +28.3%
- By 2075
- 4,605,612 · +47.3%
- By 2100
- 4,866,598 · +55.7%
Race, ethnicity, and origin ACS 2023
- Neighborhood character
- Diverse neighborhood (Simpson 0.59)
- Race & ethnicity
- Hispanic / Latino 46% White 44% Two or more races 27% Black 4% Asian 2%
- Hispanic origin (detail)
- Mexican 1% Puerto Rican 3% Cuban 8% Dominican 1% Salvadoran 4%
- Common ancestry
- Scotch-Irish 8% Hispanic 3% Subsaharan African 3%
- Foreign-born
- 61% · Canada, Jamaica, Dominican Republic
- Languages at home
- 29% English-only · Spanish 45% Russian/Polish/Slavic 12% Other Indo-European 5%
Political lean MEDSL · Miami-Dade
- 2024 margin
- R (+11.4) · D 43.9% · R 55.4%
- 2008→2024 swing
- -27.6pp toward R · 2008: 16.1pp · 2024: -11.4pp
- All cycles
- 2024: R+11.4 2020: D+7.3 2016: D+29.6 2012: D+23.7 2008: D+16.1
Not yet ingested
- Civics
- —
Market trends
- HPI YoY
- ▲ 0.53%
- Current HPI
- 284.9293
- Rent YoY
- ▲ 0.94%
- Metro
- Miami-Fort Lauderdale-Pompano Beach, FL
- State GDP YoY
- ▲ 3.28%
- F500 in state
- 36
Industry mix (Fortune 500 HQ in FL)
| Industry | F500 HQs | Revenue |
|---|---|---|
| Industrial Technology | 2 | $29B |
|
||
| Insurance | 2 | $17B |
|
||
| Retail | 1 | $60B |
|
||
| Technology Distribution | 1 | $58B |
|
||
| Homebuilding | 1 | $35B |
|
||
| Technology Manufacturing | 1 | $35B |
|
||
Price history
+598.0% since first listed7 events — show timeline
- 2026-05-04 Listed $349,000 MARMLS
- 2026-05-04 Listing Removed — MARMLS
- 2026-02-08 Price Changed $349,000 MARMLS
- 2026-01-23 Listed $365,000 MARMLS
- 2002-04-17 Sold (Public Records) $85,000 Public Records
- 1986-02-01 Sold (Public Records) $53,000 Public Records
- 1982-03-01 Sold (Public Records) $50,000 Public Records
Property tax history
+2.2%/yrLatest (2025): $1,295 · +8.9% YoY. Source: county tax records.
Cash-flow waterfall
monthlySold comps — $/sqft
last 12 mo · ≤1 miLoading sold comps…