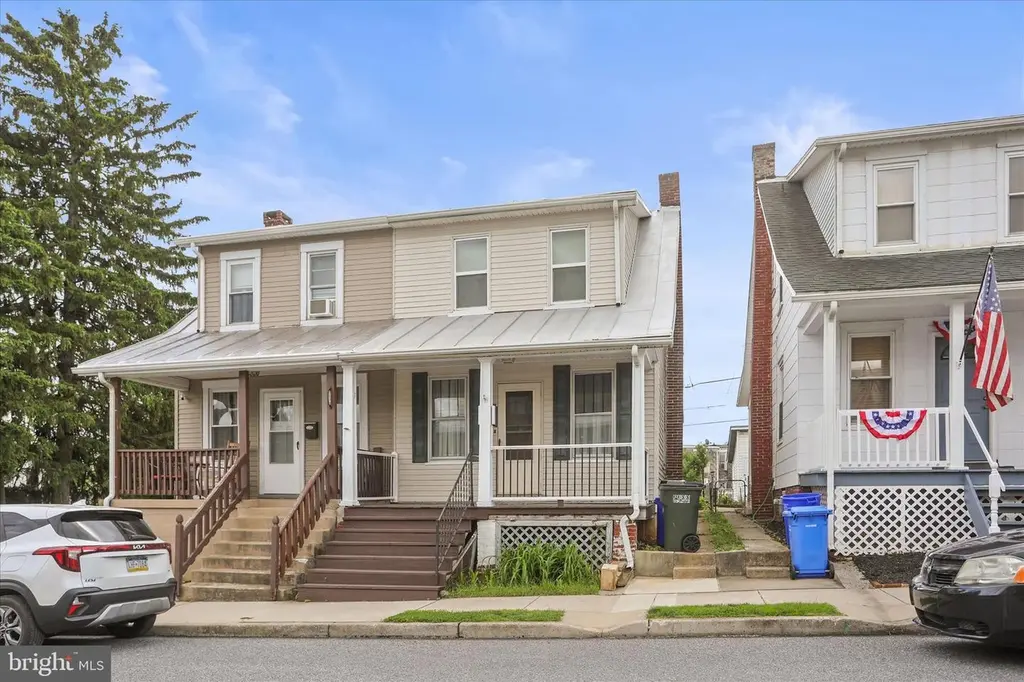
1038 W Locust St · West Manchester, PA
Flood risk 1/10 · Minimal
- FEMA flood zone
- X (unshaded)
- Chance of flooding over 30 yrs
- 0.0%
- Est. flood insurance / yr
- $473 – $860
Fire risk 1/10 · Minimal
- Est. fire insurance / yr
- $511 – $949
Heat risk 6/10 · Moderate
- Hot days now (above 103°F)
- 7 days/yr
- Hot days in 30 yrs
- 15 days/yr
Wind risk 4/10 · Minor
- Chance of severe wind over 30 yrs
- 10.0%
Air-quality risk 3/10 · Minor
- Unhealthy air days now
- 3 days/yr
- Unhealthy air days in 30 yrs
- 5 days/yr
Risk factors via First Street. Map © Google.
Why this score? — see what drove the D- grade
The composite is a weighted blend of 9 inputs, each scored 0–100. Each bar is that input's sub-score; the figure is the points it added to the 100-point composite (weight × sub-score).
- Cash flow +14.9/30.0
- DSCR +4.6/10.0
- 1% rule +4.2/10.0
- Rent growth +4.1/5.0
- Schools +3.2/10.0
- Livability +2.5/5.0
- Condition / age +2.5/5.0
- ARV discount +1.7/15.0
- Appreciation +0.0/10.0
$139,900
🖨 Deal sheet (PDF) 📄 Offer letter ✓ Due diligence
Listing remarks
PRICE REDUCED!!!! WEST YORK SEMI-DETACHED HOME WITH 2 BEDROOMS AND 1 FULL BATH. FIRST FLOOR HAS A LIVING ROOM WITH A BUILT-IN ROOM DIVIDER AND SHELVES, DINING ROOM AND KITCHEN WITH OAK CABINETS. NEW REFRIGERATOR, ELECTRIC STOVE, WASHER AND DRYER & BASEMENT REFRIGERATOR ARE INCLUDED. THE 2ND FLOOR HAS 2 BEDROOMS AND A FULL BATH. THE BASEMENT HAS A DIRT FLOOR AND AN OUTSIDE ENTRANCE. THE LAUNDRY IS LOCATED IN THE BASEMENT AND THERE IS A NEW GAS FURNACE AND WATER HEATER. THERE IS OFF-STREET PARKING AND A PRIVATE BACKYARD. THE HOME IS CLOSE TO SHOPPING AND SCHOOLS. SECOND FLOOR HAS ELECTRIC BASEBOARD HEAT AND FIRST FLOOR HAS A NEW GAS FURNACE.
Key facts
- Oak cabinets
- Private backyard
- New refrigerator
Tags
Property features AI
Finance
- Other: Fee simple ownership; Property condition listed as average; No horse privileges; Pets allowed with no pet restrictions; Building not winterized
Exterior
- Parking: Off-street parking (2 spaces) with crushed stone; On-street parking available; Total of 2 garage/parking spaces
- Utilities: Public water; Public sewer; Electric available; Natural gas available; Cable TV available; Phone service available; Municipal trash service; Cable internet available; Electric hot water
- Home design: Semi-detached property; Estimated year built; Metal roof; Entry faces middle of block
- Construction: Stick-built construction with vinyl siding; Copper plumbing; Permanent block foundation; Windows are double pane, insulated, replacement units with screens and vinyl-clad/wood frames; Basement is full, unfinished dirt floor with interior access, outside entrance and windows (not finished)
- Exterior features: Sidewalks; Chain link rear fencing; Level lot with rear yard and road frontage; Lot dimensions approximately 39 x 109 x 39 x 108
Interior
- Kitchen: Electric oven/range; Refrigerator; Eat-in kitchen with table space
- Bedrooms: Two bedrooms on the upper level
- Flooring: Wood flooring; Vinyl flooring
- Bathrooms: One full bathroom
- Heating & cooling: Baseboard electric heat; Forced air heating; Window air conditioning units; Circuit breaker electric service
- Interior features: Tub with shower; Breakfast area; Built-in shelving; Traditional floor plan; Formal dining room; Eat-in kitchen / table space; Window treatments; Plaster walls; Wood floors
- Laundry & utility: Washer and dryer in unit; Washer/dryer hookups in basement; Dryer is electric; Water heater included
Neighborhood map
What this means for you Summary
Snapshot
- This is a 2-bed/1.0-bath townhouse listed at $140k.
Deal economics
- At list price, monthly cash flow is $42 ($501/yr) — positive.
- The deal already cash-flows at list — no discount required.
- To meet the 1% rule (rent ≥ 1% of price), the offer needs to be $129k (8.0% below list).
- Recommended offer: $129k (8.0% below list) — sets the bar for 1% rule.
Location & tenants
- Location reads: area grade D — affects rentability + tenant quality, not the cash-flow math above.
- West York Area SD (suburban): math 29% / reading 45% proficiency, ranked #379 of 539 in PA (top 70%) — families likely to look elsewhere, expect single-tenant / working-renter base with shorter leases.
- Zoned schools: Lincolnway El Sch (math 31% / reading 47%, grade F, #983 of 1,518 statewide, top 65%, 405 students, 56% FRL); West York Area Ms (math 19% / reading 44%, grade F, #367 of 512 statewide, top 73%, 675 students, 53% FRL); West York Area Hs (math 57% / reading 30%, grade F, #213 of 437 statewide, top 49%, 869 students, 49% FRL) — zoned schools average 53% FRL vs 37% district-wide (16 pts higher); higher-poverty schools than district average — tighter screening recommended.
- Market conditions: Rents rising fast (+6.4%/yr); 252 active listings in the ZIP; 34 comparable units currently listed for rent nearby; rentals at typical pace (median 23d on market — plan ~3-4 weeks tenant-placement turnaround); 41% of comp listings sitting > 30 days — soft ceiling on asking rent; solid renter incomes; 1,328 units permitted in York County in 2024 (338 in 5+ unit buildings).
Forward outlook
- Local home prices are declining (-3.0%/yr); year-one equity from $967 of loan paydown is wiped out by about $4k of value loss. Plan a longer hold.
Negotiation context
- It's been on market 36 days — a 3% lower offer ($136k) is reasonable based on typical stale-listing flexibility.
- Current owner paid $32k; list at $140k implies a 337% gain — meaningful room to come down on a strong offer.
Risks & watch-outs
- Watch-outs: built in 1923 — expect roof / HVAC / electrical / plumbing capex.
- Climate carrying-cost: extreme-heat days projected 7→15/yr by 2055 (HVAC capex compounding) — expect insurance premiums to compound above CPI over the hold.
Questions for the listing agent
- It's been on market 36 days. Have you received any prior offers? Is the seller open to a 8% concession, seller financing, or rate buy-down credit?
- Built in 1923 — when were the roof, HVAC, electrical panel, plumbing, and water heater last replaced?
- Is there a deadline driving the sale (1031 exchange, divorce, estate, relocation)? That informs how much negotiation room exists.
- The area grade is low — what's the realistic commute time and amenity access for the typical tenant pool here? Any planned neighborhood developments (good or bad) we should know about?
- What's the average days-on-market for RENTAL listings here right now (not sales)? A rising rental-DOM trend means longer vacancies and softer asking-rent achievability than the comps imply.
- What's the recent tenant-quality profile in this submarket — average credit score on applications, eviction rate, late-payment / NSF rate, and stable-employment percentage? A property-management company in the area should have these aggregated.
- How much new for-sale + rental construction is in the pipeline within 1–3 miles? Heavy new supply typically softens prices + rents 12–24 months out; constrained supply supports both.
Investment metrics
- 1% rule
- 0.92% ✗
- Cap rate
- 6.65%
- Cash-on-cash
- 1.28%
- DSCR
- 1.06
- GRM
- 9.1
CMA / ARV
- ARV (on-the-fly)
- $123,952
- Comps found
- 11
Show comp detail 11 sales within ~0.75 mi
| Address | Dist | Beds/Ba | Sqft | Sold | Price | $/sf | Match |
|---|---|---|---|---|---|---|---|
| 1437 W King St | 0.56mi | 2/1.0 | 1,064 (+5%) | 4mo | $140,000 | $132 | 62 |
| 578 Salem Ave | 0.48mi | 2/1.0 | 936 (-8%) | 10mo | $114,000 | $122 | 56 |
| 122 N Cedar St | 0.54mi | 2/1.0 | 960 (-6%) | 15mo | $70,000 | $73 | 53 |
| 550 Salem Ave | 0.51mi | 3/1.0 (+1) | 1,104 (+9%) | 11mo | $149,900 | $136 | 48 |
| 1303 W Poplar St | 0.35mi | 2/1.0 | 893 (-12%) | 22mo | $132,000 | $148 | 45 |
| 480 W Princess St | 0.63mi | 3/1.0 (+1) | 1,105 (+9%) | 10mo | $106,000 | $96 | 42 |
| 568 Salem Ave | 0.49mi | 3/1.0 (+1) | 1,100 (+8%) | 19mo | $95,000 | $86 | 42 |
| 571 W Philadelphia St | 0.63mi | 3/1.5 (+1) | 1,134 (+12%) | 8mo | $115,000 | $101 | 37 |
| 712 Maryland Ave | 0.69mi | 3/1.0 (+1) | 1,152 (+13%) | 11mo | $111,000 | $96 | 32 |
| 1476 Old Salem Rd | 0.58mi | 3/1.0 (+1) | 1,167 (+15%) | 17mo | $178,147 | $153 | 29 |
| 545 W Clarke Ave | 0.64mi | 3/2.5 (+1) | 890 (-12%) | 22mo | $133,000 | $149 | 20 |
Match score weights: distance 35% · size 25% · config 20% · recency 20%. Top-matched comps best support the ARV.
Projected returns pro-forma
-3.0% appreciation · 6.38% rent growth · sell at horizon
- IRR
- -10.5%
- Equity multiple
- 0.61×
- Total profit
- $-15,457
- Equity at exit
- $20,860
- IRR
- 3.1%
- Equity multiple
- 1.25×
- Total profit
- $9,983
- Equity at exit
- $12,096
Cash invested: $39,172 (down + closing). Projections, not guarantees.
Landlord ↔ Tenant lean methodology
- Overall (STATE)
- 62 Landlord-Friendly
- State Pennsylvania
- 62 Landlord-Friendly · EVEN
- County
- — inherits STATE
- City
- — inherits STATE
ZIP-level market 17404
- Rents YoY
- 6.4%
- Active inventory
- 252
- Price-to-rent
- 9.1×
Monthly cashflow live
- Estimated rent
- $1,288 high interval (Pro) →
- Mortgage (P&I)
- −$734
- Tax from tax record
- −$183 /mo · $2,202/yr
- Insurance
- −$58
- HOA
- −$0
- Vacancy / Maint / Mgmt
- −$270
- Net cashflow
- $42
Break-even live
Sensitivity live
| Price | -10% $121 | -5% $81 | +0% $42 | +5% $2 | +10% $-37 |
|---|---|---|---|---|---|
| Rent | -10% $-60 | -5% $-9 | +0% $42 | +5% $93 | +10% $143 |
| Rate | -1.0pp $112 | -0.5pp $77 | base $42 | +0.5pp $6 | +1.0pp $-31 |
UW: 25.0% down · 7.5% · 30yr · 1.5% tax · 5.0% vac · 8.0% maint · 8.0% mgmt
Financing live
Cash to close
- Down payment
- $34,975
- Closing costs
- $4,197
- Reserves months
- —
- Total cash needed
- —
Loan-product check · same deal, 3 products live
Conventional
25% down · 7.5% · 30yr
- Down + closing
- —
- Monthly P&I
- —
- Monthly cashflow
- —
- DSCR
- —
- Eligible?
- —
Personal DTI + credit; lowest rate.
DSCR
20% down · 8.5% · 30yr
- Down + closing
- —
- Monthly P&I
- —
- Monthly cashflow
- —
- DSCR
- —
- Eligible?
- —
No personal income docs; deal must DSCR.
Hard money
10% down · 12.0% · 12mo
- Down + closing
- —
- Monthly P&I
- —
- Monthly cashflow
- —
- DSCR
- —
- Eligible?
- —
Short-term bridge; refi at stabilization.
Rent comps 34 comps
| Address | Beds | Baths | Sqft | Rent | $/sqft | DOM | Units | Dist |
|---|---|---|---|---|---|---|---|---|
| 50 Carlisle Ave Unit 54-COMMERICAL York, PA | 1.0 | 1.0 | 988 | $1,500 | $1.52 | 45d | 1 | 0.37mi |
| 648 W College Ave York, PA | 3.0 | 1.0 | 1100 | $1,275 | $1.16 | 45d | 1 | 0.38mi |
| 39 N Belvidere Ave #1 York, PA | 1.0 | 1.0 | 975 | $1,000 | $1.03 | 45d | 1 | 0.45mi |
| 50 S Highland Ave York, PA | 2.0–3.0 | 1.0–1.5 | 1015 | $1,042 | $1.03 | 15d | 1 | 0.49mi |
| 813 Madison Ave York, PA | 2.0 | 1.5 | 1100 | $1,175 | $1.07 | 15d | 1 | 0.52mi |
| 1410 Monroe St Ste M West York, PA | 2.0 | 1.0 | 1100 | $1,195 | $1.09 | 23d | 1 | 0.55mi |
| 588 Company St York, PA | 3.0 | 1.5 | 1416 | $1,475 | $1.04 | 45d | 1 | 0.62mi |
| 466 W College Ave York, PA | 3.0 | 1.0 | 1068 | $1,295 | $1.21 | 45d | 1 | 0.67mi |
| 1559 W King St Unit 2 West York, PA | 3.0 | 1.0 | 1020 | $1,250 | $1.23 | 15d | 1 | 0.70mi |
| 1704 W Market St Unit 2 West York, PA | 2.0 | 1.0 | 850 | $900 | $1.06 | 23d | 1 | 0.86mi |
| 1627 Filbert St York, PA | 3.0 | 1.0 | 1193 | $1,395 | $1.17 | 23d | 1 | 0.87mi |
| 330 W King St York, PA | 3.0 | 1.0 | 713 | $1,195 | $1.68 | 15d | 1 | 0.88mi |
| 631 Roosevelt Ave Unit 2 York, PA | 3.0 | 1.0 | 1170 | $1,150 | $0.98 | 15d | 1 | 0.94mi |
| 450 Madison Ave York, PA | 1.0–2.0 | 1.0 | 862 | $1,250 | $1.45 | 15d | 1 | 0.95mi |
| 1060 Crest Way York, PA | 1.0–2.0 | 1.0–2.0 | 1033 | $1,850 | $1.79 | 45d | 1 | 0.99mi |
| 1060 Crest Way York, PA | 2.0 | 2.0 | 1251 | $1,850 | $1.48 | 15d | 1 | 0.99mi |
| 314 W Gay Ave York, PA | 3.0 | 1.0 | 1060 | $1,250 | $1.18 | 23d | 1 | 1.00mi |
| 264 W Market St Unit 2 York, PA | 1.0 | 1.0 | 1012 | $1,125 | $1.11 | 45d | 1 | 1.00mi |
| 264 W Market St Unit 2 York, PA | 1.0 | 1.0 | 1012 | $1,125 | $1.11 | 15d | 1 | 1.00mi |
| 720 Elm Ter York, PA | 3.0 | 1.5 | 1200 | $1,950 | $1.62 | 23d | 1 | 1.02mi |
| 403 N Newberry St Unit A10 York, PA | 2.0 | 1.0 | 750 | $1,095 | $1.46 | 23d | 1 | 1.11mi |
| 403 N Newberry St Unit B12 York, PA | 2.0 | 1.0 | 750 | $1,050 | $1.40 | 45d | 1 | 1.11mi |
| 132 S Beaver St Apt 4 York, PA | 2.0 | 2.0 | 1000 | $1,250 | $1.25 | 45d | 1 | 1.19mi |
| 175 W Gay Ave York, PA | 1.0–2.0 | 1.0 | 1219 | $1,650 | $1.35 | 15d | 2 | 1.23mi |
| 49 W Market St Unit 2 R York, PA | 2.0 | 1.0 | 788 | $975 | $1.24 | 15d | 1 | 1.25mi |
| 133 Stevens Ave York, PA | 3.0 | 1.0 | 1200 | $1,300 | $1.08 | 45d | 1 | 1.30mi |
| 28 N George St Unit H York, PA | 2.0 | 2.0 | 1400 | $1,550 | $1.11 | 45d | 1 | 1.34mi |
| 28 N George St York, PA | 1.0 | 1.5 | 990 | $1,295 | $1.31 | 45d | 1 | 1.34mi |
| 334 N Beaver St York, PA | 3.0 | 1.0 | 1140 | $1,050 | $0.92 | 15d | 1 | 1.36mi |
| 101 N Forrest St York, PA | 3.0 | 1.0 | 1340 | $1,695 | $1.26 | 23d | 1 | 1.40mi |
| 251 N George St York, PA | 2.0 | 2.0 | 1100 | $1,595 | $1.45 | 15d | 1 | 1.44mi |
| 444 S Duke St York, PA | 3.0 | 1.0 | 1200 | $1,200 | $1.00 | 45d | 1 | 1.44mi |
| 514 S Duke St York, PA | 3.0 | 1.0 | 1289 | $1,625 | $1.26 | 23d | 1 | 1.45mi |
| 443 S Duke St York, PA | 3.0 | 1.0 | 1028 | $1,225 | $1.19 | 45d | 1 | 1.45mi |
Listing history 19 events
-
2026-06-21days on market $139,900 Active 36 DOM
-
2026-06-18days on market $139,900 Active 33 DOM
-
2026-06-17days on market $139,900 Active 32 DOM
-
2026-06-16days on market $139,900 Active 31 DOM
-
2026-06-15days on market $139,900 Active 30 DOM
-
2026-06-14days on market $139,900 Active 28 DOM
-
2026-06-13days on market $139,900 Active 27 DOM
-
2026-06-10days on market $139,900 Active 25 DOM
-
2026-06-09days on market $139,900 Active 24 DOM
-
2026-06-08days on market $139,900 Active 23 DOM
-
2026-06-07remarks 650-char remark
-
2026-06-07pricedays on market $139,900 Active 22 DOM
-
2026-06-03days on market $149,900 Active 18 DOM
-
2026-06-02days on market $149,900 Active 17 DOM
-
2026-06-01days on market $149,900 Active 16 DOM
-
2026-05-31days on market $149,900 Active 15 DOM
-
2026-05-30days on market $149,900 Active 14 DOM
-
2026-05-16$149,900 Active
-
1996-06-21soldstatus $32,000
ⓘ Source: listings_history table (triggers on properties + properties_extension) + one-shot
backfill from property_details.listing_events for pre-trigger history.
Tax reassessment forecast PA · Partial reset (capped growth)
- Current annual tax
- $2,202 · $183/mo
- Projected year-2 tax
- $2,206 · $184/mo
- Expected delta
- +$4/yr ($0/mo · 0.2%)
ⓘ Screening estimate from a state-policy table — verify with the county assessor before closing.
Climate risk First Street
- Flood 1/10 Low FEMA zone X (unshaded) · 0% chance over 30 yrs
- Wildfire 1/10 Low
- Heat 6/10 Major 7 d/yr ≥103°F today · 15 d/yr by 30 yrs out
- Wind 4/10 Moderate 10% chance of damaging wind over 30 yrs
- Air quality 3/10 Moderate 3 unhealthy d/yr today · 5 by 30 yrs out
Nearby sold comps map
Loading sold comps map…
Walkable amenities ~0.75 mi
Loading nearby amenities…
Taxation est. · year 1
- Rental income
- $15,451
- − Mortgage interest
- −$7,837
- − Property taxes
- −$2,202
- − Insurance
- −$700
- − Repairs & maintenance
- −$1,236
- − Management
- −$1,236
- − Depreciation
- −$4,070
- Taxable loss
- −$1,829
- Est. tax savings @ 24.0%
- +$439
- After-tax cash flow
- $940/yr
For passive investors: Depreciation is non-cash, so a rental often shows a tax loss while cash-flowing — sheltering income. Rental losses are passive: they offset passive income freely, and up to $25,000/yr can offset ordinary (W-2) income if you actively participate and your MAGI is under $100k (phasing out to $0 by $150k); unused losses carry forward. On sale, claimed depreciation is recaptured at up to 25%, and gains may owe capital-gains tax (a 1031 exchange can defer both). Figures are a year-1 estimate at your 24.0% rate — not tax advice; consult a CPA.
Schools (NCES district)
- District
- West York Area SD
- NCES district ID
- 4225980
- Math proficiency
- 29% ▼ -8.00%
- Reading proficiency
- 45% ▼ -12.00%
- Median HH income
- $54,375
- Composite
- 32.36/100
- National rank
- #5736
- State rank
- #379 of 539 in PA
Livability — West Manchester
No livability data for this city. (Only ~50 U.S. cities are tracked.)
Census & demographics
- County
- York County · 278,806 people
- Metro
- York-Hanover, PA
- Population (ZIP)
- 39,374
- Household income
- $78,506
- Rent vs Own
- Severe rent burden
- 722.0
Population outlook (York County) Hauer SSP2
- Today (2025)
- 454,205 people
- By 2030
- 457,407 · +0.7%
- By 2040
- 457,529 · +0.7%
- By 2050
- 448,261 · -1.3%
- By 2075
- 427,388 · -5.9%
- By 2100
- 384,218 · -15.4%
Race, ethnicity, and origin ACS 2023
- Neighborhood character
- Majority White (65%)
- Race & ethnicity
- White 65% Hispanic / Latino 19% Black 12% Two or more races 8%
- Hispanic origin (detail)
- Mexican 2% Puerto Rican 9% Dominican 4%
- Common ancestry
- Romanian 2% Slovak 2% Lithuanian 1%
- Foreign-born
- 6% · Canada, Vietnam
- Languages at home
- 85% English-only · Spanish 12% Russian/Polish/Slavic 1%
Political lean MEDSL · York
- 2024 margin
- Strong R (+25.3) · D 36.9% · R 62.1%
- 2008→2024 swing
- -11.7pp toward R · 2008: -13.6pp · 2024: -25.3pp
- All cycles
- 2024: R+25.3 2020: R+24.6 2016: R+29.3 2012: R+21.2 2008: R+13.6
Not yet ingested
- Civics
- —
Market trends
- HPI YoY
- ▼ -135.44%
- Current HPI
- 237.5683
- Rent YoY
- ▲ 6.38%
- Metro
- York-Hanover, PA
- State GDP YoY
- ▲ 1.68%
- F500 in state
- 34
Industry mix (Fortune 500 HQ in PA)
| Industry | F500 HQs | Revenue |
|---|---|---|
| Healthcare | 2 | $309B |
|
||
| Insurance | 2 | $27B |
|
||
| Telecommunications / Media | 1 | $124B |
|
||
| Industrial Distribution | 1 | $22B |
|
||
| Financial Services | 1 | $20B |
|
||
| Chemicals / Materials | 1 | $18B |
|
||
Price history
+368.4% since first listed2 events — show timeline
- 2026-05-16 Listed $149,900 BRIGHT MLS
- 1996-06-21 Sold (Public Records) $32,000 Public Records
Property tax history
+2.6%/yrLatest (2025): $2,202 · +2.6% YoY. Source: county tax records.
Cash-flow waterfall
monthlySold comps — $/sqft
last 12 mo · ≤1 miLoading sold comps…