 Multi-family
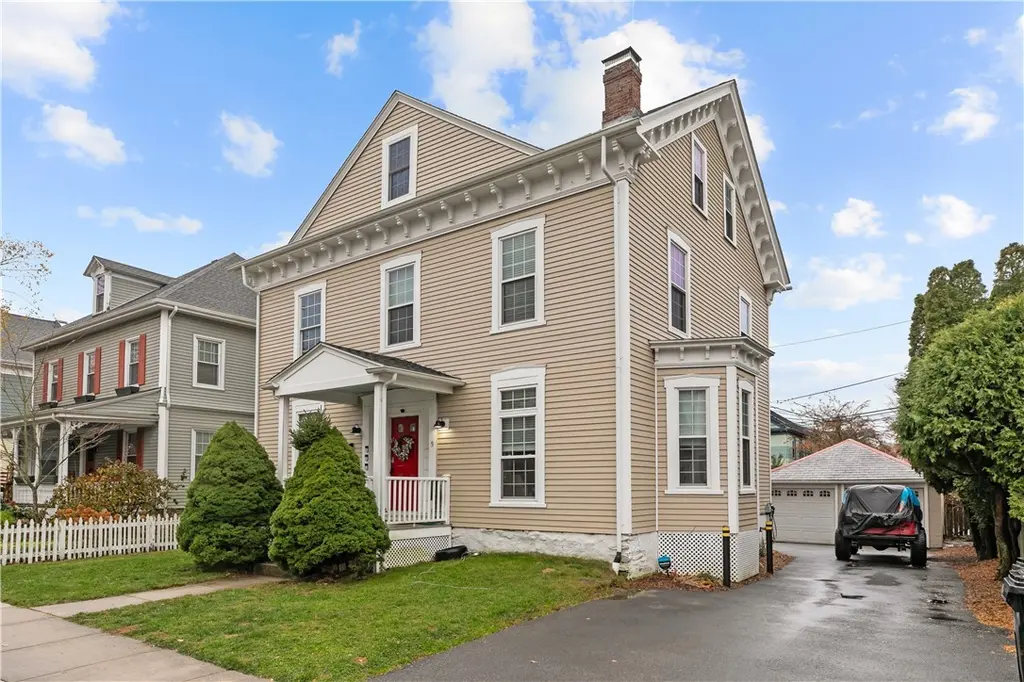
5 Elliot Pl · Newport, RI
Flood risk 1/10 · Minimal
- FEMA flood zone
- X (unshaded)
- Chance of flooding over 30 yrs
- 0.0%
- Est. flood insurance / yr
- $507 – $1,088
Fire risk 1/10 · Minimal
- Est. fire insurance / yr
- $835 – $1,551
Heat risk 6/10 · Moderate
- Hot days now (above 90°F)
- 7 days/yr
- Hot days in 30 yrs
- 17 days/yr
Wind risk 8/10 · Major
- Chance of severe wind over 30 yrs
- 80.0%
Air-quality risk 2/10 · Minimal
- Unhealthy air days now
- 2 days/yr
- Unhealthy air days in 30 yrs
- 2 days/yr
Risk factors via First Street. Map © Google.
Why this score? — see what drove the C grade
The composite is a weighted blend of 9 inputs, each scored 0–100. Each bar is that input's sub-score; the figure is the points it added to the 100-point composite (weight × sub-score).
- Cash flow +21.1/30.0
- ARV discount +10.5/15.0
- DSCR +6.7/10.0
- Rent growth +4.8/5.0
- 1% rule +4.5/10.0
- Livability +3.9/5.0
- Condition / age +2.5/5.0
- Schools +1.5/10.0
- Appreciation +0.0/10.0
$1,400,000
🖨 Deal sheet 📄 Offer letter ✓ Due diligence
Multi-family units
County records classify this as Multi-Family (2-4 Unit). Listing-text estimate: 1 unit. estimate disagrees with records
Listing remarks
Just off upper Broadway, this home features 3 units, two spacious 3-bedroom apartments and an updated 2-bedroom apartment, all featuring modern upgrades. Recent renovations include a roof, siding, windows, electrical, plumbing, and heating systems. 5 off-street parking spaces, EV charger, a 2-car garage, deck and garden area. Strong rental history, within close proximity to Broadway's restaurants and shops, the U. S. Naval War College, and convenient highway access. A great turnkey property for investors or owner-occupants.
Key facts
- Garden area
- Modern upgrades
- Recent renovations
Tags
Property features AI
Finance
- HOA & community: Community features include highway access, proximity to hospital and schools, pool, public transportation, recreation area, restaurants, shopping, and tennis courts
Exterior
- Parking: Detached garage; 2 garage spaces; Total parking for 5 vehicles (2 covered)
- Utilities: Public water connection; Public sewer connection; 100 amp electrical service
- Home design: Clapboard exterior; 3 stories; Single building with 3 units
- Construction: Clapboard construction
- Exterior features: Public sewer connection; Lot approximately 0.12 acres; Lot approximately 5,227 sq ft; Zoned R10
Interior
- Kitchen: Electric water heater
- Bedrooms: 3 units total (multi-unit property)
- Flooring: Hardwood
- Bathrooms: 3 full bathrooms
- Heating & cooling: Gas heating; Hot water heating
- Interior features: Hardwood floors; Bathtub; Interior steps; Tub with shower; Full, unfinished basement; Two fireplaces
- Laundry & utility: Laundry available in-unit and in a common area
Neighborhood map
What this means for you Summary
Snapshot
- This is a 7-bed/3.0-bath multifamily listed at $1.40M.
Deal economics
- At list price, monthly cash flow is $2k ($24k/yr) — positive.
- The deal already cash-flows at list — no discount required.
- To meet the 1% rule (rent ≥ 1% of price), the offer needs to be $1.33M (4.7% below list).
- Recommended offer: $1.33M (4.7% below list) — sets the bar for 1% rule.
- Cap rate 8.0% vs local median 2.1% in Newport — top-decile yield for the area; either an underpriced asset or a hidden risk that comps aren't pricing in. Stress-test before assuming the spread holds.
Location & tenants
- Location reads 78/100 on livability (#5 in RI, #2,367 nationally) — a middle-class / working-renter tenant base. Strengths: amenities A+, commute A+, health & safety A+; Watch: schools D-, cost of living F.
- Newport (suburban): math 10% / reading 20% proficiency, ranked #29 of 39 in RI (top 74%) — low school quality limits family demand, transient renter base, plan for 1-2y turnover.
- Market conditions: Rents rising fast (+9.3%/yr); 134 active listings in the ZIP; 3 comparable units currently listed for rent nearby; rentals at typical pace (median 24d on market — plan ~3-4 weeks tenant-placement turnaround); solid renter incomes; 94 units permitted in Newport County in 2024 (0 in 5+ unit buildings).
- At $13,341/mo this rent would consume 186% of the median local household income ($86k/yr) (locally 1294% of renters already pay >50% of income on rent) — very limited rent-growth headroom before tenants either downsize or default.
Forward outlook
- Local home prices are declining (-3.0%/yr); year-one equity from $10k of loan paydown is wiped out by about $42k of value loss. Plan a longer hold.
- Newport County population projected at -12% by 2050 — secular population decline; favor cash flow + early exit over multi-decade hold.
- At projected returns (-3.0% appreciation + 8.0% rent growth), your $392k cash investment doubles in ~9 years — after that, you're playing with house money.
Negotiation context
- It's been on market 21 days — a 2% lower offer ($1.38M) is reasonable based on typical stale-listing flexibility.
- 12 sale attempts since 24y ago with the ask held roughly flat each time — persistent listings suggest the price (not the market) is what's stuck; bring a comps-based counter.
- Current owner paid $1.20M; 17% above their basis — modest negotiation headroom, anchor on the comps not their cost.
Risks & watch-outs
- Watch-outs: built in 1870 — expect roof / HVAC / electrical / plumbing capex.
- Climate carrying-cost: severe wind risk, 80% chance of damaging wind over 30y; extreme-heat days projected 7→17/yr by 2055 (HVAC capex compounding) — expect insurance premiums to compound above CPI over the hold.
Questions for the listing agent
- Built in 1870 — when were the roof, HVAC, electrical panel, plumbing, and water heater last replaced?
- Is there a deadline driving the sale (1031 exchange, divorce, estate, relocation)? That informs how much negotiation room exists.
- Schools are D-rated, which usually means shorter tenancies and higher turnover. Who's the typical renter profile here, and what's been the actual vacancy rate?
- What's the average days-on-market for RENTAL listings here right now (not sales)? A rising rental-DOM trend means longer vacancies and softer asking-rent achievability than the comps imply.
- What's the recent tenant-quality profile in this submarket — average credit score on applications, eviction rate, late-payment / NSF rate, and stable-employment percentage? A property-management company in the area should have these aggregated.
- How much new apartment / multifamily construction is in the pipeline within 1–3 miles? Heavy new supply (>2% of stock underway) typically softens rents 12–24 months out; light construction supports rent growth.
Investment metrics
- 1% rule
- 0.95% ✗
- Cap rate
- 8.01%
- Cash-on-cash
- 6.12%
- DSCR
- 1.27
- GRM
- 8.7
CMA / ARV
- ARV (on-the-fly)
- $1,501,026
- Comps found
- 4
Show comp detail 4 sales within ~0.75 mi
| Address | Dist | Beds/Ba | Sqft | Sold | Price | $/sf | Match |
|---|---|---|---|---|---|---|---|
| 20 Summer St | 0.34mi | 8/4.0 (+1) | 3,500 (+4%) | 1mo | $1,650,000 | $471 | 68 |
| 8 Peckham Ave | 0.12mi | 6/3.0 (-1) | 3,128 (-7%) | 17mo | $740,000 | $237 | 64 |
| 7 Caswell Ave | 0.24mi | 8/3.0 (+1) | 2,934 (-13%) | 7mo | $912,500 | $311 | 57 |
| 401 Broadway | 0.17mi | 7/5.0 | 2,907 (-13%) | 23mo | $1,300,000 | $447 | 43 |
Match score weights: distance 35% · size 25% · config 20% · recency 20%. Top-matched comps best support the ARV.
Projected returns pro-forma
-3.0% appreciation · 8.0% rent growth · sell at horizon
- IRR
- -1.9%
- Equity multiple
- 0.92×
- Total profit
- $-29,468
- Equity at exit
- $208,745
- IRR
- 12.2%
- Equity multiple
- 2.17×
- Total profit
- $457,243
- Equity at exit
- $121,046
Cash invested: $392,000 (down + closing). Projections, not guarantees.
Landlord ↔ Tenant lean methodology
- Overall (STATE)
- 31 Tenant-Leaning
- State Rhode Island
- 31 Tenant-Leaning · D+8
- County
- — inherits STATE
- City
- — inherits STATE
ZIP-level market 02840
- Rents YoY
- 9.3%
- Active inventory
- 134
- Price-to-rent
- 33.7×
Monthly cashflow live
- Estimated rent
- $13,341 high interval (Pro) →
- Mortgage (P&I)
- −$7,342
- Tax from tax record
- −$614 /mo · $7,371/yr
- Insurance
- −$583
- HOA
- −$0
- Vacancy / Maint / Mgmt
- −$2,802
- Net cashflow
- $2,000
Break-even live
4-unit breakdown (identical units grouped — click to expand)
| Units | Beds | Baths | Est. rent |
|---|---|---|---|
| 3× units | 3 | 1 | $10,374 |
| #1 | 3 | 1 | $3,458 |
| #2 | 3 | 1 | $3,458 |
| #3 | 3 | 1 | $3,458 |
| 1× unit | 2 | 1 | $2,965 |
| Total (4 units) | $13,341 | ||
UW: 25.0% down · 7.5% · 30yr · 1.5% tax · 5.0% vac · 8.0% maint · 8.0% mgmt
Financing live
Cash to close
- Down payment
- $350,000
- Closing costs
- $42,000
- Reserves months
- —
- Total cash needed
- —
Loan-product check · same deal, 3 products live
Conventional
25% down · 7.5% · 30yr
- Down + closing
- —
- Monthly P&I
- —
- Monthly cashflow
- —
- DSCR
- —
- Eligible?
- —
Personal DTI + credit; lowest rate.
DSCR
20% down · 8.5% · 30yr
- Down + closing
- —
- Monthly P&I
- —
- Monthly cashflow
- —
- DSCR
- —
- Eligible?
- —
No personal income docs; deal must DSCR.
Hard money
10% down · 12.0% · 12mo
- Down + closing
- —
- Monthly P&I
- —
- Monthly cashflow
- —
- DSCR
- —
- Eligible?
- —
Short-term bridge; refi at stabilization.
Rent comps 3 comps
| Address | Beds | Baths | Sqft | Rent | $/sqft | DOM | Units | Dist |
|---|---|---|---|---|---|---|---|---|
| 21 Bedlow Ave Newport, RI | 6.0 | 3.5 | 3785 | $24,000 | $6.34 | 11d | 1 | 0.17mi |
| 82 Ellery Rd Newport, RI | 6.0 | 5.0 | 4700 | $35,000 | $7.45 | 23d | 1 | 0.72mi |
| 8 Seascape Ave Middletown, RI | 6.0 | 4.0 | 2500 | $4,800 | $1.92 | 23d | 1 | 1.18mi |
Listing history 42 events
-
2026-06-18days on market $1,400,000 Active 21 DOM
-
2026-06-17days on market $1,400,000 Active 20 DOM
-
2026-06-16days on market $1,400,000 Active 19 DOM
-
2026-06-15days on market $1,400,000 Active 18 DOM
-
2026-06-13days on market $1,400,000 Active 16 DOM
-
2026-06-09days on market $1,400,000 Active 12 DOM
-
2026-06-08days on market $1,400,000 Active 11 DOM
-
2026-06-07days on market $1,400,000 Active 10 DOM
-
2026-06-05days on market $1,400,000 Active 7 DOM
-
2026-06-03days on market $1,400,000 Active 6 DOM
-
2026-06-02days on market $1,400,000 Active 5 DOM
-
2026-06-01days on market $1,400,000 Active 4 DOM
-
2026-05-31days on market $1,400,000 Active 3 DOM
-
2026-05-28$1,400,000 Active
-
2026-05-11historical
-
2026-04-17price $1,400,000
-
2026-02-27price $1,425,000
-
2025-11-12$1,450,000 Active
-
2025-04-08historical $3,200
-
2025-03-18$3,200
-
2025-03-17historical
-
2025-01-13price $1,450,000
-
2024-11-24$1,475,000 Active
-
2023-12-07historical $3,400
-
2023-10-06$3,400
-
2022-03-25soldstatus $1,200,000
-
2022-03-25$1,200,000
-
2015-07-16soldstatus $460,000 Sold
-
2015-05-16status Pending
-
2014-11-17status Active - Extended
-
2014-11-15historical
-
2014-08-16status Active - Back on Market
-
2014-08-16historical
-
2014-05-20$525,000 Active - New
-
2014-05-12historical
-
2013-11-18$525,000 Active - New
-
2011-03-15historical
-
2010-11-09$424,000
-
2002-05-31soldstatus $276,000
-
2002-05-30soldstatus $276,000
-
2002-02-26historical
-
2002-02-20$262,000
ⓘ Source: listings_history table (triggers on properties + properties_extension) + one-shot
backfill from property_details.listing_events for pre-trigger history.
Tax reassessment forecast RI · Partial reset (capped growth)
- Current annual tax
- $7,371 · $614/mo
- Projected year-2 tax
- $15,095 · $1,258/mo
- Expected delta
- +$7,724/yr (+$644/mo · 104.8%)
ⓘ Screening estimate from a state-policy table — verify with the county assessor before closing.
Climate risk First Street
- Flood 1/10 Low FEMA zone X (unshaded) · 0% chance over 30 yrs
- Wildfire 1/10 Low
- Heat 6/10 Major 7 d/yr ≥90°F today · 17 d/yr by 30 yrs out
- Wind 8/10 Severe 80% chance of damaging wind over 30 yrs
- Air quality 2/10 Low 2 unhealthy d/yr today · 2 by 30 yrs out
Nearby sold comps map
Loading sold comps map…
Walkable amenities ~0.75 mi
Loading nearby amenities…
Taxation est. · year 1
- Rental income
- $160,092
- − Mortgage interest
- −$78,422
- − Property taxes
- −$7,371
- − Insurance
- −$7,000
- − Repairs & maintenance
- −$12,807
- − Management
- −$12,807
- − Depreciation
- −$40,727
- Taxable income
- $957
- Est. tax owed @ 24.0%
- −$230
- After-tax cash flow
- $23,771/yr
For passive investors: Depreciation is non-cash, so a rental often shows a tax loss while cash-flowing — sheltering income. Rental losses are passive: they offset passive income freely, and up to $25,000/yr can offset ordinary (W-2) income if you actively participate and your MAGI is under $100k (phasing out to $0 by $150k); unused losses carry forward. On sale, claimed depreciation is recaptured at up to 25%, and gains may owe capital-gains tax (a 1031 exchange can defer both). Figures are a year-1 estimate at your 24.0% rate — not tax advice; consult a CPA.
Schools (NCES district)
- District
- Newport
- NCES district ID
- 4400720
- Math proficiency
- 10% ▼ -11.00%
- Reading proficiency
- 20% ▼ -8.00%
- Median HH income
- $59,063
- Composite
- 14.6/100
- National rank
- #9412
- State rank
- #29 of 39 in RI
Livability — Newport
- Score
- 78/100
- State rank
- #5
- US rank
- #2367
Category grades
Schools grade is shown separately in the Schools card above.
Census & demographics
- Census place
- Newport, RI
- County
- Newport County · 73,957 people
- City population
- 23,448
- Metro
- Providence-Warwick, RI-MA
- Population (ZIP)
- 23,448
- Household income
- $86,250
- Rent vs Own
- Severe rent burden
- 1294.0
Population outlook (Newport County) Hauer SSP2
- Today (2025)
- 81,198 people
- By 2030
- 79,518 · -2.1%
- By 2040
- 75,581 · -6.9%
- By 2050
- 71,801 · -11.6%
- By 2075
- 64,618 · -20.4%
- By 2100
- 56,724 · -30.1%
Race, ethnicity, and origin ACS 2023
- Neighborhood character
- Predominantly White (74%)
- Race & ethnicity
- White 74% Hispanic / Latino 11% Two or more races 9% Black 7% Asian 3%
- Hispanic origin (detail)
- Puerto Rican 6%
- Common ancestry
- Russian 5% Lithuanian 4% Romanian 4%
- Foreign-born
- 8% · Canada, China
- Languages at home
- 90% English-only · Spanish 6% Other Indo-European 2% Russian/Polish/Slavic 1%
Political lean MEDSL · Newport
- 2024 margin
- Strong D (+25.5) · D 61.6% · R 36.1% · Other 2.2%
- 2008→2024 swing
- +2.2pp toward D · 2008: 23.3pp · 2024: 25.5pp
- All cycles
- 2024: D+25.5 2020: D+29.8 2016: D+19.4 2012: D+17.7 2008: D+23.3
Not yet ingested
- Civics
- —
Market trends
- HPI YoY
- ▼ -1340.91%
- Current HPI
- 451.3919
- Rent YoY
- ▲ 9.32%
- Metro
- Providence-Warwick, RI-MA
- State GDP YoY
- ▲ 2.25%
- F500 in state
- 10
Industry mix (Fortune 500 HQ in RI)
| Industry | F500 HQs | Revenue |
|---|---|---|
| Healthcare | 1 | $373B |
|
||
| Food Distribution | 1 | $31B |
|
||
| Aerospace / Defense | 1 | $14B |
|
||
| Financial Services | 1 | $8B |
|
||
| Consumer Goods | 1 | $4B |
|
||
Price history
+434.4% since first listed29 events — show timeline
- 2026-05-28 Listed $1,400,000 RIS
- 2026-05-11 Listing Removed — RIS
- 2026-04-17 Price Changed $1,400,000 RIS
- 2026-02-27 Price Changed $1,425,000 RIS
- 2025-11-12 Listed $1,450,000 RIS
- 2025-04-08 Rental Removed $3,200 RIS
- 2025-03-18 Listed for Rent $3,200 RIS
- 2025-03-17 Listing Removed — RIS
- 2025-01-13 Price Changed $1,450,000 RIS
- 2024-11-24 Listed $1,475,000 RIS
- 2023-12-07 Rental Removed $3,400 RIS
- 2023-10-06 Listed for Rent $3,400 RIS
- 2022-03-25 Listed $1,200,000 RIS
- 2022-03-25 Sold (MLS) $1,200,000 RIS
- 2015-07-16 Sold (MLS) $460,000 RIS
- 2015-05-16 Pending — RIS
- 2014-11-17 Relisted — RIS
- 2014-11-15 Listing Removed — RIS
- 2014-08-16 Relisted — RIS
- 2014-08-16 Listing Removed — RIS
- 2014-05-20 Listed $525,000 RIS
- 2014-05-12 Listing Removed — RIS
- 2013-11-18 Listed $525,000 RIS
- 2011-03-15 Listing Removed — RIS
- 2010-11-09 Listed $424,000 RIS
- 2002-05-31 Sold (Public Records) $276,000 Public Records
- 2002-05-30 Sold (MLS) $276,000 RIS
- 2002-02-26 Listing Removed — RIS
- 2002-02-20 Listed $262,000 RIS
Property tax history
+5.8%/yrLatest (2025): $7,371 · +5.7% YoY. Source: county tax records.
Cash-flow waterfall
monthlySold comps — $/sqft
last 12 mo · ≤1 miLoading sold comps…