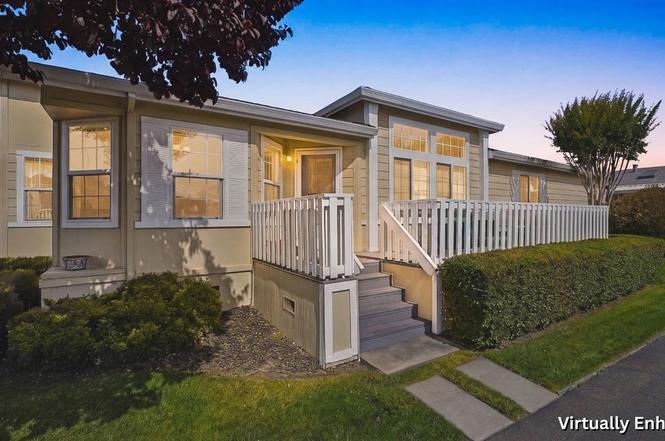
572 Birchwood Dr · Petaluma, CA
Flood risk 1/10 · Minimal
- FEMA flood zone
- X (unshaded)
- Chance of flooding over 30 yrs
- 0.0%
- Est. flood insurance / yr
- $507 – $1,088
Fire risk 3/10 · Minor
- Est. fire insurance / yr
- $659 – $1,223
Heat risk 4/10 · Minor
- Hot days now (above 91°F)
- 7 days/yr
- Hot days in 30 yrs
- 16 days/yr
Wind risk 1/10 · Minimal
- Chance of severe wind over 30 yrs
- —
Air-quality risk 9/10 · Severe
- Unhealthy air days now
- 20 days/yr
- Unhealthy air days in 30 yrs
- 20 days/yr
Risk factors via First Street. Map © Google.
Why this score? — see what drove the B+ grade
The composite is a weighted blend of 9 inputs, each scored 0–100. Each bar is that input's sub-score; the figure is the points it added to the 100-point composite (weight × sub-score).
- Cash flow +30.0/30.0
- ARV discount +15.0/15.0
- 1% rule +10.0/10.0
- DSCR +10.0/10.0
- Schools +4.7/10.0
- Livability +4.1/5.0
- Rent growth +2.7/5.0
- Condition / age +2.5/5.0
- Appreciation +0.0/10.0
$185,000
🖨 Deal sheet 📄 Offer letter ✓ Due diligence
Listing remarks
Welcome to 572 Birchwood Drive in The Cottages of Petaluma, a desirable 55+ community. This clean, move-in ready 3-bedroom, 2-bath home offers approximately 1,537 square feet with a bright, functional floor plan and vaulted ceilings that create an open, airy feel throughout. The home features spacious living areas, abundant natural light, new appliances, updated toilets, and comfortable bedrooms. A welcoming front deck provides the perfect spot to relax and enjoy the peaceful neighborhood setting. Conveniently located within the park near community amenities, residents enjoy access to the clubhouse, pool and spa, fitness center, library, bocce court, and beautifully maintained grounds. Clos
Key facts
- Front deck
- Fitness center
- Bocce court
Tags
Property features AI
Finance
- Financial info: Monthly land lease amount: $1,827
- HOA & community: No association; Senior community
Exterior
- Parking: Covered parking for 2 vehicles
- Utilities: Public sewer
- Home design: Manufactured in park (double wide); Original condition; Made by SILVERCREST / DELAWARE WESTERN HOMES CORP
- Construction: Skirt: Other
- Exterior features: Located in a park community; Land lease in effect
Interior
- Kitchen: Dishwasher; Disposal; Free-standing electric oven; Microwave
- Bedrooms: 3 bedrooms
- Bathrooms: 2 full bathrooms; Shower stall(s)
- Heating & cooling: Central heating; Ceiling fan(s)
- Interior features: Cathedral ceiling; Great room; Formal dining room; Skylight(s); Island in kitchen; Breakfast area
- Laundry & utility: Washer included; Dryer included
Neighborhood map
What this means for you Summary
Snapshot
- This is a 3-bed/2.0-bath manufactured listed at $185k.
Deal economics
- At list price, monthly cash flow is $2k ($18k/yr) — positive.
- The deal already cash-flows at list — no discount required.
- Meets the 1% rule at list price ($3k rent vs $185k).
- Cap rate 16.2% vs local median 2.3% in Petaluma — top-decile yield for the area; either an underpriced asset or a hidden risk that comps aren't pricing in. Stress-test before assuming the spread holds.
Location & tenants
- Location reads 82/100 on livability (#33 in CA, #1,161 nationally) — a professional / high-income tenant draw. Strengths: amenities A+, commute A+, employment A+; Watch: cost of living F.
- Petaluma Joint Union High (suburban): math 44% / reading 60% proficiency, ranked #112 of 517 in CA (top 22%) — acceptable for families but not a draw, mixed tenant base, ~2y average lease; only 17% free/reduced lunch — higher-income household profile.
- Market conditions: Rents flat; 61 active listings in the ZIP; 6 comparable units currently listed for rent nearby; rentals leasing fast (median 14d on market — plan ~1-2 weeks tenant-placement turnaround); high-income renter base; 1,039 units permitted in Sonoma County in 2024 (185 in 5+ unit buildings).
- This rent runs 35% of the median local income ($114k/yr) — at the standard rent-burdened threshold; future hikes will face affordability resistance.
Forward outlook
- Local home prices are declining (-3.0%/yr); year-one equity from $1k of loan paydown is wiped out by about $6k of value loss. Plan a longer hold.
- Sonoma County population projected at +8% by 2050 — modest demand growth; plan on rents tracking national, not racing it.
- At projected returns (-3.0% appreciation + 0.6% rent growth), your $52k cash investment doubles in ~4 years — after that, you're playing with house money.
Negotiation context
- Only 2 days on market — expect competitive offers; lowballing is unlikely to land.
Questions for the listing agent
- Is there a deadline driving the sale (1031 exchange, divorce, estate, relocation)? That informs how much negotiation room exists.
- Schools are B-rated — typically a magnet for longer-tenancy family renters. What's the average tenant stay here, and is there a school-zone premium baked into asking?
- What's the average days-on-market for RENTAL listings here right now (not sales)? A rising rental-DOM trend means longer vacancies and softer asking-rent achievability than the comps imply.
- What's the recent tenant-quality profile in this submarket — average credit score on applications, eviction rate, late-payment / NSF rate, and stable-employment percentage? A property-management company in the area should have these aggregated.
- How much new for-sale + rental construction is in the pipeline within 1–3 miles? Heavy new supply typically softens prices + rents 12–24 months out; constrained supply supports both.
Investment metrics
- 1% rule
- 1.81% ✓
- Cap rate
- 16.19%
- Cash-on-cash
- 35.35%
- DSCR
- 2.57
- GRM
- 4.6
CMA / ARV
- ARV (on-the-fly)
- $264,364
- Comps found
- 12
Show comp detail 12 sales within ~0.75 mi
| Address | Dist | Beds/Ba | Sqft | Sold | Price | $/sf | Match |
|---|---|---|---|---|---|---|---|
| 126 Candlewood Dr | 0.07mi | 3/2.0 | 1,352 (-12%) | 14mo | $180,000 | $133 | 65 |
| 118 Candlewood Dr | 0.07mi | 3/2.0 | 1,325 (-14%) | 11mo | $150,000 | $113 | 64 |
| 93 W Napa Dr | 0.72mi | 2/2.0 (-1) | 1,536 (-0%) | 2mo | $181,100 | $118 | 60 |
| 518 Vina Rose Dr | 0.67mi | 2/2.0 (-1) | 1,560 (+2%) | 5mo | $234,460 | $150 | 57 |
| 6 N Napa Dr | 0.73mi | 3/2.0 | 1,593 (+4%) | 4mo | $300,500 | $189 | 56 |
| 43 E Napa Dr | 0.62mi | 2/2.0 (-1) | 1,548 (+1%) | 10mo | $180,000 | $116 | 56 |
| 5 N Napa Dr | 0.75mi | 2/2.0 (-1) | 1,539 (+0%) | 6mo | $317,000 | $206 | 55 |
| 57 W Napa Dr | 0.71mi | 2/2.0 (-1) | 1,445 (-6%) | 2mo | $315,000 | $218 | 51 |
| 82 W Napa Dr | 0.71mi | 3/2.0 | 1,583 (+3%) | 14mo | $335,000 | $212 | 50 |
| 1546 Royal Oak Dr | 0.31mi | 2/2.0 (-1) | 1,344 (-13%) | 13mo | $245,000 | $182 | 49 |
| 594 Sonoma Dr | 0.73mi | 3/2.0 | 1,368 (-11%) | 8mo | $235,000 | $172 | 41 |
| 1007 N Napa Ct | 0.74mi | 2/2.0 (-1) | 1,440 (-6%) | 11mo | $195,000 | $135 | 41 |
Match score weights: distance 35% · size 25% · config 20% · recency 20%. Top-matched comps best support the ARV.
Projected returns pro-forma
-3.0% appreciation · 0.61% rent growth · sell at horizon
- IRR
- 28.3%
- Equity multiple
- 2.14×
- Total profit
- $59,302
- Equity at exit
- $27,584
- IRR
- 34.4%
- Equity multiple
- 3.82×
- Total profit
- $145,864
- Equity at exit
- $15,995
Cash invested: $51,800 (down + closing). Projections, not guarantees.
Landlord ↔ Tenant lean methodology
- Overall (STATE)
- 18 Strongly Tenant-Friendly
- State California
- 18 Strongly Tenant-Friendly · D+13
- County
- — inherits STATE
- City
- — inherits STATE
ZIP-level market 94954
- Rents YoY
- 0.6%
- Active inventory
- 61
- Price-to-rent
- 4.6×
Monthly cashflow live
- Estimated rent
- $3,342 high interval (Pro) →
- Mortgage (P&I)
- −$970
- Tax from tax record
- −$67 /mo · $807/yr
- Insurance
- −$77
- HOA
- −$0
- Vacancy / Maint / Mgmt
- −$702
- Net cashflow
- $1,526
Break-even live
UW: 25.0% down · 7.5% · 30yr · 1.5% tax · 5.0% vac · 8.0% maint · 8.0% mgmt
Financing live
Cash to close
- Down payment
- $46,250
- Closing costs
- $5,550
- Reserves months
- —
- Total cash needed
- —
Loan-product check · same deal, 3 products live
Conventional
25% down · 7.5% · 30yr
- Down + closing
- —
- Monthly P&I
- —
- Monthly cashflow
- —
- DSCR
- —
- Eligible?
- —
Personal DTI + credit; lowest rate.
DSCR
20% down · 8.5% · 30yr
- Down + closing
- —
- Monthly P&I
- —
- Monthly cashflow
- —
- DSCR
- —
- Eligible?
- —
No personal income docs; deal must DSCR.
Hard money
10% down · 12.0% · 12mo
- Down + closing
- —
- Monthly P&I
- —
- Monthly cashflow
- —
- DSCR
- —
- Eligible?
- —
Short-term bridge; refi at stabilization.
Rent comps 6 comps
| Address | Beds | Baths | Sqft | Rent | $/sqft | DOM | Units | Dist |
|---|---|---|---|---|---|---|---|---|
| 1453 Capri Ave Petaluma, CA | 3.0 | 2.0 | 1368 | $3,200 | $2.34 | 13d | 1 | 0.23mi |
| 495 N McDowell Blvd Petaluma, CA | 1.0–2.0 | 1.0–2.0 | 1028 | $3,432 | $3.34 | 1d | 3 | 0.43mi |
| 132 Maria Dr Petaluma, CA | 3.0 | 2.0 | 1056 | $2,895 | $2.74 | 13d | 1 | 0.95mi |
| 1412 Mauro Pietro Dr #201 Petaluma, CA | 3.0 | 2.0 | 1165 | $2,950 | $2.53 | 13d | 1 | 0.95mi |
| 55 Maria Dr Petaluma, CA | 1.0–2.0 | 1.0–2.0 | 957 | $3,548 | $3.71 | 13d | 6 | 1.27mi |
| 1729 Kearny St Petaluma, CA | 4.0 | 2.0 | 1560 | $3,800 | $2.44 | 13d | 1 | 1.35mi |
Listing history 3 events
-
2026-06-18days on market $185,000 Active 2 DOM
-
2026-06-16remarks 699-char remark
-
2026-06-16$185,000 Active 1 DOM
ⓘ Source: listings_history table (triggers on properties + properties_extension) + one-shot
backfill from property_details.listing_events for pre-trigger history.
Tax reassessment forecast CA · Resets to sale price
- Current annual tax
- $807 · $67/mo
- Projected year-2 tax
- $1,406 · $117/mo
- Expected delta
- +$599/yr (+$50/mo · 74.3%)
ⓘ Screening estimate from a state-policy table — verify with the county assessor before closing.
Climate risk First Street
- Flood 1/10 Low FEMA zone X (unshaded) · 0% chance over 30 yrs
- Wildfire 3/10 Moderate
- Heat 4/10 Moderate 7 d/yr ≥91°F today · 16 d/yr by 30 yrs out
- Wind 1/10 Low
- Air quality 9/10 Extreme 20 unhealthy d/yr today · 20 by 30 yrs out
Nearby sold comps map
Loading sold comps map…
Walkable amenities ~0.75 mi
Loading nearby amenities…
Taxation est. · year 1
- Rental income
- $40,105
- − Mortgage interest
- −$10,363
- − Property taxes
- −$807
- − Insurance
- −$925
- − Repairs & maintenance
- −$3,208
- − Management
- −$3,208
- − Depreciation
- −$5,382
- Taxable income
- $16,212
- Est. tax owed @ 24.0%
- −$3,891
- After-tax cash flow
- $14,419/yr
For passive investors: Depreciation is non-cash, so a rental often shows a tax loss while cash-flowing — sheltering income. Rental losses are passive: they offset passive income freely, and up to $25,000/yr can offset ordinary (W-2) income if you actively participate and your MAGI is under $100k (phasing out to $0 by $150k); unused losses carry forward. On sale, claimed depreciation is recaptured at up to 25%, and gains may owe capital-gains tax (a 1031 exchange can defer both). Figures are a year-1 estimate at your 24.0% rate — not tax advice; consult a CPA.
Schools (NCES district)
- District
- Petaluma Joint Union High
- NCES district ID
- 0630250
- Math proficiency
- 44% ▬ 0.00%
- Reading proficiency
- 60% ▼ -2.00%
- Median HH income
- $78,473
- Composite
- 47.11/100
- National rank
- #2329
- State rank
- #112 of 517 in CA
Livability — Petaluma
- Score
- 82/100
- State rank
- #33
- US rank
- #1161
Category grades
Schools grade is shown separately in the Schools card above.
Census & demographics
- Census place
- Petaluma, CA
- County
- Sonoma County · 449,805 people
- City population
- 71,359
- Metro
- Santa Rosa-Petaluma, CA
- Population (ZIP)
- 37,574
- Household income
- $113,527
- Rent vs Own
- Severe rent burden
- 1421.0
Population outlook (Sonoma County) Hauer SSP2
- Today (2025)
- 539,935 people
- By 2030
- 554,870 · +2.8%
- By 2040
- 573,262 · +6.2%
- By 2050
- 580,715 · +7.6%
- By 2075
- 579,229 · +7.3%
- By 2100
- 547,835 · +1.5%
Race, ethnicity, and origin ACS 2023
- Neighborhood character
- Majority White (64%)
- Race & ethnicity
- White 64% Hispanic / Latino 23% Two or more races 16% Asian 4% Black 2% Native American 1%
- Hispanic origin (detail)
- Mexican 15%
- Common ancestry
- Lithuanian 4% Italian 4% Slovak 2%
- Foreign-born
- 17% · Canada, China, Vietnam
- Languages at home
- 78% English-only · Spanish 16% Other Indo-European 2% Tagalog/Filipino 1%
Political lean MEDSL · Sonoma
- 2024 margin
- Solid D (+46.2) · D 71.4% · R 25.2% · Other 3.3%
- 2008→2024 swing
- -3.4pp toward R · 2008: 49.6pp · 2024: 46.2pp
- All cycles
- 2024: D+46.2 2020: D+51.5 2016: D+47.9 2012: D+44.9 2008: D+49.6
Not yet ingested
- Civics
- —
Market trends
- HPI YoY
- ▼ -813.92%
- Current HPI
- 245.4729
- Rent YoY
- ▲ 0.61%
- Metro
- Santa Rosa-Petaluma, CA
- State GDP YoY
- ▲ 3.21%
- F500 in state
- 116
Industry mix (Fortune 500 HQ in CA)
| Industry | F500 HQs | Revenue |
|---|---|---|
| Technology | 27 | $1,492B |
|
||
| Financial Services | 3 | $174B |
|
||
| Retail | 3 | $44B |
|
||
| Insurance | 3 | $26B |
|
||
| Media / Entertainment | 2 | $115B |
|
||
| Pharmaceuticals / Biotech | 2 | $62B |
|
||
Price history
1 event — show timeline
- 2026-06-16 Listed $185,000 BAREIS
Property tax history
-2.9%/yrLatest (2025): $807 · +2.4% YoY. Source: county tax records.
Cash-flow waterfall
monthlySold comps — $/sqft
last 12 mo · ≤1 miLoading sold comps…