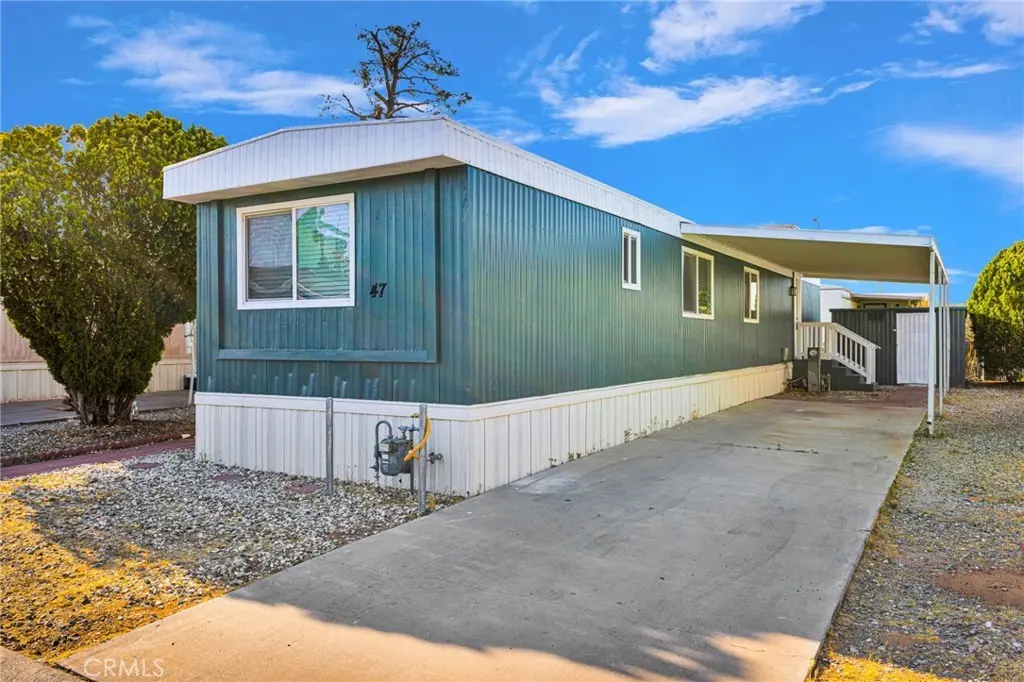
15252 Seneca Rd #47 · Victorville, CA
Flood risk 1/10 · Minimal
- FEMA flood zone
- X (unshaded)
- Chance of flooding over 30 yrs
- 0.0%
- Est. flood insurance / yr
- $507 – $1,088
Fire risk 5/10 · Moderate
- Est. fire insurance / yr
- $659 – $1,223
Heat risk 7/10 · Major
- Hot days now (above 99°F)
- 1 days/yr
- Hot days in 30 yrs
- 4 days/yr
Wind risk 1/10 · Minimal
- Chance of severe wind over 30 yrs
- —
Air-quality risk 9/10 · Severe
- Unhealthy air days now
- 22 days/yr
- Unhealthy air days in 30 yrs
- 28 days/yr
Risk factors via First Street. Map © Google.
Why this score? — see what drove the C+ grade
The composite is a weighted blend of 9 inputs, each scored 0–100. Each bar is that input's sub-score; the figure is the points it added to the 100-point composite (weight × sub-score).
- Cash flow +30.0/30.0
- 1% rule +10.0/10.0
- DSCR +10.0/10.0
- Rent growth +2.9/5.0
- Livability +2.7/5.0
- Condition / age +2.5/5.0
- Schools +2.2/10.0
- ARV discount +0.8/15.0
- Appreciation +0.0/10.0
$72,000
🖨 Deal sheet (PDF) 📄 Offer letter ✓ Due diligence
Listing remarks
* * * PRICE IMPROVEMENT * * * This is your opportunity to own a beautifully updated 2-bedroom, 2-bath mobile home priced under $100,000, an great value for all the upgrades and space this home has to offer! Step inside to an inviting open floor plan where the updated kitchen flows seamlessly into the spacious living room, creating the perfect setting for entertaining or simply enjoying everyday life. Fresh carpet, flooring, paint, and a remodeled kitchen give the home a bright, clean, and modern feel throughout. Large windows fill the home with plenty of natural light, adding warmth and charm to every room. The second bedroom features its own attached bathroom complete with a walk-in
Key facts
- Large windows
- Open floor plan
- Attached bathroom
Tags
Property features AI
Finance
- Other: Association amenities and rules: call for rules; pet rules and permitted types; security
- Financial info: Land lease for the park: $800 monthly (park-provided amount); Rent includes trash and water
- HOA & community: Gold West MHC park amenities: pool, spa, clubhouse, meeting room, gym/exercise room, tennis and pickleball, picnic and barbecue areas, dog park, common RV parking, street lighting, maintenance of grounds, trash service; Park rules and manager approval required; Onsite property management
Exterior
- Parking: Concrete driveway; Attached carport (1 space); One-car garage; Total parking for 2 vehicles; Common RV parking available in community
- Security: Card/code access; Carbon monoxide detector(s); Smoke detector; Gated community with automatic gate; Onsite property management
- Utilities: Public sewer; District/public water; Natural gas connected; Electricity connected; Cable connected; Sewer connected; Water connected
- Home design: Single-unit mobile home (Skyline model); Mobile dimensions approximately 12' x 64'; Mobile home remains on site; Turnkey condition; One story
- Construction: Pillar/post/pier foundation
- Exterior features: Metal roof; Awning; Covered front porch; Community heated pool; Patio; Chain link fencing; Level lot with street access; Rectangular lot shape; One shed; South-facing
Interior
- Kitchen: Garbage disposal; Microwave; Gas range; Kitchen open to family room; Laminate counters; Gas water heater
- Flooring: Vinyl; Carpet
- Bathrooms: One full bathroom; One 3/4 bathroom; Shower-in-tub, walk-in shower and bathtub features
- Heating & cooling: Central furnace heating; Evaporative cooling
- Interior features: Unfurnished; Recessed lighting; Open floor plan; Formica counters; Entry on El Dorado; One-level home
- Laundry & utility: Laundry inside
Neighborhood map
What this means for you Summary
Snapshot
- This is a 2-bed/2.0-bath manufactured listed at $72k.
Deal economics
- At list price, monthly cash flow is $1k ($13k/yr) — positive.
- The deal already cash-flows at list — no discount required.
- Meets the 1% rule at list price ($2k rent vs $72k).
- Recommended offer: $71k (1.5% below list) — sets the bar for market timing.
- Cap rate 24.0% vs local median 4.2% in Victorville — top-decile yield for the area; either an underpriced asset or a hidden risk that comps aren't pricing in. Stress-test before assuming the spread holds.
Location & tenants
- Location reads 54/100 on livability (#906 in CA) — a working-class tenant base; expect higher turnover. Strengths: housing A+; Watch: employment D+, schools D-, crime F.
- Victor Elementary (urban): math 25% / reading 25% proficiency, ranked #408 of 517 in CA (top 79%) — low school quality limits family demand, transient renter base, plan for 1-2y turnover; 70% free/reduced lunch — lower-income household profile, screen leases tightly.
- Market conditions: Rents rising (+1.7%/yr); 369 active listings in the ZIP; 3 comparable units currently listed for rent nearby; rentals leasing fast (median 2d on market — plan ~1-2 weeks tenant-placement turnaround); solid renter incomes; 5,458 units permitted in San Bernardino County in 2024 (1,500 in 5+ unit buildings).
Forward outlook
- Local home prices are declining (-3.0%/yr); year-one equity from $498 of loan paydown is wiped out by about $2k of value loss. Plan a longer hold.
- San Bernardino County population projected at +15% by 2050 — modest demand growth; plan on rents tracking national, not racing it.
- At projected returns (-3.0% appreciation + 1.7% rent growth), your $20k cash investment doubles in ~2 years — after that, you're playing with house money.
Negotiation context
- It's been on market 22 days — a 2% lower offer ($71k) is reasonable based on typical stale-listing flexibility.
Risks & watch-outs
- Climate carrying-cost: moderate wildfire risk; extreme-heat days projected 1→4/yr by 2055 (HVAC capex compounding) — expect insurance premiums to compound above CPI over the hold.
Questions for the listing agent
- Built in 1977 — when were the roof, HVAC, electrical panel, plumbing, and water heater last replaced?
- Is there a deadline driving the sale (1031 exchange, divorce, estate, relocation)? That informs how much negotiation room exists.
- Schools are D-rated, which usually means shorter tenancies and higher turnover. Who's the typical renter profile here, and what's been the actual vacancy rate?
- Crime grade is F in this area — have there been break-ins, vandalism, or insurance claims at this property in the last 3 years? What carrier currently insures it and at what premium?
- What's the average days-on-market for RENTAL listings here right now (not sales)? A rising rental-DOM trend means longer vacancies and softer asking-rent achievability than the comps imply.
- What's the recent tenant-quality profile in this submarket — average credit score on applications, eviction rate, late-payment / NSF rate, and stable-employment percentage? A property-management company in the area should have these aggregated.
- How much new for-sale + rental construction is in the pipeline within 1–3 miles? Heavy new supply typically softens prices + rents 12–24 months out; constrained supply supports both.
Investment metrics
- 1% rule
- 2.75% ✓
- Cap rate
- 24.03%
- Cash-on-cash
- 63.36%
- DSCR
- 3.82
- GRM
- 3.0
CMA / ARV
- ARV (on-the-fly)
- $62,640
- Comps found
- 4
Show comp detail 4 sales within ~0.75 mi
| Address | Dist | Beds/Ba | Sqft | Sold | Price | $/sf | Match |
|---|---|---|---|---|---|---|---|
| 15252 Seneca Rd #36 | 0.00mi | 2/2.0 | 744 (+3%) | 15mo | $65,000 | $87 | 82 |
| 15252 Seneca Rd #297 | 0.00mi | 2/2.0 | 800 (+11%) | 4mo | $85,000 | $106 | 78 |
| 15252 Seneca Rd #57 | 0.00mi | 2/1.0 | 780 (+8%) | 12mo | $50,000 | $64 | 72 |
| 15252 Seneca Rd #207 | 0.17mi | 1/1.0 (-1) | 672 (-7%) | 22mo | $45,000 | $67 | 54 |
Match score weights: distance 35% · size 25% · config 20% · recency 20%. Top-matched comps best support the ARV.
Projected returns pro-forma
-3.0% appreciation · 1.69% rent growth · sell at horizon
- IRR
- 60.9%
- Equity multiple
- 3.66×
- Total profit
- $53,582
- Equity at exit
- $10,735
- IRR
- 65.1%
- Equity multiple
- 7.14×
- Total profit
- $123,791
- Equity at exit
- $6,225
Cash invested: $20,160 (down + closing). Projections, not guarantees.
Landlord ↔ Tenant lean methodology
- Overall (STATE)
- 18 Strongly Tenant-Friendly
- State California
- 18 Strongly Tenant-Friendly · D+13
- County
- — inherits STATE
- City
- — inherits STATE
ZIP-level market 92392
- Home prices YoY
- -9.0%
- Rents YoY
- 1.7%
- Active inventory
- 369
- Price-to-rent
- 3.0×
Monthly cashflow live
- Estimated rent
- $1,977 medium interval (Pro) →
- Mortgage (P&I)
- −$378
- Tax est. 1.5%
- −$90 /mo · $1,080/yr
- Insurance
- −$30
- HOA
- −$0
- Vacancy / Maint / Mgmt
- −$415
- Net cashflow
- $1,064
Break-even live
Sensitivity live
| Price | -10% $1,114 | -5% $1,089 | +0% $1,064 | +5% $1,040 | +10% $1,015 |
|---|---|---|---|---|---|
| Rent | -10% $908 | -5% $986 | +0% $1,064 | +5% $1,142 | +10% $1,221 |
| Rate | -1.0pp $1,101 | -0.5pp $1,083 | base $1,064 | +0.5pp $1,046 | +1.0pp $1,027 |
UW: 25.0% down · 7.5% · 30yr · 1.5% tax · 5.0% vac · 8.0% maint · 8.0% mgmt
Financing live
Cash to close
- Down payment
- $18,000
- Closing costs
- $2,160
- Reserves months
- —
- Total cash needed
- —
Loan-product check · same deal, 3 products live
Conventional
25% down · 7.5% · 30yr
- Down + closing
- —
- Monthly P&I
- —
- Monthly cashflow
- —
- DSCR
- —
- Eligible?
- —
Personal DTI + credit; lowest rate.
DSCR
20% down · 8.5% · 30yr
- Down + closing
- —
- Monthly P&I
- —
- Monthly cashflow
- —
- DSCR
- —
- Eligible?
- —
No personal income docs; deal must DSCR.
Hard money
10% down · 12.0% · 12mo
- Down + closing
- —
- Monthly P&I
- —
- Monthly cashflow
- —
- DSCR
- —
- Eligible?
- —
Short-term bridge; refi at stabilization.
Rent comps 3 comps
| Address | Beds | Baths | Sqft | Rent | $/sqft | DOM | Units | Dist |
|---|---|---|---|---|---|---|---|---|
| 15230 Seneca Rd Victorville, CA | 1.0–3.0 | 1.0–2.0 | 805 | $1,850 | $2.30 | 2d | 12 | 0.04mi |
| 16340 Villa Dr Apt 1 Victorville, CA | 1.0 | 1.0 | 550 | $1,250 | $2.27 | 2d | 1 | 1.36mi |
| 14715 Mesa Dr Unit B Victorville, CA | 1.0 | 1.0 | 550 | $1,450 | $2.64 | 10d | 1 | 1.39mi |
Listing history 15 events
-
2026-06-18days on market $72,000 Active 22 DOM
-
2026-06-17days on market $72,000 Active 21 DOM
-
2026-06-16days on market $72,000 Active 20 DOM
-
2026-06-15days on market $72,000 Active 19 DOM
-
2026-06-13days on market $72,000 Active 17 DOM
-
2026-06-13pricedays on market $72,000 Active 16 DOM
-
2026-06-09days on market $75,000 Active 13 DOM
-
2026-06-08days on market $75,000 Active 12 DOM
-
2026-06-07days on market $75,000 Active 11 DOM
-
2026-06-04days on market $75,000 Active 8 DOM
-
2026-06-03days on market $75,000 Active 7 DOM
-
2026-06-02days on market $75,000 Active 6 DOM
-
2026-06-01days on market $75,000 Active 5 DOM
-
2026-05-31days on market $75,000 Active 4 DOM
-
2026-05-27$75,000 Active
ⓘ Source: listings_history table (triggers on properties + properties_extension) + one-shot
backfill from property_details.listing_events for pre-trigger history.
Climate risk First Street
- Flood 1/10 Low FEMA zone X (unshaded) · 0% chance over 30 yrs
- Wildfire 5/10 Major
- Heat 7/10 Severe 1 d/yr ≥99°F today · 4 d/yr by 30 yrs out
- Wind 1/10 Low
- Air quality 9/10 Extreme 22 unhealthy d/yr today · 28 by 30 yrs out
Nearby sold comps map
Loading sold comps map…
Walkable amenities ~0.75 mi
Loading nearby amenities…
Taxation est. · year 1
- Rental income
- $23,726
- − Mortgage interest
- −$4,033
- − Property taxes
- −$1,080
- − Insurance
- −$360
- − Repairs & maintenance
- −$1,898
- − Management
- −$1,898
- − Depreciation
- −$2,095
- Taxable income
- $12,362
- Est. tax owed @ 24.0%
- −$2,967
- After-tax cash flow
- $9,806/yr
For passive investors: Depreciation is non-cash, so a rental often shows a tax loss while cash-flowing — sheltering income. Rental losses are passive: they offset passive income freely, and up to $25,000/yr can offset ordinary (W-2) income if you actively participate and your MAGI is under $100k (phasing out to $0 by $150k); unused losses carry forward. On sale, claimed depreciation is recaptured at up to 25%, and gains may owe capital-gains tax (a 1031 exchange can defer both). Figures are a year-1 estimate at your 24.0% rate — not tax advice; consult a CPA.
Schools (NCES district)
- District
- Victor Elementary
- NCES district ID
- 0641040
- Math proficiency
- 25% ▬ 0.00%
- Reading proficiency
- 25% ▼ -9.00%
- Median HH income
- $44,949
- Composite
- 21.58/100
- National rank
- #8304
- State rank
- #408 of 517 in CA
Livability — Victorville
- Score
- 54/100
- State rank
- #906
- US rank
- #24038
Category grades
Schools grade is shown separately in the Schools card above.
Census & demographics
- Census place
- Victorville, CA
- County
- San Bernardino County · 2,030,291 people
- City population
- 154,418
- Metro
- Riverside-San Bernardino-Ontario, CA
- Population (ZIP)
- 65,429
- Household income
- $87,681
- Rent vs Own
- Severe rent burden
- 1879.0
Population outlook (San Bernardino County) Hauer SSP2
- Today (2025)
- 2,300,329 people
- By 2030
- 2,378,907 · +3.4%
- By 2040
- 2,523,137 · +9.7%
- By 2050
- 2,642,388 · +14.9%
- By 2075
- 2,880,769 · +25.2%
- By 2100
- 2,909,436 · +26.5%
Race, ethnicity, and origin ACS 2023
- Neighborhood character
- Diverse neighborhood (Simpson 0.62)
- Race & ethnicity
- Hispanic / Latino 55% Two or more races 24% White 22% Black 14% Asian 4% Native American 2%
- Hispanic origin (detail)
- Mexican 47%
- Common ancestry
- Portuguese 1% Romanian 1%
- Foreign-born
- 20% · Canada, China, Vietnam
- Languages at home
- 57% English-only · Spanish 38% Tagalog/Filipino 2% Other Indo-European 1%
Political lean MEDSL · San Bernardino
- 2024 margin
- Toss-up / Even · D 47.5% · R 49.7% · Other 2.8%
- 2008→2024 swing
- -8.5pp toward R · 2008: 6.3pp · 2024: -2.1pp
- All cycles
- 2024: R+2.1 2020: D+10.7 2016: D+9.8 2012: D+5.4 2008: D+6.3
Not yet ingested
- Civics
- —
Market trends
- HPI YoY
- ▼ -35.57%
- Current HPI
- 358.5152
- Rent YoY
- ▲ 1.69%
- Metro
- Riverside-San Bernardino-Ontario, CA
- State GDP YoY
- ▲ 3.21%
- F500 in state
- 116
Industry mix (Fortune 500 HQ in CA)
| Industry | F500 HQs | Revenue |
|---|---|---|
| Technology | 27 | $1,492B |
|
||
| Financial Services | 3 | $174B |
|
||
| Retail | 3 | $44B |
|
||
| Insurance | 3 | $26B |
|
||
| Media / Entertainment | 2 | $115B |
|
||
| Pharmaceuticals / Biotech | 2 | $62B |
|
||
Price history
1 event — show timeline
- 2026-05-27 Listed $75,000 CRMLS
Property tax history
-3.6%/yrLatest (2015): $90 · +0.0% YoY. Source: county tax records.
Cash-flow waterfall
monthlySold comps — $/sqft
last 12 mo · ≤1 miLoading sold comps…