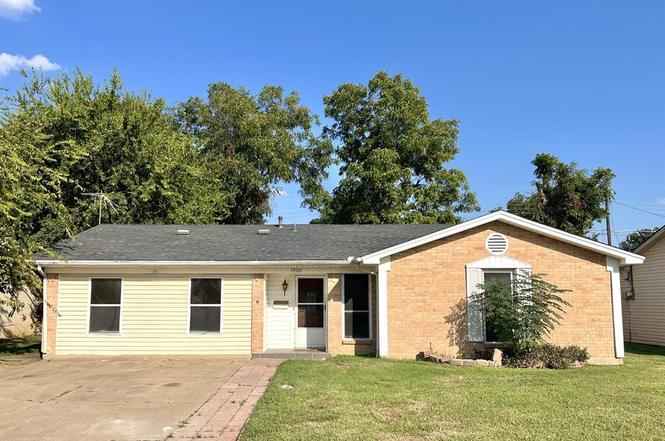
1900 Robinson St · Irving, TX
Flood risk 1/10 · Minimal
- FEMA flood zone
- X (unshaded)
- Chance of flooding over 30 yrs
- 0.0%
- Est. flood insurance / yr
- $507 – $1,088
Fire risk 1/10 · Minimal
- Est. fire insurance / yr
- $1,222 – $2,270
Heat risk 7/10 · Major
- Hot days now (above 110°F)
- 7 days/yr
- Hot days in 30 yrs
- 23 days/yr
Wind risk 6/10 · Moderate
- Chance of severe wind over 30 yrs
- 27.0%
Air-quality risk 3/10 · Minor
- Unhealthy air days now
- 2 days/yr
- Unhealthy air days in 30 yrs
- 3 days/yr
Risk factors via First Street. Map © Google.
Why this score? — see what drove the D grade
The composite is a weighted blend of 9 inputs, each scored 0–100. Each bar is that input's sub-score; the figure is the points it added to the 100-point composite (weight × sub-score).
- ARV discount +15.0/15.0
- Cash flow +9.6/30.0
- Livability +4.0/5.0
- 1% rule +3.7/10.0
- Rent growth +3.4/5.0
- DSCR +2.7/10.0
- Condition / age +2.5/5.0
- Schools +1.9/10.0
- Appreciation +0.0/10.0
$300,000
🖨 Deal sheet 📄 Offer letter ✓ Due diligence
Listing remarks MLS
HUD home sold in as is condition. Great 4 bedroom 2 bath home with an open floor plan. Home needs little TLC and shows great. Bring all your buyers to this home and take advantage of this great price.
Key facts
- Large dining room
- Converted garage
- Private access
Tags
Neighborhood map
What this means for you Summary
Snapshot
- This is a 3-bed/1.5-bath single-family listed at $300k.
Deal economics
- At list price, monthly cash flow is $-203 ($-2k/yr) — negative.
- To cash-flow at today's rent, offer at most $264k (12.0% below list).
- To meet the 1% rule (rent ≥ 1% of price), the offer needs to be $261k (13.0% below list).
- Recommended offer: $261k (13.0% below list) — sets the bar for 1% rule.
- Cap rate 5.5% vs local median 2.6% in Irving — top-decile yield for the area; either an underpriced asset or a hidden risk that comps aren't pricing in. Stress-test before assuming the spread holds.
Location & tenants
- Location reads 80/100 on livability (#45 in TX, #1,913 nationally) — a professional / high-income tenant draw. Strengths: commute A+, cost of living A+, housing A+; Watch: amenities C-.
- Irving ISD (urban): math 19% / reading 25% proficiency, ranked #751 of 826 in TX (top 91%) — low school quality limits family demand, transient renter base, plan for 1-2y turnover; 72% free/reduced lunch — lower-income household profile, screen leases tightly.
- Zoned schools: Townley El (math 17% / reading 21%, grade F, #3,739 of 4,322 statewide, top 87%, 648 students, 87% FRL).
- Market conditions: Rents rising (+3.5%/yr); 101 active listings in the ZIP; 13 comparable units currently listed for rent nearby; rentals at typical pace (median 22d on market — plan ~3-4 weeks tenant-placement turnaround); 12,577 units permitted in Dallas County in 2024 (6,829 in 5+ unit buildings).
- This rent runs 44% of the median local income ($72k/yr) — at the standard rent-burdened threshold; future hikes will face affordability resistance.
Forward outlook
- Local home prices are declining (-3.0%/yr); year-one equity from $2k of loan paydown is wiped out by about $9k of value loss. Plan a longer hold.
- Dallas County population projected at +35% by 2050 — long-run rental-demand tailwind backs the buy-and-hold thesis.
Negotiation context
- It's been on market 129 days — a 12% lower offer ($264k) is reasonable based on typical stale-listing flexibility.
- 3 sale attempts since 13y ago with the ask held roughly flat each time — persistent listings suggest the price (not the market) is what's stuck; bring a comps-based counter.
Risks & watch-outs
- Climate carrying-cost: major wind risk, 27% chance of damaging wind over 30y; extreme-heat days projected 7→23/yr by 2055 (HVAC capex compounding) — expect insurance premiums to compound above CPI over the hold.
Questions for the listing agent
- What do current leases actually rent for vs. the listed asking? Can we see a recent rent roll and the last 12 months of T-12 income?
- It's been on market 129 days. Have you received any prior offers? Is the seller open to a 13% concession, seller financing, or rate buy-down credit?
- Built in 1967 — when were the roof, HVAC, electrical panel, plumbing, and water heater last replaced?
- Why hasn't it sold? Are there any deal-killer items the seller is aware of (foundation, flood, title, zoning, code violations)?
- Is there a deadline driving the sale (1031 exchange, divorce, estate, relocation)? That informs how much negotiation room exists.
- The area grade is low — what's the realistic commute time and amenity access for the typical tenant pool here? Any planned neighborhood developments (good or bad) we should know about?
- What's the average days-on-market for RENTAL listings here right now (not sales)? A rising rental-DOM trend means longer vacancies and softer asking-rent achievability than the comps imply.
- What's the recent tenant-quality profile in this submarket — average credit score on applications, eviction rate, late-payment / NSF rate, and stable-employment percentage? A property-management company in the area should have these aggregated.
- How much new for-sale + rental construction is in the pipeline within 1–3 miles? Heavy new supply typically softens prices + rents 12–24 months out; constrained supply supports both.
Investment metrics
- 1% rule
- 0.87% ✗
- Cap rate
- 5.48%
- Cash-on-cash
- -2.90%
- DSCR
- 0.87
- GRM
- 9.6
CMA / ARV
- ARV (on-the-fly)
- $413,030
- Comps found
- 9
Show comp detail 9 sales within ~0.75 mi
| Address | Dist | Beds/Ba | Sqft | Sold | Price | $/sf | Match |
|---|---|---|---|---|---|---|---|
| 1104 Mayleaf Dr | 0.56mi | 3/2.5 | 2,016 (+0%) | 4mo | $349,900 | $174 | 65 |
| 805 Cove Holw | 0.32mi | 3/2.0 | 1,800 (-10%) | 1mo | $370,000 | $206 | 65 |
| 305 W 14th St | 0.34mi | 4/2.0 (+1) | 1,905 (-5%) | 15mo | $326,000 | $171 | 56 |
| 1215 Katelyn Ct | 0.64mi | 3/2.5 | 2,074 (+3%) | 16mo | $429,000 | $207 | 47 |
| 1009 W Oakdale Rd | 0.47mi | 4/2.5 (+1) | 1,929 (-4%) | 22mo | $424,900 | $220 | 44 |
| 1113 Rusdell Dr | 0.58mi | 4/2.0 (+1) | 2,240 (+12%) | 3mo | $384,000 | $171 | 44 |
| 117 W 14th St | 0.38mi | 4/2.0 (+1) | 1,749 (-13%) | 19mo | $299,999 | $172 | 38 |
| 1606 Westwood Dr | 0.63mi | 3/2.0 | 1,738 (-13%) | 14mo | $375,000 | $216 | 35 |
| 411 Abraham Ct | 0.56mi | 4/2.0 (+1) | 1,827 (-9%) | 22mo | $430,000 | $235 | 34 |
Match score weights: distance 35% · size 25% · config 20% · recency 20%. Top-matched comps best support the ARV.
Projected returns pro-forma
-3.0% appreciation · 3.45% rent growth · sell at horizon
- IRR
- -20.5%
- Equity multiple
- 0.28×
- Total profit
- $-60,203
- Equity at exit
- $44,731
- IRR
- -12.5%
- Equity multiple
- 0.24×
- Total profit
- $-63,524
- Equity at exit
- $25,939
Cash invested: $84,000 (down + closing). Projections, not guarantees.
Landlord ↔ Tenant lean methodology
- Overall (STATE)
- 87 Strongly Landlord-Friendly
- State Texas
- 87 Strongly Landlord-Friendly · R+5
- County
- — inherits STATE
- City
- — inherits STATE
ZIP-level market 75060
- Rents YoY
- 3.5%
- Active inventory
- 101
- Price-to-rent
- 9.6×
Monthly cashflow live
- Estimated rent
- $2,610 high interval (Pro) →
- Mortgage (P&I)
- −$1,573
- Tax from tax record
- −$567 /mo · $6,803/yr
- Insurance
- −$125
- HOA
- −$0
- Vacancy / Maint / Mgmt
- −$548
- Net cashflow
- $-203
Break-even live
UW: 25.0% down · 7.5% · 30yr · 1.5% tax · 5.0% vac · 8.0% maint · 8.0% mgmt
Financing live
Cash to close
- Down payment
- $75,000
- Closing costs
- $9,000
- Reserves months
- —
- Total cash needed
- —
Loan-product check · same deal, 3 products live
Conventional
25% down · 7.5% · 30yr
- Down + closing
- —
- Monthly P&I
- —
- Monthly cashflow
- —
- DSCR
- —
- Eligible?
- —
Personal DTI + credit; lowest rate.
DSCR
20% down · 8.5% · 30yr
- Down + closing
- —
- Monthly P&I
- —
- Monthly cashflow
- —
- DSCR
- —
- Eligible?
- —
No personal income docs; deal must DSCR.
Hard money
10% down · 12.0% · 12mo
- Down + closing
- —
- Monthly P&I
- —
- Monthly cashflow
- —
- DSCR
- —
- Eligible?
- —
Short-term bridge; refi at stabilization.
Rent comps 13 comps
| Address | Beds | Baths | Sqft | Rent | $/sqft | DOM | Units | Dist |
|---|---|---|---|---|---|---|---|---|
| 1208 Mayleaf Dr Unit 1019631P Irving, TX | 3.0 | 2.0 | 2088 | $14,729 | $7.05 | 24d | 1 | 0.65mi |
| 1208 Mayleaf Dr Irving, TX | 3.0 | 2.0 | 2093 | $7,400 | $3.54 | 1d | 1 | 0.65mi |
| 2014 Laurel Oaks Dr Irving, TX | 4.0 | 2.0 | 1408 | $2,550 | $1.81 | 12d | 1 | 0.72mi |
| 703 E Shady Grove Rd Irving, TX | 3.0 | 2.5 | 1657 | $1,795 | $1.08 | 24d | 1 | 0.79mi |
| 1224 Parkwood Pl Irving, TX | 3.0 | 2.0 | 1417 | $2,150 | $1.52 | 7d | 1 | 0.87mi |
| 512 Connor Ct Irving, TX | 4.0 | 3.0 | 2244 | $3,100 | $1.38 | 3d | 1 | 0.99mi |
| 508 S O Connor Rd Irving, TX | 4.0 | 3.0 | 2244 | $3,100 | $1.38 | 3d | 1 | 0.99mi |
| 1403 Lakeshore Dr Irving, TX | 4.0 | 2.5 | 2906 | $3,350 | $1.15 | 7d | 1 | 1.07mi |
| 1901 Cordova Bnd Unit 1514801P Irving, TX | 4.0 | 3.0 | 2217 | $10,608 | $4.78 | 21d | 1 | 1.13mi |
| 2001 Pebblebrook Trl Irving, TX | 4.0 | 3.5 | 2148 | $3,600 | $1.68 | 24d | 1 | 1.19mi |
| 2017 Meadow Lark Unit 1056404P Irving, TX | 4.0 | 2.0 | 1593 | $8,232 | $5.17 | 43d | 1 | 1.28mi |
| 911 Tipton Rd Irving, TX | 3.0 | 2.0 | 1642 | $2,500 | $1.52 | 24d | 1 | 1.42mi |
| 2121 Spanish Trl Irving, TX | 3.0 | 2.0 | 1670 | $2,400 | $1.44 | 21d | 1 | 1.44mi |
Listing history 12 events
-
2026-04-09status Pending
-
2026-03-31historical Active Option Contract
-
2026-02-10price $300,000
-
2025-12-17status Active
-
2025-10-17status Pending
-
2025-10-13historical Active Option Contract
-
2025-10-01$315,000 Active
-
2021-04-02soldstatus
-
2013-12-28soldstatus Closed 200-char remark
Show marketing remark (200 chars)
HUD home sold in as is condition. Great 4 bedroom 2 bath home with an open floor plan. Home needs little TLC and shows great. Bring all your buyers to this home and take advantage of this great price.
-
2013-10-12status Pending 200-char remark
Show marketing remark (200 chars)
HUD home sold in as is condition. Great 4 bedroom 2 bath home with an open floor plan. Home needs little TLC and shows great. Bring all your buyers to this home and take advantage of this great price.
-
2013-10-02$75,000 Active 200-char remark
Show marketing remark (200 chars)
HUD home sold in as is condition. Great 4 bedroom 2 bath home with an open floor plan. Home needs little TLC and shows great. Bring all your buyers to this home and take advantage of this great price.
-
2002-07-11soldstatus
ⓘ Source: listings_history table (triggers on properties + properties_extension) + one-shot
backfill from property_details.listing_events for pre-trigger history.
Tax reassessment forecast TX · Resets to sale price
- Current annual tax
- $6,803 · $567/mo
- Projected year-2 tax
- $6,803 · $567/mo
- Expected delta
- $0/yr ($0/mo · -0.0%)
ⓘ Screening estimate from a state-policy table — verify with the county assessor before closing.
Climate risk First Street
- Flood 1/10 Low FEMA zone X (unshaded) · 0% chance over 30 yrs
- Wildfire 1/10 Low
- Heat 7/10 Severe 7 d/yr ≥110°F today · 23 d/yr by 30 yrs out
- Wind 6/10 Major 27% chance of damaging wind over 30 yrs
- Air quality 3/10 Moderate 2 unhealthy d/yr today · 3 by 30 yrs out
Nearby sold comps map
Loading sold comps map…
Walkable amenities ~0.75 mi
Loading nearby amenities…
Taxation est. · year 1
- Rental income
- $31,323
- − Mortgage interest
- −$16,805
- − Property taxes
- −$6,803
- − Insurance
- −$1,500
- − Repairs & maintenance
- −$2,506
- − Management
- −$2,506
- − Depreciation
- −$8,727
- Taxable loss
- −$7,524
- Est. tax savings @ 24.0%
- +$1,806
- After-tax cash flow
- $-631/yr
For passive investors: Depreciation is non-cash, so a rental often shows a tax loss while cash-flowing — sheltering income. Rental losses are passive: they offset passive income freely, and up to $25,000/yr can offset ordinary (W-2) income if you actively participate and your MAGI is under $100k (phasing out to $0 by $150k); unused losses carry forward. On sale, claimed depreciation is recaptured at up to 25%, and gains may owe capital-gains tax (a 1031 exchange can defer both). Figures are a year-1 estimate at your 24.0% rate — not tax advice; consult a CPA.
Schools (NCES district)
- District
- Irving ISD
- NCES district ID
- 4824420
- Math proficiency
- 19% ▼ -28.00%
- Reading proficiency
- 25% ▼ -11.00%
- Median HH income
- $44,870
- Composite
- 19.06/100
- National rank
- #8840
- State rank
- #751 of 826 in TX
Livability — Irving
- Score
- 80/100
- State rank
- #45
- US rank
- #1913
Category grades
Schools grade is shown separately in the Schools card above.
Census & demographics
- Census place
- Irving, TX
- County
- Dallas County · 2,612,404 people
- City population
- 258,488
- Metro
- Dallas-Fort Worth-Arlington, TX
- Population (ZIP)
- 47,591
- Household income
- $71,575
- Rent vs Own
- Severe rent burden
- 1049.0
Population outlook (Dallas County) Hauer SSP2
- Today (2025)
- 2,979,839 people
- By 2030
- 3,191,823 · +7.1%
- By 2040
- 3,619,611 · +21.5%
- By 2050
- 4,026,915 · +35.1%
- By 2075
- 4,957,073 · +66.4%
- By 2100
- 5,508,725 · +84.9%
Race, ethnicity, and origin ACS 2023
- Neighborhood character
- Predominantly Hispanic (68%)
- Race & ethnicity
- Hispanic / Latino 68% Two or more races 21% White 19% Asian 6% Black 5%
- Hispanic origin (detail)
- Mexican 48%
- Common ancestry
- Lithuanian 1% Italian 1%
- Foreign-born
- 39% · Canada, Vietnam
- Languages at home
- 36% English-only · Spanish 58% Other Asian/Pacific 3% Other Indo-European 1%
Political lean MEDSL · Dallas
- 2024 margin
- Strong D (+22.2) · D 60.2% · R 38.0% · Other 1.8%
- 2008→2024 swing
- +6.9pp toward D · 2008: 15.3pp · 2024: 22.2pp
- All cycles
- 2024: D+22.2 2020: D+31.6 2016: D+26.2 2012: D+15.4 2008: D+15.3
Not yet ingested
- Civics
- —
Market trends
- HPI YoY
- ▼ -270.10%
- Current HPI
- 337.7965
- Rent YoY
- ▲ 3.45%
- Metro
- Dallas-Fort Worth-Arlington, TX
- State GDP YoY
- ▲ 3.95%
- F500 in state
- 110
Industry mix (Fortune 500 HQ in TX)
| Industry | F500 HQs | Revenue |
|---|---|---|
| Energy | 16 | $1,198B |
|
||
| Technology | 5 | $198B |
|
||
| Engineering / Construction | 4 | $72B |
|
||
| Energy Services | 3 | $60B |
|
||
| Utilities | 3 | $41B |
|
||
| Healthcare | 2 | $330B |
|
||
Price history
+300.0% since first listed12 events — show timeline
- 2026-04-09 Pending — NTREIS
- 2026-03-31 Contingent — NTREIS
- 2026-02-10 Price Changed $300,000 NTREIS
- 2025-12-17 Relisted — NTREIS
- 2025-10-17 Pending — NTREIS
- 2025-10-13 Contingent — NTREIS
- 2025-10-01 Listed $315,000 NTREIS
- 2021-04-02 Sold (Public Records) — Public Records
- 2013-12-28 Sold (MLS) — NTREIS
- 2013-10-12 Pending — NTREIS
- 2013-10-02 Listed $75,000 NTREIS
- 2002-07-11 Sold (Public Records) — Public Records
Property tax history
+5.1%/yrLatest (2025): $6,803 · +0.0% YoY. Source: county tax records.
Cash-flow waterfall
monthlySold comps — $/sqft
last 12 mo · ≤1 miLoading sold comps…