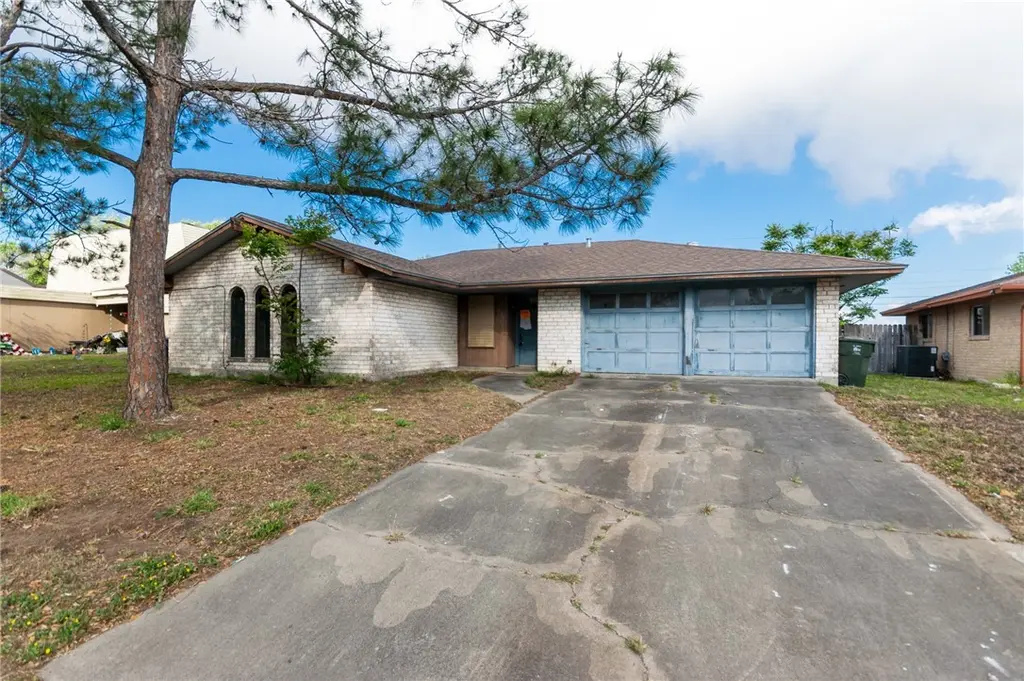
1037 Comal St · Corpus Christi, TX
Flood risk 1/10 · Minimal
- FEMA flood zone
- X (unshaded)
- Chance of flooding over 30 yrs
- 0.0%
- Est. flood insurance / yr
- $507 – $1,088
Fire risk 3/10 · Minor
- Est. fire insurance / yr
- $1,222 – $2,270
Heat risk 10/10 · Severe
- Hot days now (above 108°F)
- 7 days/yr
- Hot days in 30 yrs
- 24 days/yr
Wind risk 9/10 · Severe
- Chance of severe wind over 30 yrs
- 99.0%
Air-quality risk 1/10 · Minimal
- Unhealthy air days now
- 0 days/yr
- Unhealthy air days in 30 yrs
- 0 days/yr
Risk factors via First Street. Map © Google.
Why this score? — see what drove the C- grade
The composite is a weighted blend of 9 inputs, each scored 0–100. Each bar is that input's sub-score; the figure is the points it added to the 100-point composite (weight × sub-score).
- ARV discount +14.6/15.0
- Cash flow +13.0/30.0
- Appreciation +5.3/10.0
- 1% rule +4.6/10.0
- DSCR +3.9/10.0
- Livability +3.9/5.0
- Schools +2.8/10.0
- Rent growth +2.5/5.0
- Condition / age +2.5/5.0
$128,250
🖨 Deal sheet 📄 Offer letter ✓ Due diligence
Listing remarks MLS
Three bedroom two bathroom brick home in Corpus Christi, Texas with over 1,400 square feet of living space, split bedrooms, built in bookshelf, large backyard with covered patio and much more! Come view today and make this into your forever home.
Key facts
- 8,377 sq ft lot
- 2 garage spots
- Built 1971
Neighborhood map
What this means for you Summary
Snapshot
- This is a 3-bed/2.0-bath single-family listed at $128k.
Deal economics
- At list price, monthly cash flow is $-8 ($-98/yr) — negative.
- To cash-flow at today's rent, offer at most $127k (1.1% below list).
- To meet the 1% rule (rent ≥ 1% of price), the offer needs to be $124k (3.7% below list).
- Recommended offer: $121k (6.0% below list) — sets the bar for market timing.
- Cap rate 6.2% vs local median 3.6% in Corpus Christi — top-decile yield for the area; either an underpriced asset or a hidden risk that comps aren't pricing in. Stress-test before assuming the spread holds.
Location & tenants
- Location reads 78/100 on livability (#66 in TX, #2,404 nationally) — a middle-class / working-renter tenant base. Strengths: commute A+, cost of living A+, housing A+; Watch: crime F.
- Corpus Christi ISD (urban): math 31% / reading 35% proficiency, ranked #562 of 826 in TX (top 68%) — families likely to look elsewhere, expect single-tenant / working-renter base with shorter leases; 63% free/reduced lunch — lower-income household profile, screen leases tightly.
- Market conditions: 9 active listings in the ZIP; 2 comparable units currently listed for rent nearby; 1,397 units permitted in Nueces County in 2024 (47 in 5+ unit buildings).
Forward outlook
- In year one you build about $2k of equity ($886 loan paydown + $672 appreciation (0.5% local appreciation)).
- Nueces County population projected at +36% by 2050 — long-run rental-demand tailwind backs the buy-and-hold thesis.
Negotiation context
- It's been on market 70 days — a 6% lower offer ($121k) is reasonable based on typical stale-listing flexibility.
- Current owner paid $53k; list at $128k implies a 140% gain — meaningful room to come down on a strong offer.
Risks & watch-outs
- Climate carrying-cost: severe wind risk, 99% chance of damaging wind over 30y; extreme-heat days projected 7→24/yr by 2055 (HVAC capex compounding) — expect insurance premiums to compound above CPI over the hold.
Questions for the listing agent
- What do current leases actually rent for vs. the listed asking? Can we see a recent rent roll and the last 12 months of T-12 income?
- It's been on market 70 days. Have you received any prior offers? Is the seller open to a 6% concession, seller financing, or rate buy-down credit?
- Built in 1971 — when were the roof, HVAC, electrical panel, plumbing, and water heater last replaced?
- Why hasn't it sold? Are there any deal-killer items the seller is aware of (foundation, flood, title, zoning, code violations)?
- Is there a deadline driving the sale (1031 exchange, divorce, estate, relocation)? That informs how much negotiation room exists.
- Crime grade is F in this area — have there been break-ins, vandalism, or insurance claims at this property in the last 3 years? What carrier currently insures it and at what premium?
- What's the average days-on-market for RENTAL listings here right now (not sales)? A rising rental-DOM trend means longer vacancies and softer asking-rent achievability than the comps imply.
- What's the recent tenant-quality profile in this submarket — average credit score on applications, eviction rate, late-payment / NSF rate, and stable-employment percentage? A property-management company in the area should have these aggregated.
- How much new for-sale + rental construction is in the pipeline within 1–3 miles? Heavy new supply typically softens prices + rents 12–24 months out; constrained supply supports both.
Investment metrics
- 1% rule
- 0.96% ✗
- Cap rate
- 6.22%
- Cash-on-cash
- -0.27%
- DSCR
- 0.99
- GRM
- 8.7
CMA / ARV
- ARV (median comp)
- $152,212
- List price
- $128,250
- Delta
- -15.74%
- Verdict
- UNDERPRICED
- Comps
- 20 within 1.0 mi
Show comp detail 3 sales within ~0.75 mi
| Address | Dist | Beds/Ba | Sqft | Sold | Price | $/sf | Match |
|---|---|---|---|---|---|---|---|
| 5813 Llano Dr | 0.13mi | 3/2.0 | 1,542 (+8%) | 2mo | $200,000 | $130 | 79 |
| 5809 Skylark Dr | 0.38mi | 3/2.0 | 1,395 (-2%) | 22mo | $180,000 | $129 | 60 |
| 5722 Hampshire | 0.55mi | 3/1.0 | 1,531 (+7%) | 23mo | $169,000 | $110 | 39 |
Match score weights: distance 35% · size 25% · config 20% · recency 20%. Top-matched comps best support the ARV.
Projected returns pro-forma
0.52% appreciation · 3.0% rent growth · sell at horizon
- IRR
- -0.6%
- Equity multiple
- 0.97×
- Total profit
- $-999
- Equity at exit
- $40,635
- IRR
- 4.7%
- Equity multiple
- 1.54×
- Total profit
- $19,296
- Equity at exit
- $51,645
Cash invested: $35,910 (down + closing). Projections, not guarantees.
Landlord ↔ Tenant lean methodology
- Overall (STATE)
- 87 Strongly Landlord-Friendly
- State Texas
- 87 Strongly Landlord-Friendly · R+5
- County
- — inherits STATE
- City
- — inherits STATE
ZIP-level market 78407
- Home prices YoY
- 0.6%
- Active inventory
- 9
- Price-to-rent
- 8.7×
Monthly cashflow live
- Estimated rent
- $1,235 medium interval (Pro) →
- Mortgage (P&I)
- −$673
- Tax from tax record
- −$258 /mo · $3,098/yr
- Insurance
- −$53
- HOA
- −$0
- Vacancy / Maint / Mgmt
- −$259
- Net cashflow
- $-8
Break-even live
UW: 25.0% down · 7.5% · 30yr · 1.5% tax · 5.0% vac · 8.0% maint · 8.0% mgmt
Financing live
Cash to close
- Down payment
- $32,062
- Closing costs
- $3,848
- Reserves months
- —
- Total cash needed
- —
Loan-product check · same deal, 3 products live
Conventional
25% down · 7.5% · 30yr
- Down + closing
- —
- Monthly P&I
- —
- Monthly cashflow
- —
- DSCR
- —
- Eligible?
- —
Personal DTI + credit; lowest rate.
DSCR
20% down · 8.5% · 30yr
- Down + closing
- —
- Monthly P&I
- —
- Monthly cashflow
- —
- DSCR
- —
- Eligible?
- —
No personal income docs; deal must DSCR.
Hard money
10% down · 12.0% · 12mo
- Down + closing
- —
- Monthly P&I
- —
- Monthly cashflow
- —
- DSCR
- —
- Eligible?
- —
Short-term bridge; refi at stabilization.
Rent comps 2 comps
| Address | Beds | Baths | Sqft | Rent | $/sqft | DOM | Units | Dist |
|---|---|---|---|---|---|---|---|---|
| 2240 N Padre Island Dr Corpus Christi, TX | 1.0–3.0 | 1.0–2.0 | 916 | $1,225 | $1.34 | 13d | 18 | 0.73mi |
| 1545 N Lexington Blvd Unit 207 JADE Corpus Christi, TX | 3.0 | 2.0 | 1064 | $1,250 | $1.17 | 13d | 1 | 1.19mi |
Listing history 13 events
-
2026-06-15status $128,250 Pending 70 DOM
-
2026-06-08days on market $128,250 Active 70 DOM
-
2026-06-07days on market $128,250 Active 69 DOM
-
2026-06-05days on market $128,250 Active 66 DOM
-
2026-06-03days on market $128,250 Active 65 DOM
-
2026-06-02days on market $128,250 Active 64 DOM
-
2026-06-01days on market $128,250 Active 63 DOM
-
2026-05-31days on market $128,250 Active 62 DOM
-
2026-05-30days on market $128,250 Active 61 DOM
-
2026-04-29price $128,250 246-char remark
Show marketing remark (246 chars)
Three bedroom two bathroom brick home in Corpus Christi, Texas with over 1,400 square feet of living space, split bedrooms, built in bookshelf, large backyard with covered patio and much more! Come view today and make this into your forever home.
-
2026-03-30$135,000 Active 246-char remark
Show marketing remark (246 chars)
Three bedroom two bathroom brick home in Corpus Christi, Texas with over 1,400 square feet of living space, split bedrooms, built in bookshelf, large backyard with covered patio and much more! Come view today and make this into your forever home.
-
2021-10-27soldstatus
-
1987-02-10soldstatus $53,457
ⓘ Source: listings_history table (triggers on properties + properties_extension) + one-shot
backfill from property_details.listing_events for pre-trigger history.
Tax reassessment forecast TX · Resets to sale price
- Current annual tax
- $3,098 · $258/mo
- Projected year-2 tax
- $3,098 · $258/mo
- Expected delta
- $0/yr ($0/mo · 0.0%)
ⓘ Screening estimate from a state-policy table — verify with the county assessor before closing.
Climate risk First Street
- Flood 1/10 Low FEMA zone X (unshaded) · 0% chance over 30 yrs
- Wildfire 3/10 Moderate
- Heat 10/10 Extreme 7 d/yr ≥108°F today · 24 d/yr by 30 yrs out
- Wind 9/10 Extreme 99% chance of damaging wind over 30 yrs
- Air quality 1/10 Low 0 unhealthy d/yr today · 0 by 30 yrs out
Nearby sold comps map
Loading sold comps map…
Walkable amenities ~0.75 mi
Loading nearby amenities…
Taxation est. · year 1
- Rental income
- $14,826
- − Mortgage interest
- −$7,184
- − Property taxes
- −$3,098
- − Insurance
- −$641
- − Repairs & maintenance
- −$1,186
- − Management
- −$1,186
- − Depreciation
- −$3,731
- Taxable loss
- −$2,201
- Est. tax savings @ 24.0%
- +$528
- After-tax cash flow
- $430/yr
For passive investors: Depreciation is non-cash, so a rental often shows a tax loss while cash-flowing — sheltering income. Rental losses are passive: they offset passive income freely, and up to $25,000/yr can offset ordinary (W-2) income if you actively participate and your MAGI is under $100k (phasing out to $0 by $150k); unused losses carry forward. On sale, claimed depreciation is recaptured at up to 25%, and gains may owe capital-gains tax (a 1031 exchange can defer both). Figures are a year-1 estimate at your 24.0% rate — not tax advice; consult a CPA.
Schools (NCES district)
- District
- Corpus Christi ISD
- NCES district ID
- 4815270
- Math proficiency
- 31% ▼ -18.00%
- Reading proficiency
- 35% ▼ -7.00%
- Median HH income
- $45,672
- Composite
- 28.27/100
- National rank
- #6793
- State rank
- #562 of 826 in TX
Livability — Corpus Christi
- Score
- 78/100
- State rank
- #66
- US rank
- #2404
Category grades
Schools grade is shown separately in the Schools card above.
Census & demographics
- Census place
- Corpus Christi, TX
- City population
- 296,836
- Population (ZIP)
- 1,937
Population outlook (Nueces County) Hauer SSP2
- Today (2025)
- 418,037 people
- By 2030
- 447,123 · +7.0%
- By 2040
- 505,911 · +21.0%
- By 2050
- 567,522 · +35.8%
- By 2075
- 729,686 · +74.6%
- By 2100
- 847,087 · +102.6%
Race, ethnicity, and origin ACS 2023
- Neighborhood character
- Predominantly Hispanic (70%)
- Race & ethnicity
- Hispanic / Latino 70% Two or more races 54% Black 15% White 12% Asian 2%
- Hispanic origin (detail)
- Mexican 64%
- Common ancestry
- Slovak 2%
- Foreign-born
- 12% · Canada, Vietnam
- Languages at home
- 58% English-only · Spanish 39% Vietnamese 2% Russian/Polish/Slavic 1%
Political lean MEDSL · Nueces
- 2024 margin
- R (+11.5) · D 43.8% · R 55.3%
- 2008→2024 swing
- -7.1pp toward R · 2008: -4.4pp · 2024: -11.5pp
- All cycles
- 2024: R+11.5 2020: R+2.9 2016: R+1.5 2012: R+3.2 2008: R+4.4
Not yet ingested
- Civics
- —
Market trends
- HPI YoY
- ▲ 0.52%
- Current HPI
- 82.2949
- Rent YoY
- —
- Metro
- —
- State GDP YoY
- ▲ 3.95%
- F500 in state
- 110
Industry mix (Fortune 500 HQ in TX)
| Industry | F500 HQs | Revenue |
|---|---|---|
| Energy | 16 | $1,198B |
|
||
| Technology | 5 | $198B |
|
||
| Engineering / Construction | 4 | $72B |
|
||
| Energy Services | 3 | $60B |
|
||
| Utilities | 3 | $41B |
|
||
| Healthcare | 2 | $330B |
|
||
Price history
+139.9% since first listed4 events — show timeline
- 2026-04-29 Price Changed $128,250 CBMLS
- 2026-03-30 Listed $135,000 CBMLS
- 2021-10-27 Sold (Public Records) — Public Records
- 1987-02-10 Sold (Public Records) $53,457 Public Records
Property tax history
+2.8%/yrLatest (2025): $3,098 · -7.7% YoY. Source: county tax records.
Cash-flow waterfall
monthlySold comps — $/sqft
last 12 mo · ≤1 miLoading sold comps…