2837 Stoneway Ln Unit D · Fort Pierce, FL
Flood risk 1/10 · Minimal
- FEMA flood zone
- X (unshaded)
- Chance of flooding over 30 yrs
- 0.0%
- Est. flood insurance / yr
- $507 – $1,088
Fire risk 2/10 · Minimal
- Est. fire insurance / yr
- $947 – $1,759
Heat risk 10/10 · Severe
- Hot days now (above 106°F)
- 7 days/yr
- Hot days in 30 yrs
- 24 days/yr
Wind risk 10/10 · Severe
- Chance of severe wind over 30 yrs
- 99.0%
Air-quality risk 2/10 · Minimal
- Unhealthy air days now
- 1 days/yr
- Unhealthy air days in 30 yrs
- 1 days/yr
Risk factors via First Street. Map © Google.
Why this score? — see what drove the C grade
The composite is a weighted blend of 9 inputs, each scored 0–100. Each bar is that input's sub-score; the figure is the points it added to the 100-point composite (weight × sub-score).
- Cash flow +18.4/30.0
- 1% rule +10.0/10.0
- ARV discount +7.5/15.0
- DSCR +5.8/10.0
- Rent growth +4.4/5.0
- Livability +3.8/5.0
- Schools +3.7/10.0
- Condition / age +2.5/5.0
- Appreciation +0.0/10.0
$110,000
🖨 Deal sheet (PDF) 📄 Offer letter ✓ Due diligence
Listing remarks MLS
FEBRUARY 12, 2020 UPDATE TO AGENTS: LENDER HAS ADVISED HIGHEST AND BEST OFFER ONLY AT THIS TIME. PLEASE SUBMIT YOUR HIGHEST AND BEST OFFER NO LATER THAN FRIDAY, FEBRUARY 14TH AT NOON. OFFERS NOT CHOSEN WILL BE HELD AS BACKUP OFFERS. ATTENTION INVESTORS! Great opportunity to purchase this 2/2 townhome in desirable Surrey Woods below market value! Needs work and priced accordingly. This is a short sale and will require lender approval. Buyer to have utilities turned on for inspections at buyer's expense.
Key facts
- $395 HOA
- Community pool
- Built 1991
Property features AI
Finance
- Other: Pets allowed (breed restrictions and no restrictions listed)
- HOA & community: Community pool; On-site manager; Property management; HOA fee $395 monthly
Exterior
- Utilities: Public water; Public sewer; Sewer available; Water available
- Home design: Townhouse; 1 story; Faces west; Resale condition
- Construction: Brick, concrete, and stucco construction
- Exterior features: Not waterfront
Interior
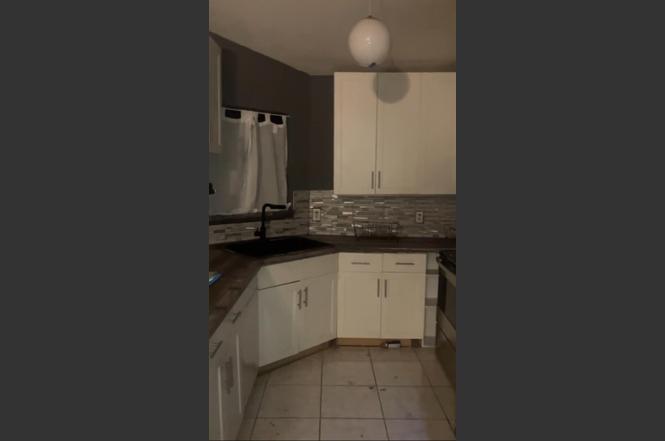
- Kitchen: Electric range; Refrigerator
- Bedrooms: 2 main-level bedrooms
- Bathrooms: 2 full bathrooms (both on main level)
- Heating & cooling: Central heating; Ceiling fan cooling
- Interior features: Walk-in closets; Closet cabinetry; Unfurnished
- Laundry & utility: Electric water heater
Neighborhood map
What this means for you Summary
Snapshot
- This is a 2-bed/2.0-bath single-family listed at $110k.
Deal economics
- At list price, monthly cash flow is $102 ($1k/yr) — positive.
- The deal already cash-flows at list — no discount required.
- Meets the 1% rule at list price ($2k rent vs $110k).
- Recommended offer: $97k (12.0% below list) — sets the bar for market timing.
Location & tenants
- Location reads 76/100 on livability (#226 in FL, #3,360 nationally) — a middle-class / working-renter tenant base. Strengths: commute A+, cost of living A+, housing A+; Watch: crime D+, amenities F, employment F.
- St. Lucie (urban): math 40% / reading 48% proficiency, ranked #51 of 73 in FL (top 70%) — families likely to look elsewhere, expect single-tenant / working-renter base with shorter leases.
- Zoned schools: Weatherbee Elementary School (math 32% / reading 32%, grade F, #1,797 of 2,144 statewide, top 86%, 672 students, 90% FRL); Dan Mccarty Middle School (math 23% / reading 23%, grade F, #542 of 571 statewide, top 95%, 747 students, 88% FRL); Fort Pierce Central High School (math 15% / reading 45%, grade F, #441 of 667 statewide, top 67%, 3,091 students, 62% FRL) — zoned schools average 80% FRL vs 59% district-wide (21 pts higher); higher-poverty schools than district average — tighter screening recommended.
- Zoned-school proficiency averages 28% at this address vs 44% district-wide (-16 pts) — the specific schools serving this property underperform the St. Lucie average; the district grade overstates school quality for this exact location.
- Market conditions: Rents rising fast (+7.4%/yr); 336 active listings in the ZIP; 36 comparable units currently listed for rent nearby; rentals at typical pace (median 24d on market — plan ~3-4 weeks tenant-placement turnaround); 4,868 units permitted in St. Lucie County in 2024 (268 in 5+ unit buildings).
Forward outlook
- Local home prices are declining (-3.0%/yr); year-one equity from $761 of loan paydown is wiped out by about $3k of value loss. Plan a longer hold.
- St. Lucie County population projected at +20% by 2050 — long-run rental-demand tailwind backs the buy-and-hold thesis.
- At projected returns (-3.0% appreciation + 7.4% rent growth), your $31k cash investment doubles in ~9 years — after that, you're playing with house money.
Negotiation context
- It's been on market 248 days — a 12% lower offer ($97k) is reasonable based on typical stale-listing flexibility.
- 4 sale attempts since 20y ago; this cycle's ask has dropped $76k (41%) from the opening price — seller is motivated, your offer sets the floor, not the list.
- Current owner paid $70k; list at $110k implies a 57% gain — meaningful room to come down on a strong offer.
Risks & watch-outs
- Watch-outs: property tax is 2.8% of price; HOA is 23% of rent.
- Climate carrying-cost: severe wind risk, 99% chance of damaging wind over 30y; extreme-heat days projected 7→24/yr by 2055 (HVAC capex compounding) — expect insurance premiums to compound above CPI over the hold.
Questions for the listing agent
- It's been on market 248 days. Have you received any prior offers? Is the seller open to a 12% concession, seller financing, or rate buy-down credit?
- Property tax is high relative to price — has the assessment been appealed recently, and will the sale trigger a re-assessment?
- What does the HOA fee cover, when was the last increase, and are there any pending special assessments or reserve-fund shortfalls?
- Why hasn't it sold? Are there any deal-killer items the seller is aware of (foundation, flood, title, zoning, code violations)?
- Is there a deadline driving the sale (1031 exchange, divorce, estate, relocation)? That informs how much negotiation room exists.
- Schools are D-rated, which usually means shorter tenancies and higher turnover. Who's the typical renter profile here, and what's been the actual vacancy rate?
- Crime grade is D in this area — have there been break-ins, vandalism, or insurance claims at this property in the last 3 years? What carrier currently insures it and at what premium?
- What's the average days-on-market for RENTAL listings here right now (not sales)? A rising rental-DOM trend means longer vacancies and softer asking-rent achievability than the comps imply.
- What's the recent tenant-quality profile in this submarket — average credit score on applications, eviction rate, late-payment / NSF rate, and stable-employment percentage? A property-management company in the area should have these aggregated.
- How much new for-sale + rental construction is in the pipeline within 1–3 miles? Heavy new supply typically softens prices + rents 12–24 months out; constrained supply supports both.
Investment metrics
- 1% rule
- 1.58% ✓
- Cap rate
- 7.40%
- Cash-on-cash
- 3.97%
- DSCR
- 1.18
- GRM
- 5.3
CMA / ARV
- ARV (on-the-fly)
- $261,300
- Comps found
- 1
Show comp detail 1 sale within ~0.75 mi
| Address | Dist | Beds/Ba | Sqft | Sold | Price | $/sf | Match |
|---|---|---|---|---|---|---|---|
| 2711 S 27th St | 0.21mi | 3/1.0 (+1) | 1,040 (+4%) | 4mo | $270,000 | $260 | 72 |
Match score weights: distance 35% · size 25% · config 20% · recency 20%. Top-matched comps best support the ARV.
Projected returns pro-forma
-3.0% appreciation · 7.42% rent growth · sell at horizon
- IRR
- -2.3%
- Equity multiple
- 0.91×
- Total profit
- $-2,916
- Equity at exit
- $16,401
- IRR
- 13.5%
- Equity multiple
- 2.41×
- Total profit
- $43,526
- Equity at exit
- $9,511
Cash invested: $30,800 (down + closing). Projections, not guarantees.
Landlord ↔ Tenant lean methodology
- Overall (STATE)
- 87 Strongly Landlord-Friendly
- State Florida
- 87 Strongly Landlord-Friendly · R+3
- County
- — inherits STATE
- City
- — inherits STATE
ZIP-level market 34982
- Home prices YoY
- -33.4%
- Rents YoY
- 7.4%
- Active inventory
- 336
- Price-to-rent
- 5.3×
Monthly cashflow live
- Estimated rent
- $1,739 high interval (Pro) →
- Mortgage (P&I)
- −$577
- Tax from tax record
- −$254 /mo · $3,053/yr
- Insurance
- −$46
- HOA
- −$395
- Vacancy / Maint / Mgmt
- −$365
- Net cashflow
- $102
Break-even live
Sensitivity live
| Price | -10% $164 | -5% $133 | +0% $102 | +5% $71 | +10% $40 |
|---|---|---|---|---|---|
| Rent | -10% $-36 | -5% $33 | +0% $102 | +5% $171 | +10% $239 |
| Rate | -1.0pp $157 | -0.5pp $130 | base $102 | +0.5pp $73 | +1.0pp $44 |
UW: 25.0% down · 7.5% · 30yr · 1.5% tax · 5.0% vac · 8.0% maint · 8.0% mgmt
Financing live
Cash to close
- Down payment
- $27,500
- Closing costs
- $3,300
- Reserves months
- —
- Total cash needed
- —
Loan-product check · same deal, 3 products live
Conventional
25% down · 7.5% · 30yr
- Down + closing
- —
- Monthly P&I
- —
- Monthly cashflow
- —
- DSCR
- —
- Eligible?
- —
Personal DTI + credit; lowest rate.
DSCR
20% down · 8.5% · 30yr
- Down + closing
- —
- Monthly P&I
- —
- Monthly cashflow
- —
- DSCR
- —
- Eligible?
- —
No personal income docs; deal must DSCR.
Hard money
10% down · 12.0% · 12mo
- Down + closing
- —
- Monthly P&I
- —
- Monthly cashflow
- —
- DSCR
- —
- Eligible?
- —
Short-term bridge; refi at stabilization.
Rent comps 36 comps
| Address | Beds | Baths | Sqft | Rent | $/sqft | DOM | Units | Dist |
|---|---|---|---|---|---|---|---|---|
| 2811 Stoneway Ln Unit 2811A Fort Pierce, FL | 2.0 | 2.0 | 1274 | $1,700 | $1.33 | 14d | 1 | 0.13mi |
| 2820 Stoneway Ln Fort Pierce, FL | 2.0 | 2.0 | 1005 | $1,575 | $1.57 | 24d | 1 | 0.19mi |
| 2101 Linda Sue Cir Fort Pierce, FL | 2.0 | 1.5 | 1300 | $1,750 | $1.35 | 24d | 1 | 0.28mi |
| 1717 Linwood Ave Fort Pierce, FL | 2.0 | 1.0 | 712 | $1,800 | $2.53 | 24d | 1 | 0.44mi |
| 3171 Morning Dew Ln Fort Pierce, FL | 2.0 | 1.0 | 1000 | $1,700 | $1.70 | 24d | 1 | 0.45mi |
| 2403 S 25th St Fort Pierce, FL | 2.0 | 1.0 | 576 | $1,775 | $3.08 | 24d | 1 | 0.53mi |
| 2516 S 19th St #208 Fort Pierce, FL | 2.0 | 2.0 | 1190 | $1,700 | $1.43 | 24d | 1 | 0.67mi |
| 2513 S 17th St #207 Fort Pierce, FL | 2.0 | 2.0 | 1190 | $1,600 | $1.34 | 24d | 1 | 0.70mi |
| 2517 S 17th St Fort Pierce, FL | 1.0 | 1.0 | 1007 | $1,795 | $1.78 | 14d | 1 | 0.71mi |
| 3005 Tennessee Ave Fort Pierce, FL | 3.0 | 2.0 | 1222 | $2,400 | $1.96 | 24d | 1 | 0.92mi |
| 2100 S 34th St Fort Pierce, FL | 3.0 | 2.0 | 1262 | $2,200 | $1.74 | 24d | 1 | 1.03mi |
| 2902 Oleander Blvd Fort Pierce, FL | 3.0 | 2.0 | 1276 | $2,700 | $2.12 | 24d | 1 | 1.09mi |
| 2302 Sunrise Blvd #201 Fort Pierce, FL | 2.0 | 1.0 | 966 | $1,500 | $1.55 | 24d | 1 | 1.20mi |
| 800 Kanner Dr Unit B Fort Pierce, FL | 2.0 | 1.0 | 900 | $1,550 | $1.72 | 14d | 1 | 1.27mi |
| 617 Ixoria Ave Unit 2A Fort Pierce, FL | 2.0 | 2.5 | 764 | $1,500 | $1.96 | 24d | 1 | 1.30mi |
| 2050 Oleander Blvd Unit 703 Fort Pierce, FL | 2.0 | 2.0 | 1014 | $1,800 | $1.78 | 24d | 1 | 1.31mi |
| 2016 S 10th St Unit A Fort Pierce, FL | 2.0 | 2.5 | 1120 | $1,595 | $1.42 | 24d | 1 | 1.33mi |
| 605 Ixoria Ave #15 Fort Pierce, FL | 2.0 | 2.0 | 744 | $1,500 | $2.02 | 24d | 1 | 1.35mi |
| 605 Ixoria Ave Fort Pierce, FL | 2.0 | 2.0 | 744 | $1,450 | $1.95 | 14d | 2 | 1.36mi |
| 1567 Pheasant Walk Unit B Fort Pierce, FL | 2.0 | 2.0 | 1280 | $1,900 | $1.48 | 14d | 1 | 1.38mi |
| 410 Palm Ave Apt B Fort Pierce, FL | 2.0 | 1.0 | 800 | $1,400 | $1.75 | 14d | 1 | 1.40mi |
| 1810 Nebraska Ave Unit 106 Fort Pierce, FL | 2.0 | 2.0 | 1042 | $1,699 | $1.63 | 14d | 1 | 1.40mi |
| 1810 Nebraska Ave Apt 104 Fort Pierce, FL | 1.0 | 1.5 | 806 | $1,599 | $1.98 | 24d | 1 | 1.40mi |
| 1810 Nebraska Ave Apt 101 Fort Pierce, FL | 2.0 | 2.0 | 1035 | $1,699 | $1.64 | 24d | 1 | 1.40mi |
| 1820 Nebraska Ave Apt 102 Fort Pierce, FL | 2.0 | 2.0 | 997 | $1,679 | $1.68 | 24d | 1 | 1.41mi |
| 1820 Nebraska Ave Apt 201 Fort Pierce, FL | 2.0 | 2.0 | 1035 | $1,699 | $1.64 | 24d | 1 | 1.41mi |
| 1820 Nebraska Ave Apt 203 Fort Pierce, FL | 1.0 | 1.5 | 806 | $1,599 | $1.98 | 24d | 1 | 1.41mi |
| 802 N Lake Dr Unit B Fort Pierce, FL | 2.0 | 1.0 | 1000 | $1,550 | $1.55 | 24d | 1 | 1.43mi |
| 1800 Nebraska Ave Unit 202 Fort Pierce, FL | 2.0 | 2.0 | 1312 | $1,749 | $1.33 | 24d | 1 | 1.44mi |
| 1800 Nebraska Ave Unit 103 Fort Pierce, FL | 1.0 | 1.5 | 1042 | $1,799 | $1.73 | 24d | 1 | 1.44mi |
| 1830 Nebraska Ave Fort Pierce, FL | 1.0–2.0 | 1.5–2.0 | 924 | $1,799 | $1.95 | 14d | 5 | 1.45mi |
| 1840 Nebraska Ave Unit 104 Fort Pierce, FL | 1.0 | 2.0 | 806 | $1,599 | $1.98 | 14d | 1 | 1.47mi |
| 1840 Nebraska Ave Apt 106 Fort Pierce, FL | 2.0 | 2.0 | 997 | $1,679 | $1.68 | 14d | 1 | 1.47mi |
| 1840 Nebraska Ave Apt 101 Fort Pierce, FL | 2.0 | 2.0 | 1035 | $1,699 | $1.64 | 14d | 1 | 1.47mi |
| 1439 Captains Walk Unit 20D Fort Pierce, FL | 2.0 | 2.0 | 1280 | $2,000 | $1.56 | 22d | 1 | 1.48mi |
| 1850 Nebraska Ave Unit 204 Fort Pierce, FL | 1.0 | 1.5 | 806 | $1,599 | $1.98 | 24d | 1 | 1.49mi |
HOA detail
- Monthly dues
- $395 · $4,740/yr
Listing history 33 events
-
2026-06-18days on market $110,000 Active 248 DOM
-
2026-06-17days on market $110,000 Active 247 DOM
-
2026-06-16days on market $110,000 Active 246 DOM
-
2026-06-15days on market $110,000 Active 245 DOM
-
2026-06-14days on market $110,000 Active 243 DOM
-
2026-06-13days on market $110,000 Active 242 DOM
-
2026-06-10days on market $110,000 Active 240 DOM
-
2026-06-09days on market $110,000 Active 239 DOM
-
2026-06-08days on market $110,000 Active 238 DOM
-
2026-06-07days on market $110,000 Active 237 DOM
-
2026-06-05days on market $110,000 Active 234 DOM
-
2026-06-03days on market $110,000 Active 233 DOM
-
2026-06-02days on market $110,000 Active 232 DOM
-
2026-06-01days on market $110,000 Active 231 DOM
-
2026-05-31days on market $110,000 Active 230 DOM
-
2026-05-30days on market $110,000 Active 229 DOM
-
2026-04-23price $110,000
-
2026-04-01price $115,000
-
2026-03-03price $136,599
-
2026-02-25price $155,000
-
2025-10-17price $170,000
-
2025-10-12$185,500 Active
-
2020-07-01soldstatus $70,000
-
2020-06-29soldstatus $69,963 Closed 511-char remark
Show marketing remark (511 chars)
FEBRUARY 12, 2020 UPDATE TO AGENTS: LENDER HAS ADVISED HIGHEST AND BEST OFFER ONLY AT THIS TIME. PLEASE SUBMIT YOUR HIGHEST AND BEST OFFER NO LATER THAN FRIDAY, FEBRUARY 14TH AT NOON. OFFERS NOT CHOSEN WILL BE HELD AS BACKUP OFFERS. ATTENTION INVESTORS! Great opportunity to purchase this 2/2 townhome in desirable Surrey Woods below market value! Needs work and priced accordingly. This is a short sale and will require lender approval. Buyer to have utilities turned on for inspections at buyer's expense.
-
2020-02-15historical Contingent 511-char remark
Show marketing remark (511 chars)
FEBRUARY 12, 2020 UPDATE TO AGENTS: LENDER HAS ADVISED HIGHEST AND BEST OFFER ONLY AT THIS TIME. PLEASE SUBMIT YOUR HIGHEST AND BEST OFFER NO LATER THAN FRIDAY, FEBRUARY 14TH AT NOON. OFFERS NOT CHOSEN WILL BE HELD AS BACKUP OFFERS. ATTENTION INVESTORS! Great opportunity to purchase this 2/2 townhome in desirable Surrey Woods below market value! Needs work and priced accordingly. This is a short sale and will require lender approval. Buyer to have utilities turned on for inspections at buyer's expense.
-
2020-02-03$64,900 Active 511-char remark
Show marketing remark (511 chars)
FEBRUARY 12, 2020 UPDATE TO AGENTS: LENDER HAS ADVISED HIGHEST AND BEST OFFER ONLY AT THIS TIME. PLEASE SUBMIT YOUR HIGHEST AND BEST OFFER NO LATER THAN FRIDAY, FEBRUARY 14TH AT NOON. OFFERS NOT CHOSEN WILL BE HELD AS BACKUP OFFERS. ATTENTION INVESTORS! Great opportunity to purchase this 2/2 townhome in desirable Surrey Woods below market value! Needs work and priced accordingly. This is a short sale and will require lender approval. Buyer to have utilities turned on for inspections at buyer's expense.
-
2014-10-12historical
-
2014-05-26historical
-
2007-03-28$115,000
-
2006-10-02$127,990
-
2005-08-10soldstatus $128,000
-
2004-08-26soldstatus $94,900
-
2001-11-02soldstatus $3,200,000
ⓘ Source: listings_history table (triggers on properties + properties_extension) + one-shot
backfill from property_details.listing_events for pre-trigger history.
Tax reassessment forecast FL · Resets to sale price
- Current annual tax
- $3,053 · $254/mo
- Projected year-2 tax
- $3,053 · $254/mo
- Expected delta
- $0/yr ($0/mo · 0.0%)
ⓘ Screening estimate from a state-policy table — verify with the county assessor before closing.
Climate risk First Street
- Flood 1/10 Low FEMA zone X (unshaded) · 0% chance over 30 yrs
- Wildfire 2/10 Low
- Heat 10/10 Extreme 7 d/yr ≥106°F today · 24 d/yr by 30 yrs out
- Wind 10/10 Extreme 99% chance of damaging wind over 30 yrs
- Air quality 2/10 Low 1 unhealthy d/yr today · 1 by 30 yrs out
Nearby sold comps map
Loading sold comps map…
Walkable amenities ~0.75 mi
Loading nearby amenities…
Taxation est. · year 1
- Rental income
- $20,871
- − Mortgage interest
- −$6,162
- − Property taxes
- −$3,053
- − Insurance
- −$550
- − Repairs & maintenance
- −$1,670
- − Management
- −$1,670
- − HOA
- −$4,740
- − Depreciation
- −$3,200
- Taxable loss
- −$173
- Est. tax savings @ 24.0%
- +$42
- After-tax cash flow
- $1,264/yr
For passive investors: Depreciation is non-cash, so a rental often shows a tax loss while cash-flowing — sheltering income. Rental losses are passive: they offset passive income freely, and up to $25,000/yr can offset ordinary (W-2) income if you actively participate and your MAGI is under $100k (phasing out to $0 by $150k); unused losses carry forward. On sale, claimed depreciation is recaptured at up to 25%, and gains may owe capital-gains tax (a 1031 exchange can defer both). Figures are a year-1 estimate at your 24.0% rate — not tax advice; consult a CPA.
Schools (NCES district)
- District
- St. Lucie
- NCES district ID
- 1201770
- Math proficiency
- 40% ▼ -11.00%
- Reading proficiency
- 48% ▼ -4.00%
- Median HH income
- $44,737
- Composite
- 37.28/100
- National rank
- #4449
- State rank
- #51 of 73 in FL
Livability — Fort Pierce
- Score
- 76/100
- State rank
- #226
- US rank
- #3360
Category grades
Schools grade is shown separately in the Schools card above.
Census & demographics
- Census place
- Fort Pierce, FL
- County
- Saint Lucie County · 337,150 people
- City population
- 78,556
- Metro
- Port St. Lucie, FL
- Population (ZIP)
- 31,143
- Household income
- $54,082
- Rent vs Own
- Severe rent burden
- 1086.0
Population outlook (St. Lucie County) Hauer SSP2
- Today (2025)
- 338,016 people
- By 2030
- 355,687 · +5.2%
- By 2040
- 385,521 · +14.1%
- By 2050
- 406,106 · +20.1%
- By 2075
- 441,054 · +30.5%
- By 2100
- 436,885 · +29.2%
Race, ethnicity, and origin ACS 2023
- Neighborhood character
- Majority White (62%)
- Race & ethnicity
- White 62% Hispanic / Latino 22% Two or more races 12% Black 12%
- Hispanic origin (detail)
- Mexican 10% Puerto Rican 3% Cuban 3%
- Common ancestry
- Italian 7% Hispanic 2% Lithuanian 1%
- Foreign-born
- 12% · Canada
- Languages at home
- 80% English-only · Spanish 16% French/Haitian/Cajun 3%
Political lean MEDSL · St. Lucie
- 2024 margin
- Lean R (+9.1) · D 45.1% · R 54.2%
- 2008→2024 swing
- -21.2pp toward R · 2008: 12.1pp · 2024: -9.1pp
- All cycles
- 2024: R+9.1 2020: R+1.6 2016: R+2.5 2012: D+7.9 2008: D+12.1
Not yet ingested
- Civics
- —
Market trends
- HPI YoY
- ▼ -199.47%
- Current HPI
- 397.2649
- Rent YoY
- ▲ 7.42%
- Metro
- Port St. Lucie, FL
- State GDP YoY
- ▲ 3.28%
- F500 in state
- 36
Industry mix (Fortune 500 HQ in FL)
| Industry | F500 HQs | Revenue |
|---|---|---|
| Industrial Technology | 2 | $29B |
|
||
| Insurance | 2 | $17B |
|
||
| Retail | 1 | $60B |
|
||
| Technology Distribution | 1 | $58B |
|
||
| Homebuilding | 1 | $35B |
|
||
| Technology Manufacturing | 1 | $35B |
|
||
Price history
-96.6% since first listed17 events — show timeline
- 2026-04-23 Price Changed $110,000 Beaches MLS
- 2026-04-01 Price Changed $115,000 Beaches MLS
- 2026-03-03 Price Changed $136,599 Beaches MLS
- 2026-02-25 Price Changed $155,000 Beaches MLS
- 2025-10-17 Price Changed $170,000 Beaches MLS
- 2025-10-12 Listed $185,500 Beaches MLS
- 2020-07-01 Sold (Public Records) $70,000 Public Records
- 2020-06-29 Sold (MLS) $69,963 Beaches MLS
- 2020-02-15 Contingent — Beaches MLS
- 2020-02-03 Listed $64,900 Beaches MLS
- 2014-10-12 Listing Removed — Beaches MLS
- 2014-05-26 Listing Removed — Beaches MLS
- 2007-03-28 Listed $115,000 Beaches MLS
- 2006-10-02 Listed $127,990 Beaches MLS
- 2005-08-10 Sold (Public Records) $128,000 Public Records
- 2004-08-26 Sold (Public Records) $94,900 Public Records
- 2001-11-02 Sold (Public Records) $3,200,000 Public Records
Property tax history
+13.6%/yrLatest (2025): $3,053 · +8.7% YoY. Source: county tax records.
Cash-flow waterfall
monthlySold comps — $/sqft
last 12 mo · ≤1 miLoading sold comps…