5773 Gage Ln Unit B-101 · Lely, FL
Flood risk 8/10 · Major
- FEMA flood zone
- X (shaded)
- Chance of flooding over 30 yrs
- 0.97%
- Est. flood insurance / yr
- $507 – $1,088
Fire risk 3/10 · Minor
- Est. fire insurance / yr
- $947 – $1,759
Heat risk 10/10 · Severe
- Hot days now (above 107°F)
- 7 days/yr
- Hot days in 30 yrs
- 29 days/yr
Wind risk 10/10 · Severe
- Chance of severe wind over 30 yrs
- 99.0%
Air-quality risk 2/10 · Minimal
- Unhealthy air days now
- 2 days/yr
- Unhealthy air days in 30 yrs
- 2 days/yr
Risk factors via First Street. Map © Google.
Why this score? — see what drove the C- grade
The composite is a weighted blend of 9 inputs, each scored 0–100. Each bar is that input's sub-score; the figure is the points it added to the 100-point composite (weight × sub-score).
- Cash flow +18.0/30.0
- ARV discount +7.5/15.0
- 1% rule +7.3/10.0
- DSCR +5.6/10.0
- Schools +5.0/10.0
- Rent growth +3.9/5.0
- Livability +3.3/5.0
- Condition / age +2.5/5.0
- Appreciation +0.0/10.0
$270,000
🖨 Deal sheet 📄 Offer letter ✓ Due diligence
Listing remarks
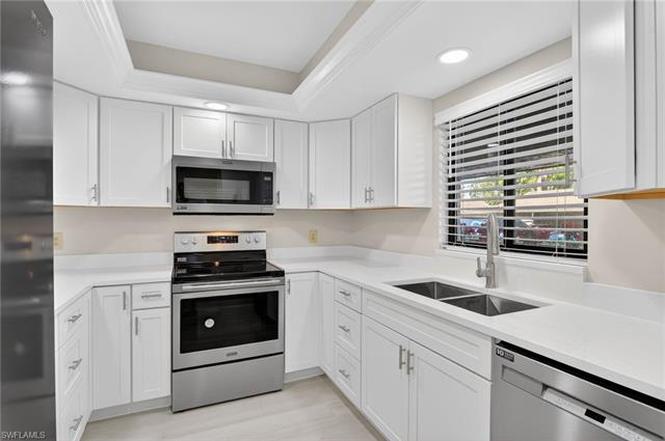
This beautifully renovated first-floor residence offers 2 bedrooms and 2 bathrooms and is completely move-in ready. Thoughtfully updated from top to bottom, this home combines modern style with quality craftsmanship. New luxury vinyl plank flooring runs throughout the residence, creating a seamless and contemporary feel. Both bathrooms have been fully rebuilt down to the studs and feature new tiled showers, custom sliding glass shower doors, updated vanities, sinks, faucets, lighting fixtures, toilets, tiled flooring, and new doors. The brand-new kitchen is a standout, showcasing quartz countertops, stainless-steel appliances, new cabinetry, updated lighting, and modern plumbing fixtures. H
Key facts
- Quartz countertops
- Tiled showers
- New cabinetry
Tags
Property features AI
Finance
- Other: Located off Rattlesnake-Hammock Rd near downtown shopping and dining and close to the USOP National Pickleball Center; Pet-friendly community; Condo restrictions include architectural controls, deeded restrictions, limited number of vehicles, no commercial use, no RVs
- HOA & community: Quarterly condo fee; Condo fee covers insurance, irrigation water, lawn/land maintenance, legal/accounting, management, exterior pest control, recreation facilities, reserves, and street lights; Professional management; Community amenities include clubhouse, community pool, bocce court, BBQ/picnic area, bike storage, internet access, streetlight, and vehicle wash area; Community type: Condo/Hotel; Total annual recurring fees $6,360; Total one-time fees $150
Exterior
- Parking: 1 assigned covered parking; Detached 1-car carport
- Utilities: Central water; Central sewer; Cable available
- Home design: Residential condo in a low-rise (1–3) building; Condo unit in AUGUSTA COURT at LELY COUNTRY CLUB; Concrete block construction; Built in 1988; Entry level information not specified
- Construction: Concrete block construction; Stucco finish; Built-up/flat roof and shingle roof; Originally built in 1988
- Exterior features: Automatic sprinkler system; Storage; Impact resistant windows; Manual shutters; Single hung and sliding windows; Stucco exterior; Built-up/flat and shingle roofs; SE rear exposure; Golf course and landscaped views
Interior
- Kitchen: Dishwasher; Range; Microwave; Refrigerator/Icemaker; Pantry
- Bedrooms: 2 bedrooms (master bedroom on ground level)
- Flooring: Tile; Vinyl
- Bathrooms: 2 full bathrooms; Master bath with shower only
- Heating & cooling: Central electric heat; Central electric cooling
- Interior features: Cable prewire; Custom mirrors; High-speed internet available; Smoke detectors; Walk-in closet; Pantry; Dining area in living room; Laundry in residence; Screened lanai/porch; Split bedroom floor plan; Unfurnished
- Laundry & utility: Washer and dryer included; Washer/Dryer hookup
Neighborhood map
What this means for you Summary
Snapshot
- This is a 2-bed/2.0-bath condo listed at $270k.
Deal economics
- At list price, monthly cash flow is $165 ($2k/yr) — positive.
- The deal already cash-flows at list — no discount required.
- Meets the 1% rule at list price ($3k rent vs $270k).
- Recommended offer: $238k (12.0% below list) — sets the bar for market timing.
Location & tenants
- Location reads 66/100 on livability (#586 in FL) — a middle-class / working-renter tenant base. Strengths: crime A+, housing A+; Watch: health & safety D, amenities F, commute F.
- Collier (suburban): math 60% / reading 56% proficiency, ranked #16 of 73 in FL (top 22%) — acceptable for families but not a draw, mixed tenant base, ~2y average lease.
- Zoned schools: Lely Elementary School (math 45% / reading 46%, grade D-, #1,247 of 2,144 statewide, top 59%, 499 students, 62% FRL); Lely High School (math 40% / reading 39%, grade F, #304 of 667 statewide, top 47%, 1,504 students, 54% FRL) — zoned schools at 58% FRL track the district average.
- Zoned-school proficiency averages 42% at this address vs 58% district-wide (-16 pts) — the specific schools serving this property underperform the Collier average; the district grade overstates school quality for this exact location.
- Market conditions: Rents rising fast (+5.6%/yr); 597 active listings in the ZIP; 40 comparable units currently listed for rent nearby; rentals at typical pace (median 23d on market — plan ~3-4 weeks tenant-placement turnaround); solid renter incomes; 3,520 units permitted in Collier County in 2024 (959 in 5+ unit buildings).
- At $3,326/mo this rent would consume 49% of the median local household income ($82k/yr) (locally 954% of renters already pay >50% of income on rent) — very limited rent-growth headroom before tenants either downsize or default.
Forward outlook
- Local home prices are declining (-3.0%/yr); year-one equity from $2k of loan paydown is wiped out by about $8k of value loss. Plan a longer hold.
- Collier County population projected at +30% by 2050 — long-run rental-demand tailwind backs the buy-and-hold thesis.
Negotiation context
- It's been on market 124 days — a 12% lower offer ($238k) is reasonable based on typical stale-listing flexibility.
- 2 sale attempts; this cycle's ask has dropped $20k (7%) from the opening price — seller is motivated, your offer sets the floor, not the list.
Risks & watch-outs
- Watch-outs: flood insurance adds $66/mo.
- Climate carrying-cost: severe flood risk; severe wind risk, 99% chance of damaging wind over 30y; extreme-heat days projected 7→29/yr by 2055 (HVAC capex compounding) — expect insurance premiums to compound above CPI over the hold.
Questions for the listing agent
- It's been on market 124 days. Have you received any prior offers? Is the seller open to a 12% concession, seller financing, or rate buy-down credit?
- What's the actual annual flood-insurance premium (NFIP or private), and is the property in a SFHA with mandatory coverage?
- What does the HOA fee cover, when was the last increase, and are there any pending special assessments or reserve-fund shortfalls?
- Any open or pending special assessments — roof, HVAC, plumbing, elevator, façade? What's the per-unit balance and payoff schedule, and is the seller paying it off at close or rolling it to the buyer?
- Why hasn't it sold? Are there any deal-killer items the seller is aware of (foundation, flood, title, zoning, code violations)?
- Is there a deadline driving the sale (1031 exchange, divorce, estate, relocation)? That informs how much negotiation room exists.
- Schools are D-rated, which usually means shorter tenancies and higher turnover. Who's the typical renter profile here, and what's been the actual vacancy rate?
- What's the average days-on-market for RENTAL listings here right now (not sales)? A rising rental-DOM trend means longer vacancies and softer asking-rent achievability than the comps imply.
- What's the recent tenant-quality profile in this submarket — average credit score on applications, eviction rate, late-payment / NSF rate, and stable-employment percentage? A property-management company in the area should have these aggregated.
- How much new apartment / multifamily construction is in the pipeline within 1–3 miles? Heavy new supply (>2% of stock underway) typically softens rents 12–24 months out; light construction supports rent growth.
Investment metrics
- 1% rule
- 1.23% ✓
- Cap rate
- 7.32%
- Cash-on-cash
- 3.68%
- DSCR
- 1.16
- GRM
- 6.8
CMA / ARV
No comps found within radius.
Projected returns pro-forma
-3.0% appreciation · 5.59% rent growth · sell at horizon
- IRR
- -8.3%
- Equity multiple
- 0.68×
- Total profit
- $-23,926
- Equity at exit
- $40,258
- IRR
- 5.1%
- Equity multiple
- 1.43×
- Total profit
- $32,878
- Equity at exit
- $23,345
Cash invested: $75,600 (down + closing). Projections, not guarantees.
Landlord ↔ Tenant lean methodology
- Overall (STATE)
- 87 Strongly Landlord-Friendly
- State Florida
- 87 Strongly Landlord-Friendly · R+3
- County
- — inherits STATE
- City
- — inherits STATE
ZIP-level market 34113
- Rents YoY
- 5.6%
- Active inventory
- 597
- Price-to-rent
- 6.8×
Monthly cashflow live
- Estimated rent
- $3,326 high interval (Pro) →
- Mortgage (P&I)
- −$1,416
- Tax est. 1.5%
- −$338 /mo · $4,050/yr
- Insurance
- −$112
- Flood insurance flood zone
- −$66 /mo · $798/yr
- HOA
- −$530
- Vacancy / Maint / Mgmt
- −$698
- Net cashflow
- $165
Break-even live
UW: 25.0% down · 7.5% · 30yr · 1.5% tax · 5.0% vac · 8.0% maint · 8.0% mgmt
Financing live
Cash to close
- Down payment
- $67,500
- Closing costs
- $8,100
- Reserves months
- —
- Total cash needed
- —
Loan-product check · same deal, 3 products live
Conventional
25% down · 7.5% · 30yr
- Down + closing
- —
- Monthly P&I
- —
- Monthly cashflow
- —
- DSCR
- —
- Eligible?
- —
Personal DTI + credit; lowest rate.
DSCR
20% down · 8.5% · 30yr
- Down + closing
- —
- Monthly P&I
- —
- Monthly cashflow
- —
- DSCR
- —
- Eligible?
- —
No personal income docs; deal must DSCR.
Hard money
10% down · 12.0% · 12mo
- Down + closing
- —
- Monthly P&I
- —
- Monthly cashflow
- —
- DSCR
- —
- Eligible?
- —
Short-term bridge; refi at stabilization.
Rent comps 40 comps
| Address | Beds | Baths | Sqft | Rent | $/sqft | DOM | Units | Dist |
|---|---|---|---|---|---|---|---|---|
| 905 Augusta Blvd Naples, FL | 2.0 | 2.0 | 1125 | $1,850 | $1.64 | 23d | 1 | 0.11mi |
| 940 Augusta Blvd Unit D939 Naples, FL | 2.0 | 2.0 | 1419 | $2,200 | $1.55 | 23d | 1 | 0.18mi |
| 709 Augusta Blvd Unit 709-5 Naples, FL | 3.0 | 2.0 | 1480 | $4,000 | $2.70 | 13d | 1 | 0.20mi |
| 705 Augusta Blvd Unit 705-5 Naples, FL | 2.0 | 2.0 | 1125 | $2,000 | $1.78 | 13d | 1 | 0.22mi |
| 701 Augusta Blvd Unit 701-8 Naples, FL | 2.0 | 2.0 | 1250 | $4,800 | $3.84 | 13d | 1 | 0.24mi |
| 605 Augusta Blvd #14 Naples, FL | 2.0 | 2.0 | 1125 | $4,000 | $3.56 | 23d | 1 | 0.26mi |
| 605 Augusta Blvd #4 Naples, FL | 2.0 | 2.0 | 1125 | $3,950 | $3.51 | 13d | 1 | 0.26mi |
| 575 Augusta Blvd Naples, FL | 3.0 | 2.0 | 1500 | $2,100 | $1.40 | 23d | 1 | 0.27mi |
| 5857 Rattlesnake Hammock Rd #208 Naples, FL | 2.0 | 2.0 | 1133 | $3,000 | $2.65 | 13d | 1 | 0.27mi |
| 760 Augusta Blvd Unit D204 Naples, FL | 3.0 | 2.0 | 1294 | $2,300 | $1.78 | 23d | 1 | 0.27mi |
| 555 Augusta Blvd Unit 3-1 Naples, FL | 2.0 | 2.0 | 1249 | $4,200 | $3.36 | 23d | 1 | 0.28mi |
| 413 Augusta Blvd #302 Naples, FL | 2.0 | 2.0 | 1390 | $5,500 | $3.96 | 21d | 1 | 0.30mi |
| 5841 Rattlesnake Hammock Rd Unit 2 Naples, FL | 2.0 | 2.0 | 1133 | $2,500 | $2.21 | 23d | 1 | 0.31mi |
| 5841 Rattlesnake Hammock Rd Unit I-203 Naples, FL | 2.0 | 2.0 | 1015 | $3,500 | $3.45 | 13d | 1 | 0.31mi |
| 5651 Rattlesnake Hammock Rd Unit C-108 Naples, FL | 2.0 | 2.0 | 1054 | $1,800 | $1.71 | 23d | 1 | 0.31mi |
| 5635 Rattlesnake Hammock Rd Apt 203D Naples, FL | 2.0 | 2.0 | 1054 | $1,700 | $1.61 | 21d | 1 | 0.35mi |
| 4556 Andover Way Unit E104 Naples, FL | 2.0 | 2.0 | 1072 | $5,000 | $4.66 | 13d | 1 | 0.38mi |
| 4556 Andover Way Unit E106 Naples, FL | 2.0 | 2.0 | 1172 | $1,900 | $1.62 | 13d | 1 | 0.38mi |
| 520 Augusta Blvd Unit B204 Naples, FL | 3.0 | 2.0 | 1294 | $2,200 | $1.70 | 23d | 1 | 0.40mi |
| 5535 Rattlesnake Hammock Rd #302 Naples, FL | 2.0 | 2.0 | 1205 | $2,800 | $2.32 | 23d | 1 | 0.45mi |
| 265 Deerwood Cir Naples, FL | 2.0 | 2.0 | 1179 | $5,000 | $4.24 | 23d | 1 | 0.46mi |
| 5502 Greenwood Cir #1 Naples, FL | 3.0 | 2.0 | 1450 | $2,400 | $1.66 | 23d | 1 | 0.46mi |
| 5778 Greenwood Cir Naples, FL | 3.0 | 2.0 | 1450 | $4,000 | $2.76 | 23d | 1 | 0.51mi |
| 5595 Greenwood Cir #92 Naples, FL | 3.0 | 2.0 | 1450 | $5,000 | $3.45 | 23d | 1 | 0.59mi |
| 5499 Rattlesnake Hammock Rd Naples, FL | 2.0 | 2.0 | 1071 | $1,775 | $1.66 | 13d | 2 | 0.64mi |
| 5733 Deauville Cir Unit G308 Naples, FL | 3.0 | 2.0 | 1427 | $3,600 | $2.52 | 23d | 1 | 0.64mi |
| 5741 Deauville Cir Unit F108 Naples, FL | 3.0 | 2.0 | 1427 | $3,600 | $2.52 | 23d | 1 | 0.68mi |
| 5932 Cranbrook Way Naples, FL | 2.0 | 2.0 | 1310 | $2,200 | $1.68 | 23d | 1 | 0.70mi |
| 5419 Rattlesnake Hammock Rd Unit 307F Naples, FL | 2.0 | 2.0 | 1071 | $1,950 | $1.82 | 13d | 1 | 0.73mi |
| 4410 Chantelle Dr Unit H-205 Naples, FL | 2.0 | 2.0 | 1349 | $3,500 | $2.59 | 13d | 1 | 0.73mi |
| 332 Charlemagne Blvd Unit H103 Naples, FL | 2.0 | 2.0 | 1082 | $3,495 | $3.23 | 23d | 1 | 0.73mi |
| 332 Charlemagne Blvd Unit H101 Naples, FL | 2.0 | 2.0 | 1082 | $3,500 | $3.23 | 23d | 1 | 0.73mi |
| 452 Bristle Cone Ln #27 Naples, FL | 2.0 | 2.0 | 1129 | $2,000 | $1.77 | 23d | 1 | 0.75mi |
| 360 Charlemagne Blvd Unit D105 Naples, FL | 2.0 | 2.0 | 1082 | $3,200 | $2.96 | 23d | 1 | 0.76mi |
| 5708 Deauville Cir Unit 308 Naples, FL | 3.0 | 2.0 | 1500 | $4,500 | $3.00 | 23d | 1 | 0.76mi |
| 3655 Amberly Cir Naples, FL | 2.0 | 2.0 | 1216 | $2,500 | $2.06 | 23d | 1 | 0.77mi |
| 3685 Amberly Cir Unit D305 Naples, FL | 2.0 | 2.0 | 1320 | $5,100 | $3.86 | 23d | 1 | 0.78mi |
| 5754 Deauville Cir Unit E104 Naples, FL | 1.0 | 2.0 | 1209 | $1,190 | $0.98 | 23d | 1 | 0.78mi |
| 5908 Cranbrook Way Unit I202 Naples, FL | 2.0 | 2.0 | 1318 | $2,500 | $1.90 | 23d | 1 | 0.78mi |
| 315 Saint Andrews Blvd Unit A25 Naples, FL | 2.0 | 2.0 | 1126 | $1,530 | $1.36 | 23d | 1 | 0.81mi |
HOA detail condo
- Monthly dues
- $530 · $6,360/yr
- Assessments
- None detected in remarks — confirm with the listing agent.
Listing history 18 events
-
2026-06-18days on market $270,000 Active 124 DOM
-
2026-06-17days on market $270,000 Active 123 DOM
-
2026-06-16days on market $270,000 Active 122 DOM
-
2026-06-15days on market $270,000 Active 121 DOM
-
2026-06-14days on market $270,000 Active 119 DOM
-
2026-06-10days on market $270,000 Active 116 DOM
-
2026-06-09days on market $270,000 Active 115 DOM
-
2026-06-08days on market $270,000 Active 114 DOM
-
2026-06-07days on market $270,000 Active 113 DOM
-
2026-06-03days on market $270,000 Active 109 DOM
-
2026-06-02days on market $270,000 Active 108 DOM
-
2026-06-01days on market $270,000 Active 107 DOM
-
2026-05-31days on market $270,000 Active 106 DOM
-
2026-05-30days on market $270,000 Active 105 DOM
-
2026-05-02price $270,000
-
2026-02-14$290,000 Active
-
2025-12-19historical
-
2025-02-17$290,000 Active
ⓘ Source: listings_history table (triggers on properties + properties_extension) + one-shot
backfill from property_details.listing_events for pre-trigger history.
Climate risk First Street
- Flood 8/10 Severe FEMA zone X (shaded) · 97% chance over 30 yrs
- Wildfire 3/10 Moderate
- Heat 10/10 Extreme 7 d/yr ≥107°F today · 29 d/yr by 30 yrs out
- Wind 10/10 Extreme 99% chance of damaging wind over 30 yrs
- Air quality 2/10 Low 2 unhealthy d/yr today · 2 by 30 yrs out
Nearby sold comps map
Loading sold comps map…
Walkable amenities ~0.75 mi
Loading nearby amenities…
Taxation est. · year 1
- Rental income
- $39,911
- − Mortgage interest
- −$15,124
- − Property taxes
- −$4,050
- − Insurance
- −$2,148
- − Repairs & maintenance
- −$3,193
- − Management
- −$3,193
- − HOA
- −$6,360
- − Depreciation
- −$7,855
- Taxable loss
- −$2,011
- Est. tax savings @ 24.0%
- +$483
- After-tax cash flow
- $2,464/yr
For passive investors: Depreciation is non-cash, so a rental often shows a tax loss while cash-flowing — sheltering income. Rental losses are passive: they offset passive income freely, and up to $25,000/yr can offset ordinary (W-2) income if you actively participate and your MAGI is under $100k (phasing out to $0 by $150k); unused losses carry forward. On sale, claimed depreciation is recaptured at up to 25%, and gains may owe capital-gains tax (a 1031 exchange can defer both). Figures are a year-1 estimate at your 24.0% rate — not tax advice; consult a CPA.
Schools (NCES district)
- District
- Collier
- NCES district ID
- 1200330
- Math proficiency
- 60% ▼ -4.00%
- Reading proficiency
- 56% ▼ -2.00%
- Median HH income
- $58,275
- Composite
- 50.23/100
- National rank
- #1892
- State rank
- #16 of 73 in FL
Livability — Lely
- Score
- 66/100
- State rank
- #586
- US rank
- #11224
Category grades
Schools grade is shown separately in the Schools card above.
Census & demographics
- Census place
- Lely, FL
- County
- Collier County · 396,295 people
- Metro
- Naples-Marco Island, FL
- Population (ZIP)
- 26,056
- Household income
- $81,674
- Rent vs Own
- Severe rent burden
- 954.0
Population outlook (Collier County) Hauer SSP2
- Today (2025)
- 420,858 people
- By 2030
- 450,054 · +6.9%
- By 2040
- 502,232 · +19.3%
- By 2050
- 544,932 · +29.5%
- By 2075
- 627,203 · +49.0%
- By 2100
- 659,015 · +56.6%
Race, ethnicity, and origin ACS 2023
- Neighborhood character
- Diverse neighborhood (Simpson 0.59)
- Race & ethnicity
- White 56% Hispanic / Latino 28% Black 12% Two or more races 11% Asian 2%
- Hispanic origin (detail)
- Mexican 17% Puerto Rican 3% Cuban 2%
- Common ancestry
- Hispanic 10% Romanian 3% Lithuanian 2%
- Foreign-born
- 26% · Canada, Jamaica, Vietnam
- Languages at home
- 63% English-only · Spanish 24% French/Haitian/Cajun 9% Other Indo-European 2%
Political lean MEDSL · Collier
- 2024 margin
- Solid R (+33.1) · D 33.1% · R 66.2%
- 2008→2024 swing
- -10.6pp toward R · 2008: -22.5pp · 2024: -33.1pp
- All cycles
- 2024: R+33.1 2020: R+24.7 2016: R+26.0 2012: R+30.1 2008: R+22.5
Not yet ingested
- Civics
- —
Market trends
- HPI YoY
- ▼ -194.86%
- Current HPI
- 279.4232
- Rent YoY
- ▲ 5.59%
- Metro
- Naples-Marco Island, FL
- State GDP YoY
- ▲ 3.28%
- F500 in state
- 36
Industry mix (Fortune 500 HQ in FL)
| Industry | F500 HQs | Revenue |
|---|---|---|
| Industrial Technology | 2 | $29B |
|
||
| Insurance | 2 | $17B |
|
||
| Retail | 1 | $60B |
|
||
| Technology Distribution | 1 | $58B |
|
||
| Homebuilding | 1 | $35B |
|
||
| Technology Manufacturing | 1 | $35B |
|
||
Price history
-6.9% since first listed4 events — show timeline
- 2026-05-02 Price Changed $270,000 NAPLESMLS
- 2026-02-14 Listed $290,000 NAPLESMLS
- 2025-12-19 Listing Removed — NAPLESMLS
- 2025-02-17 Listed $290,000 NAPLESMLS
Cash-flow waterfall
monthlySold comps — $/sqft
last 12 mo · ≤1 miLoading sold comps…