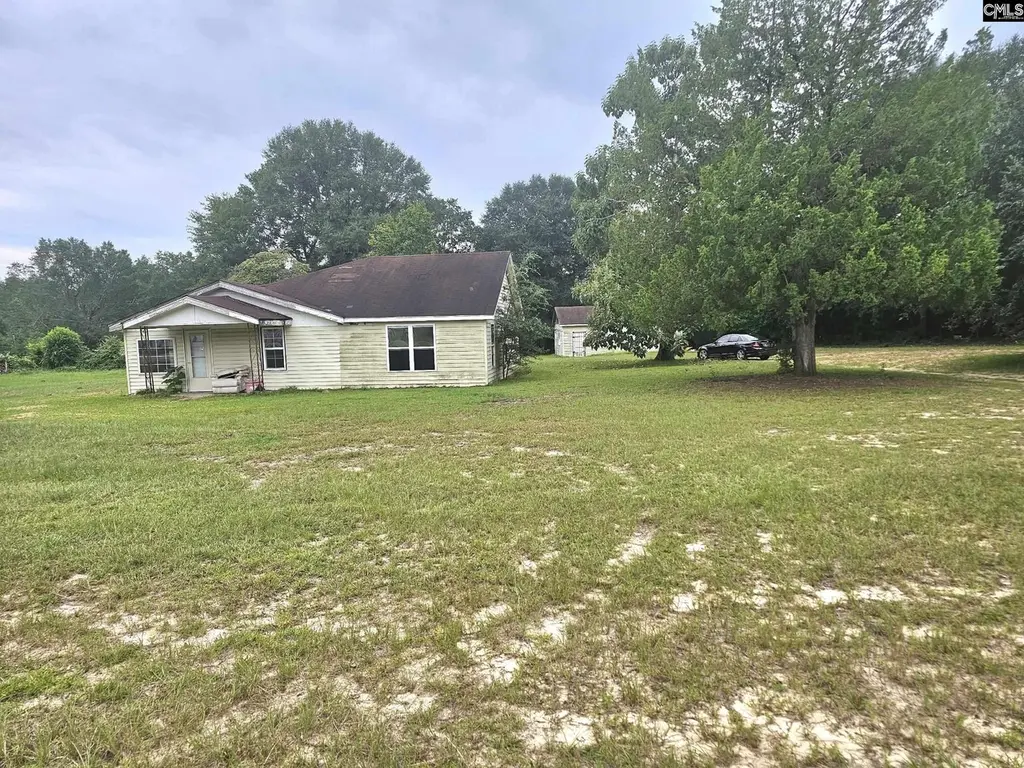
4412 Festival Trail Rd · Perry, SC
Flood risk 1/10 · Minimal
- FEMA flood zone
- X (unshaded)
- Chance of flooding over 30 yrs
- 0.0%
- Est. flood insurance / yr
- $507 – $1,088
Fire risk 5/10 · Moderate
- Est. fire insurance / yr
- $783 – $1,453
Heat risk 7/10 · Major
- Hot days now (above 108°F)
- 7 days/yr
- Hot days in 30 yrs
- 16 days/yr
Wind risk 6/10 · Moderate
- Chance of severe wind over 30 yrs
- 73.0%
Air-quality risk 3/10 · Minor
- Unhealthy air days now
- 3 days/yr
- Unhealthy air days in 30 yrs
- 3 days/yr
Risk factors via First Street. Map © Google.
Why this score? — see what drove the B- grade
The composite is a weighted blend of 9 inputs, each scored 0–100. Each bar is that input's sub-score; the figure is the points it added to the 100-point composite (weight × sub-score).
- Cash flow +30.0/30.0
- 1% rule +10.0/10.0
- DSCR +10.0/10.0
- ARV discount +7.5/15.0
- Schools +3.2/10.0
- Rent growth +2.5/5.0
- Livability +2.5/5.0
- Condition / age +2.5/5.0
- Appreciation +0.0/10.0
$77,500
🖨 Deal sheet (PDF) 📄 Offer letter ✓ Due diligence
Listing remarks
Rare 1.69 Acres with Large Workshop – Live/Work Opportunity Near Downtown Wagner, South Carolina! Discover the potential of this unique property offering 1.69 acres, a 1,440 sq. ft. detached garage/workshop, and a 2-bedroom, 2-bath home ready for your vision. This is a beautiful piece of property. Whether you're looking for space to live, work, or create, this property offers flexibility that’s hard to find. The standout feature is the expansive workshop/garage, ideal for business use, hobbies, storage, or equipment—making this a perfect fit for contractors, small business owners, or anyone needing space beyond a typical residential property. The home is currently in renov
Key facts
- Rud zoning
- 1.69 acres
- Large workshop
Tags
Property features AI
Exterior
- Parking: Detached garage with 1 garage space (main level access)
- Utilities: Public water; Septic sewer
- Home design: Single-story home
- Construction: Slab foundation
- Exterior features: Block and vinyl exterior finish; Paved road frontage
Interior
- Bedrooms: Master bedroom on the main level; Second bedroom on the main level
- Bathrooms: Two full bathrooms
- Heating & cooling: Total heated area approximately 1,330
- Interior features: Great room on the main level; Dining room on the main level; Kitchen on the main level
Neighborhood map
What this means for you Summary
Snapshot
- This is a 2-bed/2.0-bath single-family listed at $78k.
Deal economics
- At list price, monthly cash flow is $770 ($9k/yr) — positive.
- The deal already cash-flows at list — no discount required.
- Meets the 1% rule at list price ($2k rent vs $78k).
- Recommended offer: $75k (3.0% below list) — sets the bar for market timing.
Location & tenants
- Location reads 50/100 on livability (#364 in SC) — a working-class tenant base; expect higher turnover. Strengths: cost of living A+, housing A; Watch: crime F, amenities F, commute F.
- Aiken 01 (suburban): math 31% / reading 44% proficiency, ranked #36 of 80 in SC (top 45%) — families likely to look elsewhere, expect single-tenant / working-renter base with shorter leases.
- Zoned schools: Cyril B. Busbee Elementary (math 22% / reading 27%, grade F, #452 of 597 statewide, top 78%, 472 students, 100% FRL); Wagener-Sally High (math 17% / reading 72%, grade F, #166 of 196 statewide, top 87%, 265 students, 100% FRL) — zoned schools average 100% FRL vs 54% district-wide (46 pts higher); higher-poverty schools than district average — tighter screening recommended.
- Market conditions: 77 active listings in the ZIP; 2,500 units permitted in Aiken County in 2024 (1,023 in 5+ unit buildings).
Forward outlook
- Local home prices are declining (-3.0%/yr); year-one equity from $536 of loan paydown is wiped out by about $2k of value loss. Plan a longer hold.
- Aiken County population projected at +9% by 2050 — modest demand growth; plan on rents tracking national, not racing it.
- At projected returns (-3.0% appreciation + 3.0% rent growth), your $22k cash investment doubles in ~3 years — after that, you're playing with house money.
Negotiation context
- It's been on market 39 days — a 3% lower offer ($75k) is reasonable based on typical stale-listing flexibility.
- 4 sale attempts with the ask held roughly flat each time — persistent listings suggest the price (not the market) is what's stuck; bring a comps-based counter.
- Current owner paid $30k; list at $78k implies a 162% gain — meaningful room to come down on a strong offer.
Risks & watch-outs
- Climate carrying-cost: major wind risk, 73% chance of damaging wind over 30y; moderate wildfire risk; extreme-heat days projected 7→16/yr by 2055 (HVAC capex compounding) — expect insurance premiums to compound above CPI over the hold.
Questions for the listing agent
- It's been on market 39 days. Have you received any prior offers? Is the seller open to a 3% concession, seller financing, or rate buy-down credit?
- Built in 1963 — when were the roof, HVAC, electrical panel, plumbing, and water heater last replaced?
- Is there a deadline driving the sale (1031 exchange, divorce, estate, relocation)? That informs how much negotiation room exists.
- Schools are F-rated, which usually means shorter tenancies and higher turnover. Who's the typical renter profile here, and what's been the actual vacancy rate?
- Crime grade is F in this area — have there been break-ins, vandalism, or insurance claims at this property in the last 3 years? What carrier currently insures it and at what premium?
- What's the average days-on-market for RENTAL listings here right now (not sales)? A rising rental-DOM trend means longer vacancies and softer asking-rent achievability than the comps imply.
- What's the recent tenant-quality profile in this submarket — average credit score on applications, eviction rate, late-payment / NSF rate, and stable-employment percentage? A property-management company in the area should have these aggregated.
- How much new for-sale + rental construction is in the pipeline within 1–3 miles? Heavy new supply typically softens prices + rents 12–24 months out; constrained supply supports both.
Investment metrics
- 1% rule
- 2.02% ✓
- Cap rate
- 18.22%
- Cash-on-cash
- 42.59%
- DSCR
- 2.90
- GRM
- 4.1
CMA / ARV
- ARV (on-the-fly)
- $196,840
- Comps found
- 6
Show comp detail 6 sales within ~0.75 mi
| Address | Dist | Beds/Ba | Sqft | Sold | Price | $/sf | Match |
|---|---|---|---|---|---|---|---|
| 256 Jeffcoat Rd | 0.20mi | 3/2.0 (+1) | 1,399 (+5%) | 14mo | $206,500 | $148 | 65 |
| 4517 Festival Trail Rd | 0.50mi | 3/1.0 (+1) | 1,300 (-2%) | 10mo | $178,000 | $137 | 56 |
| 202 Rainbow Dr | 0.43mi | 3/2.0 (+1) | 1,232 (-7%) | 11mo | $430,000 | $349 | 54 |
| 111 Airport Rd | 0.23mi | 3/1.0 (+1) | 1,250 (-6%) | 23mo | $141,500 | $113 | 52 |
| 4511 Festival Trail Rd | 0.49mi | 3/1.0 (+1) | 1,450 (+9%) | 7mo | $169,900 | $117 | 48 |
| 255 Rainbow Dr | 0.70mi | 3/2.0 (+1) | 1,450 (+9%) | 14mo | $224,990 | $155 | 35 |
Match score weights: distance 35% · size 25% · config 20% · recency 20%. Top-matched comps best support the ARV.
Projected returns pro-forma
-3.0% appreciation · 3.0% rent growth · sell at horizon
- IRR
- 39.3%
- Equity multiple
- 2.68×
- Total profit
- $36,481
- Equity at exit
- $11,556
- IRR
- 45.7%
- Equity multiple
- 5.37×
- Total profit
- $94,865
- Equity at exit
- $6,701
Cash invested: $21,700 (down + closing). Projections, not guarantees.
Landlord ↔ Tenant lean methodology
- Overall (STATE)
- 90 Strongly Landlord-Friendly
- State South Carolina
- 90 Strongly Landlord-Friendly · R+6
- County
- — inherits STATE
- City
- — inherits STATE
ZIP-level market 29164
- Home prices YoY
- -7.0%
- Active inventory
- 77
- Price-to-rent
- 4.1×
Monthly cashflow live
- Estimated rent
- $1,569 medium interval (Pro) →
- Mortgage (P&I)
- −$406
- Tax from tax record
- −$31 /mo · $368/yr
- Insurance
- −$32
- HOA
- −$0
- Vacancy / Maint / Mgmt
- −$330
- Net cashflow
- $770
Break-even live
Sensitivity live
| Price | -10% $814 | -5% $792 | +0% $770 | +5% $748 | +10% $726 |
|---|---|---|---|---|---|
| Rent | -10% $646 | -5% $708 | +0% $770 | +5% $832 | +10% $894 |
| Rate | -1.0pp $809 | -0.5pp $790 | base $770 | +0.5pp $750 | +1.0pp $730 |
UW: 25.0% down · 7.5% · 30yr · 1.5% tax · 5.0% vac · 8.0% maint · 8.0% mgmt
Financing live
Cash to close
- Down payment
- $19,375
- Closing costs
- $2,325
- Reserves months
- —
- Total cash needed
- —
Loan-product check · same deal, 3 products live
Conventional
25% down · 7.5% · 30yr
- Down + closing
- —
- Monthly P&I
- —
- Monthly cashflow
- —
- DSCR
- —
- Eligible?
- —
Personal DTI + credit; lowest rate.
DSCR
20% down · 8.5% · 30yr
- Down + closing
- —
- Monthly P&I
- —
- Monthly cashflow
- —
- DSCR
- —
- Eligible?
- —
No personal income docs; deal must DSCR.
Hard money
10% down · 12.0% · 12mo
- Down + closing
- —
- Monthly P&I
- —
- Monthly cashflow
- —
- DSCR
- —
- Eligible?
- —
Short-term bridge; refi at stabilization.
Listing history 28 events
-
2026-06-21days on market $77,500 Active 39 DOM
-
2026-06-18days on market $77,500 Active 36 DOM
-
2026-06-17days on market $77,500 Active 35 DOM
-
2026-06-16days on market $77,500 Active 34 DOM
-
2026-06-15days on market $77,500 Active 33 DOM
-
2026-06-14days on market $77,500 Active 31 DOM
-
2026-06-13days on market $77,500 Active 30 DOM
-
2026-06-10days on market $77,500 Active 28 DOM
-
2026-06-09days on market $77,500 Active 27 DOM
-
2026-06-08days on market $77,500 Active 26 DOM
-
2026-06-07days on market $77,500 Active 25 DOM
-
2026-06-03days on market $77,500 Active 21 DOM
-
2026-06-02days on market $77,500 Active 20 DOM
-
2026-06-01days on market $77,500 Active 19 DOM
-
2026-05-31days on market $77,500 Active 18 DOM
-
2026-05-30days on market $77,500 Active 17 DOM
-
2026-05-12$77,500 Active
-
2026-05-01historical
-
2026-04-19status Active
-
2026-04-19historical Active - Contingent
-
2026-01-27status Active
-
2026-01-16historical Active - Contingent
-
2025-12-03price $79,000
-
2025-12-03price $80,000
-
2025-10-05price $100,000
-
2025-08-25$140,000 Active
-
2009-12-14soldstatus $29,577
-
1997-11-07soldstatus $21,000
ⓘ Source: listings_history table (triggers on properties + properties_extension) + one-shot
backfill from property_details.listing_events for pre-trigger history.
Tax reassessment forecast SC · Resets to sale price
- Current annual tax
- $368 · $31/mo
- Projected year-2 tax
- $442 · $37/mo
- Expected delta
- +$73/yr (+$6/mo · 19.9%)
ⓘ Screening estimate from a state-policy table — verify with the county assessor before closing.
Climate risk First Street
- Flood 1/10 Low FEMA zone X (unshaded) · 0% chance over 30 yrs
- Wildfire 5/10 Major
- Heat 7/10 Severe 7 d/yr ≥108°F today · 16 d/yr by 30 yrs out
- Wind 6/10 Major 73% chance of damaging wind over 30 yrs
- Air quality 3/10 Moderate 3 unhealthy d/yr today · 3 by 30 yrs out
Nearby sold comps map
Loading sold comps map…
Walkable amenities ~0.75 mi
Loading nearby amenities…
Taxation est. · year 1
- Rental income
- $18,830
- − Mortgage interest
- −$4,341
- − Property taxes
- −$368
- − Insurance
- −$388
- − Repairs & maintenance
- −$1,506
- − Management
- −$1,506
- − Depreciation
- −$2,255
- Taxable income
- $8,465
- Est. tax owed @ 24.0%
- −$2,032
- After-tax cash flow
- $7,211/yr
For passive investors: Depreciation is non-cash, so a rental often shows a tax loss while cash-flowing — sheltering income. Rental losses are passive: they offset passive income freely, and up to $25,000/yr can offset ordinary (W-2) income if you actively participate and your MAGI is under $100k (phasing out to $0 by $150k); unused losses carry forward. On sale, claimed depreciation is recaptured at up to 25%, and gains may owe capital-gains tax (a 1031 exchange can defer both). Figures are a year-1 estimate at your 24.0% rate — not tax advice; consult a CPA.
Schools (NCES district)
- District
- Aiken 01
- NCES district ID
- 4500720
- Math proficiency
- 31% ▼ -11.00%
- Reading proficiency
- 44% ▼ -1.00%
- Median HH income
- $45,081
- Composite
- 31.91/100
- National rank
- #5857
- State rank
- #36 of 80 in SC
Livability — Perry
- Score
- 50/100
- State rank
- #364
- US rank
- #25633
Category grades
Schools grade is shown separately in the Schools card above.
Census & demographics
- Population (ZIP)
- 4,961
Population outlook (Aiken County) Hauer SSP2
- Today (2025)
- 178,003 people
- By 2030
- 182,876 · +2.7%
- By 2040
- 189,970 · +6.7%
- By 2050
- 193,840 · +8.9%
- By 2075
- 199,453 · +12.1%
- By 2100
- 192,403 · +8.1%
Race, ethnicity, and origin ACS 2023
- Neighborhood character
- Diverse neighborhood (Simpson 0.61)
- Race & ethnicity
- White 56% Black 25% Two or more races 14% Hispanic / Latino 14%
- Hispanic origin (detail)
- Puerto Rican 2%
- Common ancestry
- Italian 11% Slovak 1% Serbian 1%
- Foreign-born
- 2% · Canada
Political lean MEDSL · Aiken
- 2024 margin
- Strong R (+25.9) · D 36.4% · R 62.2% · Other 1.4%
- 2008→2024 swing
- -1.9pp toward R · 2008: -24.0pp · 2024: -25.9pp
- All cycles
- 2024: R+25.9 2020: R+22.7 2016: R+27.5 2012: R+26.0 2008: R+24.0
Not yet ingested
- Civics
- —
Market trends
- HPI YoY
- ▼ -20.87%
- Current HPI
- 276.73
- Rent YoY
- —
- Metro
- —
- State GDP YoY
- ▲ 4.51%
- F500 in state
- 2
Industry mix (Fortune 500 HQ in SC)
| Industry | F500 HQs | Revenue |
|---|---|---|
| Packaging | 1 | $7B |
|
||
Price history
+269.0% since first listed12 events — show timeline
- 2026-05-12 Listed $77,500 Consolidated MLS
- 2026-05-01 Delisted — Consolidated MLS
- 2026-04-19 Relisted — Consolidated MLS
- 2026-04-19 Contingent — Consolidated MLS
- 2026-01-27 Relisted — Consolidated MLS
- 2026-01-16 Contingent — Consolidated MLS
- 2025-12-03 Price Changed $79,000 Consolidated MLS
- 2025-12-03 Price Changed $80,000 Consolidated MLS
- 2025-10-05 Price Changed $100,000 Consolidated MLS
- 2025-08-25 Listed $140,000 Consolidated MLS
- 2009-12-14 Sold (Public Records) $29,577 Public Records
- 1997-11-07 Sold (Public Records) $21,000 Public Records
Property tax history
+3.0%/yrLatest (2025): $368 · -6.4% YoY. Source: county tax records.
Cash-flow waterfall
monthlySold comps — $/sqft
last 12 mo · ≤1 miLoading sold comps…