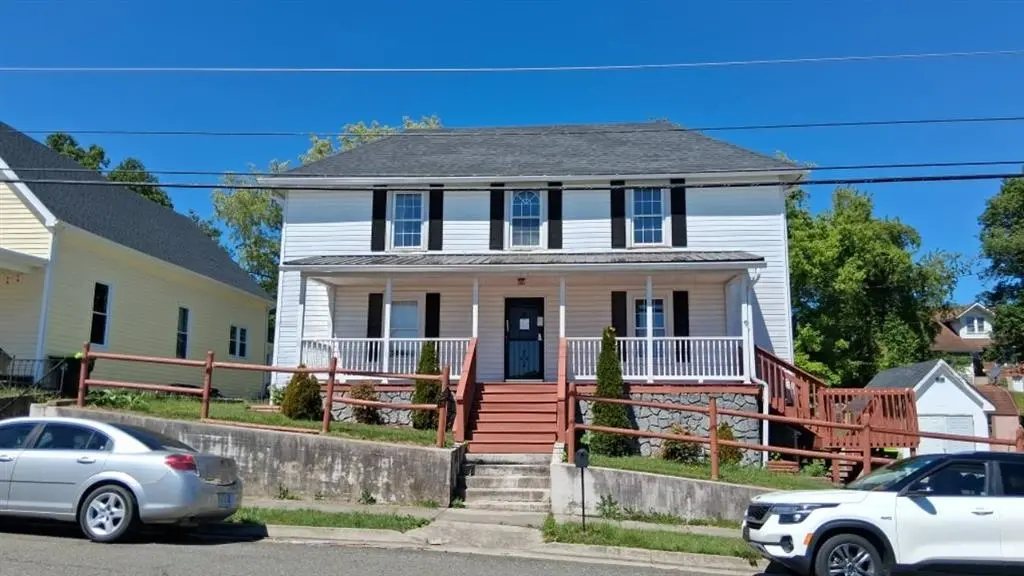
128 Valley St · Pulaski, VA
Flood risk No data
- FEMA flood zone
- —
- Chance of flooding over 30 yrs
- —
- Est. flood insurance / yr
- —
Fire risk No data
- Est. fire insurance / yr
- —
Heat risk No data
- Hot days now (above threshold)
- —
- Hot days in 30 yrs
- —
Wind risk No data
- Chance of severe wind over 30 yrs
- —
Air-quality risk No data
- Unhealthy air days now
- —
- Unhealthy air days in 30 yrs
- —
Risk factors via First Street. Map © Google.
Why this score? — see what drove the B+ grade
The composite is a weighted blend of 9 inputs, each scored 0–100. Each bar is that input's sub-score; the figure is the points it added to the 100-point composite (weight × sub-score).
- Cash flow +30.0/30.0
- ARV discount +15.0/15.0
- DSCR +10.0/10.0
- 1% rule +8.4/10.0
- Schools +4.6/10.0
- Livability +3.4/5.0
- Rent growth +2.5/5.0
- Condition / age +2.5/5.0
- Appreciation +0.0/10.0
$107,800
🖨 Deal sheet 📄 Offer letter ✓ Due diligence
Listing remarks
Beautiful home in the heart of Pulaski! This home features 4 spacious bedrooms and 2 bathrooms, large kitchen, amazing deck and gazebo, Located near shopping & dining and a short drive to Interstate 81. It’s a well maintained home that needs some TLC. Selling as is.
Key facts
- Near dining
- Near shopping
- Amazing deck
Tags
Property features AI
Exterior
- Parking: Detached 1-car garage
- Utilities: Public water; Public sewer
- Home design: Detached single-family residence; Residential zoning
- Construction: Aluminum siding; Metal and shingle roof; 1,929 above-grade finished area
- Exterior features: Deck; Porch; Gazebo; Shed(s)
Interior
- Flooring: Laminate
- Bathrooms: 2 full bathrooms
- Heating & cooling: Central air conditioning; Forced air heating
- Interior features: Electric water heater; Laminate flooring; 6 total rooms
Neighborhood map
What this means for you Summary
Snapshot
- This is a 4-bed/2.0-bath single-family listed at $108k.
Deal economics
- At list price, monthly cash flow is $478 ($6k/yr) — positive.
- The deal already cash-flows at list — no discount required.
- Meets the 1% rule at list price ($1k rent vs $108k).
- Recommended offer: $105k (3.0% below list) — sets the bar for market timing.
- Cap rate 11.6% vs local median 5.5% in Pulaski — top-decile yield for the area; either an underpriced asset or a hidden risk that comps aren't pricing in. Stress-test before assuming the spread holds.
Location & tenants
- Location reads 67/100 on livability (#297 in VA) — a middle-class / working-renter tenant base. Strengths: cost of living A+, housing A+, health & safety A+; Watch: employment D+, crime F, amenities F.
- Pulaski County Public School District (rural): math 48% / reading 61% proficiency, ranked #86 of 131 in VA (top 66%) — acceptable for families but not a draw, mixed tenant base, ~2y average lease.
- Zoned schools: Critzer Elementary (math 42% / reading 47%, grade F, #827 of 1,108 statewide, top 77%, 402 students, 80% FRL); Pulaski County Middle (math 38% / reading 60%, grade C-, #238 of 342 statewide, top 71%, 807 students, 77% FRL); Pulaski County Senior High (math 63% / reading 70%, grade B, #195 of 319 statewide, top 62%, 1,246 students, 76% FRL) — zoned schools average 78% FRL vs 47% district-wide (31 pts higher); higher-poverty schools than district average — tighter screening recommended.
- Market conditions: 114 active listings in the ZIP; 39 units permitted in Pulaski County in 2024 (0 in 5+ unit buildings).
Forward outlook
- Local home prices are declining (-3.0%/yr); year-one equity from $745 of loan paydown is wiped out by about $3k of value loss. Plan a longer hold.
- Pulaski County population projected at -19% by 2050 — secular population decline; favor cash flow + early exit over multi-decade hold.
- At projected returns (-3.0% appreciation + 3.0% rent growth), your $30k cash investment doubles in ~7 years — after that, you're playing with house money.
Negotiation context
- It's been on market 42 days — a 3% lower offer ($105k) is reasonable based on typical stale-listing flexibility.
- Current owner paid $49k; list at $108k implies a 120% gain — meaningful room to come down on a strong offer.
Risks & watch-outs
- Watch-outs: built in 1900 — expect roof / HVAC / electrical / plumbing capex.
Questions for the listing agent
- It's been on market 42 days. Have you received any prior offers? Is the seller open to a 3% concession, seller financing, or rate buy-down credit?
- Built in 1900 — when were the roof, HVAC, electrical panel, plumbing, and water heater last replaced?
- Is there a deadline driving the sale (1031 exchange, divorce, estate, relocation)? That informs how much negotiation room exists.
- Schools are B-rated — typically a magnet for longer-tenancy family renters. What's the average tenant stay here, and is there a school-zone premium baked into asking?
- Crime grade is F in this area — have there been break-ins, vandalism, or insurance claims at this property in the last 3 years? What carrier currently insures it and at what premium?
- What's the average days-on-market for RENTAL listings here right now (not sales)? A rising rental-DOM trend means longer vacancies and softer asking-rent achievability than the comps imply.
- What's the recent tenant-quality profile in this submarket — average credit score on applications, eviction rate, late-payment / NSF rate, and stable-employment percentage? A property-management company in the area should have these aggregated.
- How much new for-sale + rental construction is in the pipeline within 1–3 miles? Heavy new supply typically softens prices + rents 12–24 months out; constrained supply supports both.
Investment metrics
- 1% rule
- 1.34% ✓
- Cap rate
- 11.61%
- Cash-on-cash
- 18.98%
- DSCR
- 1.84
- GRM
- 6.2
CMA / ARV
- ARV (median comp)
- $167,586
- List price
- $107,800
- Delta
- -35.67%
- Verdict
- UNDERPRICED
- Comps
- 20 within 1.0 mi
Show comp detail 12 sales within ~0.75 mi
| Address | Dist | Beds/Ba | Sqft | Sold | Price | $/sf | Match |
|---|---|---|---|---|---|---|---|
| 404 SW First St | 0.07mi | 4/1.0 | 1,914 (-1%) | 2mo | $190,000 | $99 | 90 |
| 129 Cliff St | 0.16mi | 3/2.0 (-1) | 1,928 (-0%) | 6mo | $200,000 | $104 | 83 |
| 422 Pulaski St | 0.19mi | 4/1.0 | 1,897 (-2%) | 4mo | $30,000 | $16 | 81 |
| 224 Lagrange St | 0.12mi | 4/2.0 | 1,652 (-14%) | 4mo | $200,000 | $121 | 67 |
| 336 2nd St SW | 0.05mi | 4/1.5 | 2,082 (+8%) | 19mo | $228,000 | $110 | 67 |
| 309 Henry Ave | 0.38mi | 3/2.0 (-1) | 1,868 (-3%) | 8mo | $150,000 | $80 | 66 |
| 126 7th St NW | 0.68mi | 4/2.0 | 1,905 (-1%) | 7mo | $227,600 | $119 | 60 |
| 128 Lexington Ave | 0.33mi | 5/2.0 (+1) | 2,180 (+13%) | 1mo | $75,000 | $34 | 57 |
| 324 Longview Ct | 0.74mi | 4/2.0 | 2,000 (+4%) | 13mo | $170,000 | $85 | 49 |
| 20 7th St NW | 0.73mi | 3/3.0 (-1) | 2,053 (+6%) | 4mo | $289,000 | $141 | 43 |
| 402 Draper Ave | 0.56mi | 4/3.0 | 1,694 (-12%) | 17mo | $195,000 | $115 | 36 |
| 312 Longview Ct | 0.75mi | 3/1.0 (-1) | 2,138 (+11%) | 21mo | $200,000 | $94 | 21 |
Match score weights: distance 35% · size 25% · config 20% · recency 20%. Top-matched comps best support the ARV.
Projected returns pro-forma
-3.0% appreciation · 3.0% rent growth · sell at horizon
- IRR
- 10.8%
- Equity multiple
- 1.43×
- Total profit
- $12,916
- Equity at exit
- $16,073
- IRR
- 19.9%
- Equity multiple
- 2.67×
- Total profit
- $50,287
- Equity at exit
- $9,321
Cash invested: $30,184 (down + closing). Projections, not guarantees.
Landlord ↔ Tenant lean methodology
- Overall (STATE)
- 55 Moderately Landlord-Leaning
- State Virginia
- 55 Moderately Landlord-Leaning · D+2
- County
- — inherits STATE
- City
- — inherits STATE
ZIP-level market 24301
- Active inventory
- 114
- Price-to-rent
- 6.2×
Monthly cashflow live
- Estimated rent
- $1,440 medium interval (Pro) →
- Mortgage (P&I)
- −$565
- Tax from tax record
- −$50 /mo · $601/yr
- Insurance
- −$45
- HOA
- −$0
- Vacancy / Maint / Mgmt
- −$302
- Net cashflow
- $478
Break-even live
UW: 25.0% down · 7.5% · 30yr · 1.5% tax · 5.0% vac · 8.0% maint · 8.0% mgmt
Financing live
Cash to close
- Down payment
- $26,950
- Closing costs
- $3,234
- Reserves months
- —
- Total cash needed
- —
Loan-product check · same deal, 3 products live
Conventional
25% down · 7.5% · 30yr
- Down + closing
- —
- Monthly P&I
- —
- Monthly cashflow
- —
- DSCR
- —
- Eligible?
- —
Personal DTI + credit; lowest rate.
DSCR
20% down · 8.5% · 30yr
- Down + closing
- —
- Monthly P&I
- —
- Monthly cashflow
- —
- DSCR
- —
- Eligible?
- —
No personal income docs; deal must DSCR.
Hard money
10% down · 12.0% · 12mo
- Down + closing
- —
- Monthly P&I
- —
- Monthly cashflow
- —
- DSCR
- —
- Eligible?
- —
Short-term bridge; refi at stabilization.
Listing history 20 events
-
2026-06-19days on market $107,800 Active 42 DOM
-
2026-06-18days on market $107,800 Active 41 DOM
-
2026-06-17days on market $107,800 Active 40 DOM
-
2026-06-16days on market $107,800 Active 39 DOM
-
2026-06-15days on market $107,800 Active 38 DOM
-
2026-06-14days on market $107,800 Active 36 DOM
-
2026-06-13days on market $107,800 Active 35 DOM
-
2026-06-10days on market $107,800 Active 33 DOM
-
2026-06-09days on market $107,800 Active 32 DOM
-
2026-06-08days on market $107,800 Active 31 DOM
-
2026-06-07days on market $107,800 Active 30 DOM
-
2026-06-05days on market $107,800 Active 27 DOM
-
2026-06-02days on market $107,800 Active 25 DOM
-
2026-06-01days on market $107,800 Active 24 DOM
-
2026-05-31days on market $107,800 Active 23 DOM
-
2026-05-30days on market $107,800 Active 22 DOM
-
2026-05-09$127,800 Active 278-char remark
-
2026-03-03soldstatus $169,500
-
2015-06-29soldstatus $43,500
-
2008-02-21soldstatus $127,500
ⓘ Source: listings_history table (triggers on properties + properties_extension) + one-shot
backfill from property_details.listing_events for pre-trigger history.
Tax reassessment forecast VA · Resets to sale price
- Current annual tax
- $601 · $50/mo
- Projected year-2 tax
- $884 · $74/mo
- Expected delta
- +$283/yr (+$24/mo · 47.1%)
ⓘ Screening estimate from a state-policy table — verify with the county assessor before closing.
Nearby sold comps map
Loading sold comps map…
Walkable amenities ~0.75 mi
Loading nearby amenities…
Taxation est. · year 1
- Rental income
- $17,284
- − Mortgage interest
- −$6,038
- − Property taxes
- −$601
- − Insurance
- −$539
- − Repairs & maintenance
- −$1,383
- − Management
- −$1,383
- − Depreciation
- −$3,136
- Taxable income
- $4,204
- Est. tax owed @ 24.0%
- −$1,009
- After-tax cash flow
- $4,721/yr
For passive investors: Depreciation is non-cash, so a rental often shows a tax loss while cash-flowing — sheltering income. Rental losses are passive: they offset passive income freely, and up to $25,000/yr can offset ordinary (W-2) income if you actively participate and your MAGI is under $100k (phasing out to $0 by $150k); unused losses carry forward. On sale, claimed depreciation is recaptured at up to 25%, and gains may owe capital-gains tax (a 1031 exchange can defer both). Figures are a year-1 estimate at your 24.0% rate — not tax advice; consult a CPA.
Schools (NCES district)
- District
- Pulaski County Public School District
- NCES district ID
- 5103150
- Math proficiency
- 48% ▼ -31.00%
- Reading proficiency
- 61% ▼ -13.00%
- Median HH income
- $44,912
- Composite
- 45.98/100
- National rank
- #2537
- State rank
- #86 of 131 in VA
Livability — Pulaski
- Score
- 67/100
- State rank
- #297
- US rank
- #10639
Category grades
Schools grade is shown separately in the Schools card above.
Census & demographics
- Census place
- Pulaski, VA
- Population (ZIP)
- 13,370
Population outlook (Pulaski County) Hauer SSP2
- Today (2025)
- 32,949 people
- By 2030
- 31,812 · -3.5%
- By 2040
- 29,224 · -11.3%
- By 2050
- 26,691 · -19.0%
- By 2075
- 21,312 · -35.3%
- By 2100
- 15,697 · -52.4%
Race, ethnicity, and origin ACS 2023
- Neighborhood character
- Predominantly White (89%)
- Race & ethnicity
- White 89% Two or more races 5% Black 4% Hispanic / Latino 3%
- Common ancestry
- Serbian 2% Italian 2% Iranian 1%
- Foreign-born
- 2% · Vietnam, Canada
- Languages at home
- 97% English-only · Spanish 1%
Political lean MEDSL · Pulaski
- 2024 margin
- Solid R (+44.7) · D 27.3% · R 72.0%
- 2008→2024 swing
- -25.1pp toward R · 2008: -19.5pp · 2024: -44.7pp
- All cycles
- 2024: R+44.7 2020: R+41.5 2016: R+40.7 2012: R+24.8 2008: R+19.5
Not yet ingested
- Civics
- —
Market trends
- HPI YoY
- ▼ -88.98%
- Current HPI
- 144.6556
- Rent YoY
- —
- Metro
- —
- State GDP YoY
- ▲ 2.40%
- F500 in state
- 50
Industry mix (Fortune 500 HQ in VA)
| Industry | F500 HQs | Revenue |
|---|---|---|
| Aerospace / Defense | 4 | $236B |
|
||
| Technology / Defense | 3 | $32B |
|
||
| Financial Services | 2 | $176B |
|
||
| Utilities | 2 | $27B |
|
||
| Insurance | 2 | $25B |
|
||
| Technology | 2 | $15B |
|
||
Price history
-15.5% since first listed7 events — show timeline
- 2026-05-29 Price Changed $107,800 NRVMLS
- 2026-05-20 Price Changed $117,800 NRVMLS
- 2026-05-09 Listed $127,800 NRVMLS
- 2026-05-07 Sold (Public Records) $49,100 Public Records
- 2026-03-03 Sold (Public Records) $169,500 Public Records
- 2015-06-29 Sold (Public Records) $43,500 Public Records
- 2008-02-21 Sold (Public Records) $127,500 Public Records
Property tax history
-1.6%/yrLatest (2026): $601 · +0.0% YoY. Source: county tax records.
Cash-flow waterfall
monthlySold comps — $/sqft
last 12 mo · ≤1 miLoading sold comps…