1025 S 5th St · Chickasha, OK
Flood risk 1/10 · Minimal
- FEMA flood zone
- X (unshaded)
- Chance of flooding over 30 yrs
- 0.0%
- Est. flood insurance / yr
- $507 – $1,088
Fire risk 3/10 · Minor
- Est. fire insurance / yr
- $2,463 – $4,575
Heat risk 6/10 · Moderate
- Hot days now (above 109°F)
- 7 days/yr
- Hot days in 30 yrs
- 19 days/yr
Wind risk 2/10 · Minimal
- Chance of severe wind over 30 yrs
- 3.0%
Air-quality risk 2/10 · Minimal
- Unhealthy air days now
- 1 days/yr
- Unhealthy air days in 30 yrs
- 2 days/yr
Risk factors via First Street. Map © Google.
Why this score? — see what drove the B- grade
The composite is a weighted blend of 9 inputs, each scored 0–100. Each bar is that input's sub-score; the figure is the points it added to the 100-point composite (weight × sub-score).
- Cash flow +30.0/30.0
- 1% rule +10.0/10.0
- DSCR +10.0/10.0
- ARV discount +7.5/15.0
- Livability +3.3/5.0
- Rent growth +2.5/5.0
- Condition / age +2.5/5.0
- Schools +2.1/10.0
- Appreciation +0.0/10.0
$52,000
🖨 Deal sheet 📄 Offer letter ✓ Due diligence
Listing remarks MLS
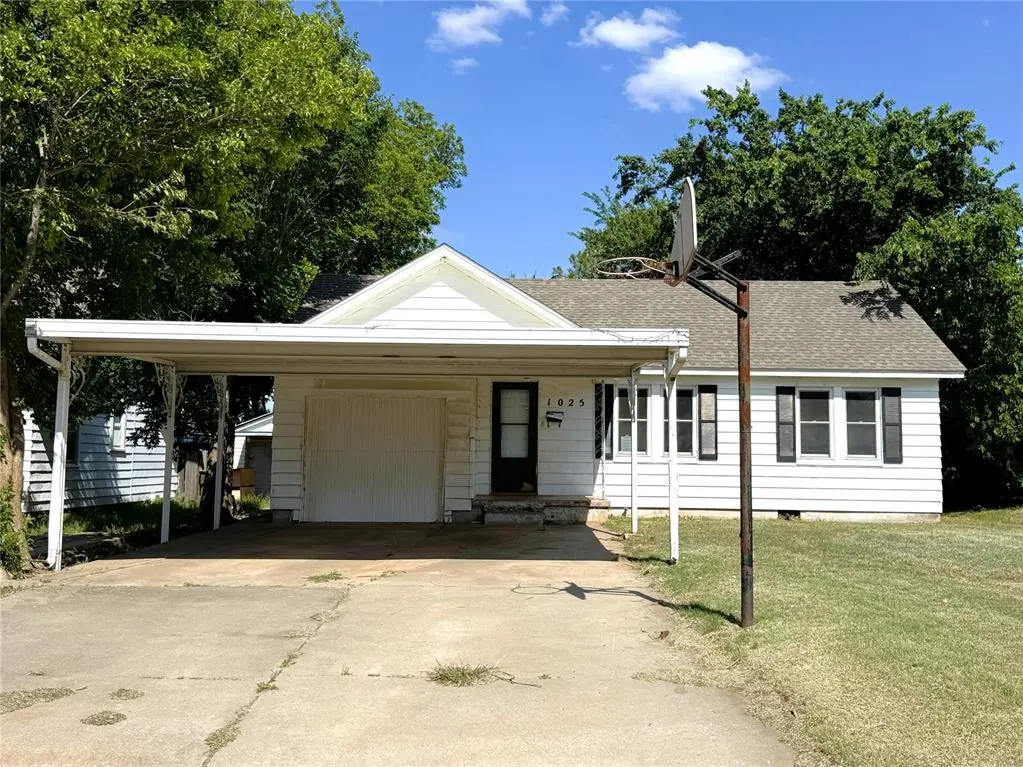
This Chickasha home has one story.
Key facts
- 2nd living area
- Large driveway
- Carport
Tags
Property features AI
Finance
- Other: Vacant and available; Homestead not claimed
- Financial info: REO / bank-owned; Not assumable; Not eligible for loan qualification
- HOA & community: No mandatory association dues
Exterior
- Parking: Concrete parking; 1-car garage
- Utilities: No flood insurance required
- Home design: Single family residence; Split-level plan; Faces west
- Construction: Composition roof; Other construction materials; Conventional foundation; Existing property
- Exterior features: Covered porch; Interior lot
Interior
- Bedrooms: 3 bedrooms
- Bathrooms: 1 full bathroom; 1 half bathroom
- Interior features: In-law plan; Two living areas; Dining area
Neighborhood map
What this means for you Summary
Snapshot
- This is a 3-bed/2.0-bath single-family listed at $52k.
Deal economics
- At list price, monthly cash flow is $683 ($8k/yr) — positive.
- The deal already cash-flows at list — no discount required.
- Meets the 1% rule at list price ($1k rent vs $52k).
- Cap rate 22.1% vs local median 4.8% in Chickasha — top-decile yield for the area; either an underpriced asset or a hidden risk that comps aren't pricing in. Stress-test before assuming the spread holds.
Location & tenants
- Location reads 66/100 on livability (#117 in OK) — a middle-class / working-renter tenant base. Strengths: cost of living A+, housing A+; Watch: amenities F, commute F, health & safety F.
- Chickasha (town): math 23% / reading 27% proficiency, ranked #115 of 270 in OK (top 43%) — low school quality limits family demand, transient renter base, plan for 1-2y turnover; 64% free/reduced lunch — lower-income household profile, screen leases tightly.
- Zoned schools: Bill Wallace Ec Ctr (460 students, 0% FRL); Chickasha Hs (math 12% / reading 27%, grade F, #296 of 447 statewide, top 67%, 749 students, 0% FRL) — zoned schools average 0% FRL vs 64% district-wide (64 pts lower); this property's tenant base skews higher-income than the district average.
- Market conditions: 203 active listings in the ZIP; 10 comparable units currently listed for rent nearby; rentals leasing fast (median 2d on market — plan ~1-2 weeks tenant-placement turnaround); 224 units permitted in Grady County in 2024 (0 in 5+ unit buildings).
Forward outlook
- Local home prices are declining (-3.0%/yr); year-one equity from $360 of loan paydown is wiped out by about $2k of value loss. Plan a longer hold.
- Grady County population projected at +20% by 2050 — long-run rental-demand tailwind backs the buy-and-hold thesis.
- At projected returns (-3.0% appreciation + 3.0% rent growth), your $15k cash investment doubles in ~3 years — after that, you're playing with house money.
Negotiation context
- Only 11 days on market — expect competitive offers; lowballing is unlikely to land.
- 2 sale attempts since 4y ago with the ask held roughly flat each time — persistent listings suggest the price (not the market) is what's stuck; bring a comps-based counter.
Risks & watch-outs
- Watch-outs: property tax is 2.6% of price; built in 1950 — expect roof / HVAC / electrical / plumbing capex.
- Climate carrying-cost: extreme-heat days projected 7→19/yr by 2055 (HVAC capex compounding) — expect insurance premiums to compound above CPI over the hold.
Questions for the listing agent
- Built in 1950 — when were the roof, HVAC, electrical panel, plumbing, and water heater last replaced?
- Property tax is high relative to price — has the assessment been appealed recently, and will the sale trigger a re-assessment?
- Is there a deadline driving the sale (1031 exchange, divorce, estate, relocation)? That informs how much negotiation room exists.
- Schools are D-rated, which usually means shorter tenancies and higher turnover. Who's the typical renter profile here, and what's been the actual vacancy rate?
- What's the average days-on-market for RENTAL listings here right now (not sales)? A rising rental-DOM trend means longer vacancies and softer asking-rent achievability than the comps imply.
- What's the recent tenant-quality profile in this submarket — average credit score on applications, eviction rate, late-payment / NSF rate, and stable-employment percentage? A property-management company in the area should have these aggregated.
- How much new for-sale + rental construction is in the pipeline within 1–3 miles? Heavy new supply typically softens prices + rents 12–24 months out; constrained supply supports both.
Investment metrics
- 1% rule
- 2.65% ✓
- Cap rate
- 22.05%
- Cash-on-cash
- 56.28%
- DSCR
- 3.50
- GRM
- 3.1
CMA / ARV
- ARV (on-the-fly)
- $160,974
- Comps found
- 12
Show comp detail 12 sales within ~0.75 mi
| Address | Dist | Beds/Ba | Sqft | Sold | Price | $/sf | Match |
|---|---|---|---|---|---|---|---|
| 1119 S 5th St | 0.07mi | 2/1.5 (-1) | 1,596 (-2%) | 4mo | $120,000 | $75 | 83 |
| 808 W Idaho Ave Ave | 0.40mi | 3/2.0 | 1,520 (-6%) | 1mo | $177,300 | $117 | 69 |
| 715 S 8th St | 0.33mi | 3/2.0 | 1,512 (-7%) | 10mo | $172,000 | $114 | 64 |
| 316 S 6th St | 0.54mi | 3/2.0 | 1,532 (-6%) | 7mo | $50,000 | $33 | 59 |
| 612 W Iowa Ave | 0.52mi | 4/2.0 (+1) | 1,650 (+2%) | 12mo | $198,000 | $120 | 58 |
| 926 W Tennessee Ave | 0.50mi | 3/2.0 | 1,730 (+6%) | 11mo | $130,000 | $75 | 57 |
| 1414 S 11th St | 0.57mi | 3/2.0 | 1,552 (-5%) | 13mo | $82,000 | $53 | 55 |
| 1522 S 9th St | 0.53mi | 3/2.0 | 1,452 (-11%) | 9mo | $115,000 | $79 | 50 |
| 628 S 12th St | 0.63mi | 3/2.0 | 1,470 (-10%) | 6mo | $172,000 | $117 | 50 |
| 1717 S 6th St | 0.52mi | 3/1.0 | 1,457 (-10%) | 11mo | $179,900 | $123 | 46 |
| 818 W Minnesota Ave | 0.53mi | 3/2.0 | 1,857 (+14%) | 11mo | $183,500 | $99 | 42 |
| 1008 W Colorado St | 0.74mi | 2/1.0 (-1) | 1,403 (-14%) | 7mo | $47,500 | $34 | 28 |
Match score weights: distance 35% · size 25% · config 20% · recency 20%. Top-matched comps best support the ARV.
Projected returns pro-forma
-3.0% appreciation · 3.0% rent growth · sell at horizon
- IRR
- 54.7%
- Equity multiple
- 3.41×
- Total profit
- $35,114
- Equity at exit
- $7,753
- IRR
- 59.8%
- Equity multiple
- 6.96×
- Total profit
- $86,778
- Equity at exit
- $4,496
Cash invested: $14,560 (down + closing). Projections, not guarantees.
Landlord ↔ Tenant lean methodology
- Overall (STATE)
- 83 Strongly Landlord-Friendly
- State Oklahoma
- 83 Strongly Landlord-Friendly · R+20
- County
- — inherits STATE
- City
- — inherits STATE
ZIP-level market 73018
- Home prices YoY
- -21.1%
- Active inventory
- 203
- Price-to-rent
- 3.1×
Monthly cashflow live
- Estimated rent
- $1,377 high interval (Pro) →
- Mortgage (P&I)
- −$273
- Tax from tax record
- −$111 /mo · $1,327/yr
- Insurance
- −$22
- HOA
- −$0
- Vacancy / Maint / Mgmt
- −$289
- Net cashflow
- $683
Break-even live
UW: 25.0% down · 7.5% · 30yr · 1.5% tax · 5.0% vac · 8.0% maint · 8.0% mgmt
Financing live
Cash to close
- Down payment
- $13,000
- Closing costs
- $1,560
- Reserves months
- —
- Total cash needed
- —
Loan-product check · same deal, 3 products live
Conventional
25% down · 7.5% · 30yr
- Down + closing
- —
- Monthly P&I
- —
- Monthly cashflow
- —
- DSCR
- —
- Eligible?
- —
Personal DTI + credit; lowest rate.
DSCR
20% down · 8.5% · 30yr
- Down + closing
- —
- Monthly P&I
- —
- Monthly cashflow
- —
- DSCR
- —
- Eligible?
- —
No personal income docs; deal must DSCR.
Hard money
10% down · 12.0% · 12mo
- Down + closing
- —
- Monthly P&I
- —
- Monthly cashflow
- —
- DSCR
- —
- Eligible?
- —
Short-term bridge; refi at stabilization.
Rent comps 10 comps
| Address | Beds | Baths | Sqft | Rent | $/sqft | DOM | Units | Dist |
|---|---|---|---|---|---|---|---|---|
| 519 W Minnesota Ave Chickasha, OK | 2.0 | 2.0 | 1100 | $1,250 | $1.14 | 1d | 1 | 0.42mi |
| 607 W Wisconsin Ave Chickasha, OK | 3.0 | 2.0 | 1270 | $1,395 | $1.10 | 10d | 1 | 0.62mi |
| 1024 S 13th St Chickasha, OK | 2.0 | 2.0 | 1265 | $925 | $0.73 | 10d | 1 | 0.66mi |
| 1008 S 14th St Chickasha, OK | 3.0 | 2.0 | 1485 | $1,395 | $0.94 | 1d | 1 | 0.74mi |
| 641 Marlin Ct Chickasha, OK | 2.0–3.0 | 2.0 | 1300 | $1,595 | $1.23 | 1d | 3 | 0.90mi |
| 810 W Illinois Ave Chickasha, OK | 2.0 | 2.0 | 1100 | $1,250 | $1.14 | 3d | 1 | 1.07mi |
| 810 W Illinois Ave Chickasha, OK | 2.0 | 2.0 | 1100 | $1,250 | $1.14 | 23d | 1 | 1.07mi |
| 3507 W Mississippi Ave Chickasha, OK | 4.0 | 2.0 | 1240 | $1,474 | $1.19 | 1d | 1 | 1.23mi |
| 2730 Valley View Cir Chickasha, OK | 2.0–3.0 | 2.0 | 1087 | $1,495 | $1.37 | 1d | 3 | 1.42mi |
| 2716 Valley View Dr Chickasha, OK | 3.0 | 2.0 | 1242 | $1,350 | $1.09 | 1d | 1 | 1.43mi |
Listing history 7 events
-
2026-05-18status Pending
-
2026-05-07$52,000 Active
-
2022-05-13soldstatus $120,000
-
2022-04-25soldstatus $120,000 Sold 34-char remark
Show marketing remark (34 chars)
This Chickasha home has one story.
-
2022-03-08status Pending 34-char remark
Show marketing remark (34 chars)
This Chickasha home has one story.
-
2022-02-18$120,000 Active 34-char remark
Show marketing remark (34 chars)
This Chickasha home has one story.
-
2021-10-14soldstatus $96,500
ⓘ Source: listings_history table (triggers on properties + properties_extension) + one-shot
backfill from property_details.listing_events for pre-trigger history.
Tax reassessment forecast OK · Resets to sale price
- Current annual tax
- $1,327 · $111/mo
- Projected year-2 tax
- $1,327 · $111/mo
- Expected delta
- $0/yr ($0/mo · 0.0%)
ⓘ Screening estimate from a state-policy table — verify with the county assessor before closing.
Climate risk First Street
- Flood 1/10 Low FEMA zone X (unshaded) · 0% chance over 30 yrs
- Wildfire 3/10 Moderate
- Heat 6/10 Major 7 d/yr ≥109°F today · 19 d/yr by 30 yrs out
- Wind 2/10 Low 3% chance of damaging wind over 30 yrs
- Air quality 2/10 Low 1 unhealthy d/yr today · 2 by 30 yrs out
Nearby sold comps map
Loading sold comps map…
Walkable amenities ~0.75 mi
Loading nearby amenities…
Taxation est. · year 1
- Rental income
- $16,524
- − Mortgage interest
- −$2,913
- − Property taxes
- −$1,327
- − Insurance
- −$260
- − Repairs & maintenance
- −$1,322
- − Management
- −$1,322
- − Depreciation
- −$1,513
- Taxable income
- $7,867
- Est. tax owed @ 24.0%
- −$1,888
- After-tax cash flow
- $6,306/yr
For passive investors: Depreciation is non-cash, so a rental often shows a tax loss while cash-flowing — sheltering income. Rental losses are passive: they offset passive income freely, and up to $25,000/yr can offset ordinary (W-2) income if you actively participate and your MAGI is under $100k (phasing out to $0 by $150k); unused losses carry forward. On sale, claimed depreciation is recaptured at up to 25%, and gains may owe capital-gains tax (a 1031 exchange can defer both). Figures are a year-1 estimate at your 24.0% rate — not tax advice; consult a CPA.
Schools (NCES district)
- District
- Chickasha
- NCES district ID
- 4007560
- Math proficiency
- 23% ▼ -11.00%
- Reading proficiency
- 27% ▼ -8.00%
- Median HH income
- $38,561
- Composite
- 20.95/100
- National rank
- #8476
- State rank
- #115 of 270 in OK
Livability — Chickasha
- Score
- 66/100
- State rank
- #117
- US rank
- #11902
Category grades
Schools grade is shown separately in the Schools card above.
Census & demographics
- Census place
- Chickasha, OK
- County
- Grady County · 20,505 people
- City population
- 20,505
- Metro
- Oklahoma City, OK
- Population (ZIP)
- 20,505
- Household income
- $56,484
- Rent vs Own
- Severe rent burden
- 685.0
Population outlook (Grady County) Hauer SSP2
- Today (2025)
- 59,962 people
- By 2030
- 62,513 · +4.3%
- By 2040
- 67,338 · +12.3%
- By 2050
- 71,719 · +19.6%
- By 2075
- 82,684 · +37.9%
- By 2100
- 89,387 · +49.1%
Race, ethnicity, and origin ACS 2023
- Neighborhood character
- Predominantly White (74%)
- Race & ethnicity
- White 74% Two or more races 11% Hispanic / Latino 9% Black 5% Native American 5%
- Hispanic origin (detail)
- Mexican 6%
- Common ancestry
- Slovak 2% Iranian 2% Italian 2%
- Foreign-born
- 2% · Canada
- Languages at home
- 96% English-only · Spanish 3%
Political lean MEDSL · Grady
- 2024 margin
- Solid R (+62.7) · D 17.9% · R 80.6% · Other 1.5%
- 2008→2024 swing
- -16.0pp toward R · 2008: -46.7pp · 2024: -62.7pp
- All cycles
- 2024: R+62.7 2020: R+62.3 2016: R+60.3 2012: R+51.2 2008: R+46.7
Not yet ingested
- Civics
- —
Market trends
- HPI YoY
- ▼ -66.82%
- Current HPI
- 249.6051
- Rent YoY
- —
- Metro
- Oklahoma City, OK
- State GDP YoY
- ▲ 1.55%
- F500 in state
- 6
Industry mix (Fortune 500 HQ in OK)
| Industry | F500 HQs | Revenue |
|---|---|---|
| Energy | 3 | $48B |
|
||
Price history
-46.1% since first listed7 events — show timeline
- 2026-05-18 Pending — MLSOK
- 2026-05-07 Listed $52,000 MLSOK
- 2022-05-13 Sold (Public Records) $120,000 Public Records
- 2022-04-25 Sold (MLS) $120,000 MLSOK
- 2022-03-08 Pending — MLSOK
- 2022-02-18 Listed $120,000 MLSOK
- 2021-10-14 Sold (Public Records) $96,500 Public Records
Property tax history
+17.2%/yrLatest (2025): $1,327 · +3.9% YoY. Source: county tax records.
Cash-flow waterfall
monthlySold comps — $/sqft
last 12 mo · ≤1 miLoading sold comps…