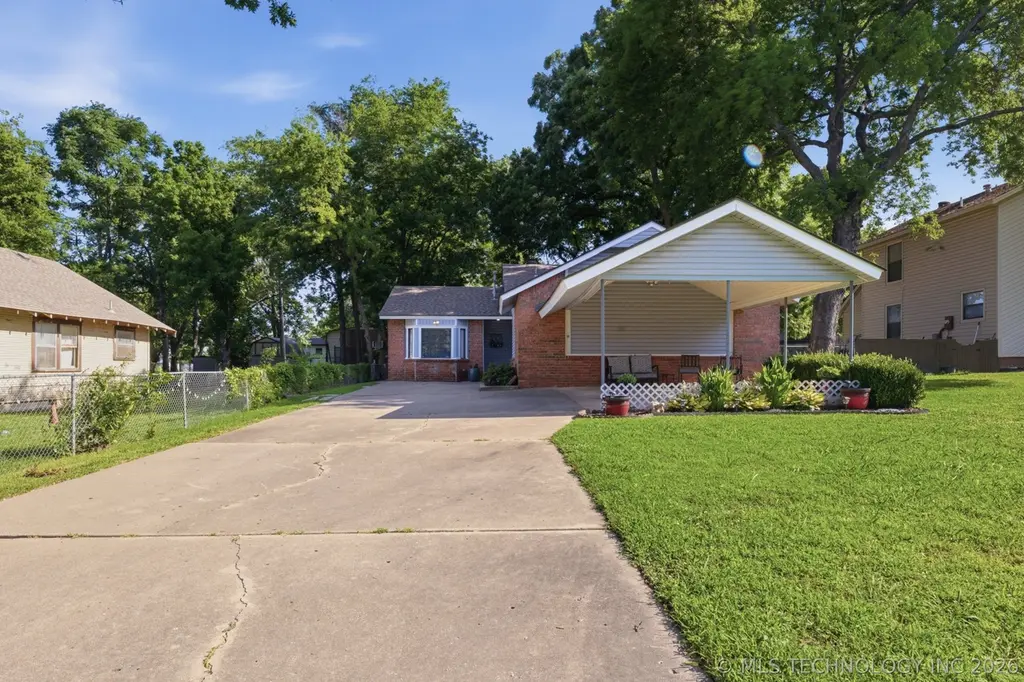
41 E 148th St S · Glenpool, OK
Flood risk 1/10 · Minimal
- FEMA flood zone
- X (unshaded)
- Chance of flooding over 30 yrs
- 0.0%
- Est. flood insurance / yr
- $473 – $860
Fire risk 7/10 · Major
- Est. fire insurance / yr
- $2,463 – $4,575
Heat risk 6/10 · Moderate
- Hot days now (above 110°F)
- 7 days/yr
- Hot days in 30 yrs
- 18 days/yr
Wind risk 3/10 · Minor
- Chance of severe wind over 30 yrs
- 4.0%
Air-quality risk 2/10 · Minimal
- Unhealthy air days now
- 1 days/yr
- Unhealthy air days in 30 yrs
- 1 days/yr
Risk factors via First Street. Map © Google.
Why this score? — see what drove the D+ grade
The composite is a weighted blend of 9 inputs, each scored 0–100. Each bar is that input's sub-score; the figure is the points it added to the 100-point composite (weight × sub-score).
- Cash flow +15.0/30.0
- ARV discount +15.0/15.0
- DSCR +4.6/10.0
- 1% rule +3.5/10.0
- Livability +3.5/5.0
- Rent growth +2.5/5.0
- Condition / age +2.5/5.0
- Schools +2.4/10.0
- Appreciation +0.0/10.0
$219,000
🖨 Deal sheet (PDF) 📄 Offer letter ✓ Due diligence
Listing remarks
Welcome home!! This meticulously maintained 3-bedroom, 1.5-bath home is filled with warmth, charm, and flexible living space. The spacious living room features a cozy fireplace, creating the perfect setting for relaxing evenings. The living room has easy to a standout feature of this home is the converted garage, offering a versatile bonus room that can easily as home office, hobby room, playroom, creative studio, additional living, dining space or 4th bedroom. The possibilities are endless, allowing you to customize the home to fit your lifestyle. Sep outside to enjoy the fenced backyard, perfect for outdoor activities, pets, gardening, or simply relaxing in your own private space. A conve
Key facts
- Converted garage
- Carport
- Fenced backyard
Tags
Property features AI
Finance
- Financial info: Pets allowed
Exterior
- Parking: Concrete driveway
- Security: Smoke detectors; No safety shelter
- Utilities: Cable available; Electricity available; Natural gas available; High-speed internet available; Public water; Public sewer
- Home design: Single-story home; Faces south; Slab foundation
- Construction: Built using brick veneer, vinyl siding, and wood frame; Asphalt/fiberglass roof
- Exterior features: Concrete driveway; Porch; Shed(s); Chain link fencing; Mature trees on the lot
Interior
- Kitchen: Kitchen with breakfast nook; Dishwasher; Disposal; Microwave; Oven; Range; Refrigerator; Gas range connection
- Bedrooms: Master bedroom with walk-in closet (first floor); Two additional bedrooms (first floor)
- Flooring: Carpet; Laminate
- Bathrooms: One full bathroom; One half bathroom; Master bath (first floor); Hall bath with bathtub (first floor)
- Heating & cooling: Central heating (electric and gas); Central air; Gas water heater
- Interior features: Bay windows and insulated windows; Insulated doors; Laminate counters; Pullman bath; Ceiling fans; Gas range and gas oven connections; Programmable thermostat
- Laundry & utility: Washer hookup; Electric dryer hookup; Gas dryer hookup; Utility room (inside, first floor)
Neighborhood map
What this means for you Summary
Snapshot
- This is a 3-bed/1.5-bath single-family listed at $219k.
Deal economics
- At list price, monthly cash flow is $67 ($801/yr) — positive.
- The deal already cash-flows at list — no discount required.
- To meet the 1% rule (rent ≥ 1% of price), the offer needs to be $187k (14.6% below list).
- Recommended offer: $187k (14.6% below list) — sets the bar for 1% rule.
- Cap rate 6.7% vs local median 3.9% in Glenpool — top-decile yield for the area; either an underpriced asset or a hidden risk that comps aren't pricing in. Stress-test before assuming the spread holds.
Location & tenants
- Location reads 70/100 on livability (#39 in OK) — a middle-class / working-renter tenant base. Strengths: cost of living A+, housing A+, crime A; Watch: amenities F, commute F, health & safety F.
- Glenpool (suburban): math 25% / reading 27% proficiency, ranked #78 of 270 in OK (top 29%) — low school quality limits family demand, transient renter base, plan for 1-2y turnover.
- Zoned schools: Glenpool Es (math 41% / reading 28%, grade F, #168 of 845 statewide, top 24%, 854 students, 0% FRL); Glenpool Ms (math 17% / reading 24%, grade F, #153 of 345 statewide, top 45%, 442 students, 0% FRL); Glenpool Hs (math 19% / reading 36%, grade F, #123 of 447 statewide, top 27%, 776 students, 0% FRL) — zoned schools average 0% FRL vs 41% district-wide (41 pts lower); this property's tenant base skews higher-income than the district average.
- Market conditions: 163 active listings in the ZIP; 3 comparable units currently listed for rent nearby; rentals leasing fast (median 13d on market — plan ~1-2 weeks tenant-placement turnaround); solid renter incomes; 2,818 units permitted in Tulsa County in 2024 (518 in 5+ unit buildings).
Forward outlook
- Local home prices are declining (-3.0%/yr); year-one equity from $2k of loan paydown is wiped out by about $7k of value loss. Plan a longer hold.
- Tulsa County population projected at +30% by 2050 — long-run rental-demand tailwind backs the buy-and-hold thesis.
Negotiation context
- Only 10 days on market — expect competitive offers; lowballing is unlikely to land.
- 2 sale attempts with the ask held roughly flat each time — persistent listings suggest the price (not the market) is what's stuck; bring a comps-based counter.
- Current owner paid $160k; 37% above their basis — modest negotiation headroom, anchor on the comps not their cost.
Risks & watch-outs
- Climate carrying-cost: major wildfire risk; extreme-heat days projected 7→18/yr by 2055 (HVAC capex compounding) — expect insurance premiums to compound above CPI over the hold.
Questions for the listing agent
- Is there a deadline driving the sale (1031 exchange, divorce, estate, relocation)? That informs how much negotiation room exists.
- Schools are D-rated, which usually means shorter tenancies and higher turnover. Who's the typical renter profile here, and what's been the actual vacancy rate?
- The area grade is low — what's the realistic commute time and amenity access for the typical tenant pool here? Any planned neighborhood developments (good or bad) we should know about?
- What's the average days-on-market for RENTAL listings here right now (not sales)? A rising rental-DOM trend means longer vacancies and softer asking-rent achievability than the comps imply.
- What's the recent tenant-quality profile in this submarket — average credit score on applications, eviction rate, late-payment / NSF rate, and stable-employment percentage? A property-management company in the area should have these aggregated.
- How much new for-sale + rental construction is in the pipeline within 1–3 miles? Heavy new supply typically softens prices + rents 12–24 months out; constrained supply supports both.
Investment metrics
- 1% rule
- 0.85% ✗
- Cap rate
- 6.66%
- Cash-on-cash
- 1.31%
- DSCR
- 1.06
- GRM
- 9.8
CMA / ARV
- ARV (on-the-fly)
- $265,038
- Comps found
- 12
Show comp detail 12 sales within ~0.75 mi
| Address | Dist | Beds/Ba | Sqft | Sold | Price | $/sf | Match |
|---|---|---|---|---|---|---|---|
| 30 W 147th St S | 0.06mi | 3/2.0 | 1,492 (-8%) | 8mo | $295,000 | $198 | 75 |
| 234 E 147th St S | 0.11mi | 3/2.0 | 1,443 (-11%) | 4mo | $250,000 | $173 | 70 |
| 394 E 147th St S | 0.23mi | 3/1.5 | 1,459 (-10%) | 2mo | $230,000 | $158 | 70 |
| 224 E 148th St S | 0.12mi | 3/2.0 | 1,406 (-14%) | 8mo | $248,000 | $176 | 64 |
| 393 E 147th St S | 0.24mi | 3/2.0 | 1,434 (-12%) | 6mo | $234,000 | $163 | 62 |
| 14436 S Dogwood St | 0.33mi | 4/2.0 (+1) | 1,700 (+5%) | 10mo | $205,000 | $121 | 62 |
| 14921 Jordan Ct | 0.57mi | 3/2.0 | 1,710 (+5%) | 3mo | $258,000 | $151 | 60 |
| 14336 S Barber St | 0.35mi | 3/2.0 | 1,429 (-12%) | 4mo | $229,000 | $160 | 58 |
| 14812 S Fern Pl | 0.45mi | 3/2.0 | 1,488 (-8%) | 6mo | $225,000 | $151 | 58 |
| 14603 S Xenophon Ave | 0.35mi | 4/2.5 (+1) | 1,447 (-11%) | 2mo | $230,000 | $159 | 54 |
| 14716 S Justin Ave | 0.70mi | 3/2.0 | 1,832 (+13%) | 2mo | $305,900 | $167 | 43 |
| 14508 S Justin Ave | 0.67mi | 4/2.0 (+1) | 1,850 (+14%) | 2mo | $325,000 | $176 | 37 |
Match score weights: distance 35% · size 25% · config 20% · recency 20%. Top-matched comps best support the ARV.
Projected returns pro-forma
-3.0% appreciation · 3.0% rent growth · sell at horizon
- IRR
- -14.2%
- Equity multiple
- 0.49×
- Total profit
- $-31,269
- Equity at exit
- $32,654
- IRR
- -5.5%
- Equity multiple
- 0.64×
- Total profit
- $-21,895
- Equity at exit
- $18,935
Cash invested: $61,320 (down + closing). Projections, not guarantees.
Landlord ↔ Tenant lean methodology
- Overall (STATE)
- 83 Strongly Landlord-Friendly
- State Oklahoma
- 83 Strongly Landlord-Friendly · R+20
- County
- — inherits STATE
- City
- — inherits STATE
ZIP-level market 74033
- Home prices YoY
- -18.8%
- Active inventory
- 163
- Price-to-rent
- 9.8×
Monthly cashflow live
- Estimated rent
- $1,870 medium interval (Pro) →
- Mortgage (P&I)
- −$1,148
- Tax from tax record
- −$171 /mo · $2,049/yr
- Insurance
- −$91
- HOA
- −$0
- Vacancy / Maint / Mgmt
- −$393
- Net cashflow
- $67
Break-even live
Sensitivity live
| Price | -10% $191 | -5% $129 | +0% $67 | +5% $5 | +10% $-57 |
|---|---|---|---|---|---|
| Rent | -10% $-81 | -5% $-7 | +0% $67 | +5% $141 | +10% $215 |
| Rate | -1.0pp $177 | -0.5pp $122 | base $67 | +0.5pp $10 | +1.0pp $-48 |
UW: 25.0% down · 7.5% · 30yr · 1.5% tax · 5.0% vac · 8.0% maint · 8.0% mgmt
Financing live
Cash to close
- Down payment
- $54,750
- Closing costs
- $6,570
- Reserves months
- —
- Total cash needed
- —
Loan-product check · same deal, 3 products live
Conventional
25% down · 7.5% · 30yr
- Down + closing
- —
- Monthly P&I
- —
- Monthly cashflow
- —
- DSCR
- —
- Eligible?
- —
Personal DTI + credit; lowest rate.
DSCR
20% down · 8.5% · 30yr
- Down + closing
- —
- Monthly P&I
- —
- Monthly cashflow
- —
- DSCR
- —
- Eligible?
- —
No personal income docs; deal must DSCR.
Hard money
10% down · 12.0% · 12mo
- Down + closing
- —
- Monthly P&I
- —
- Monthly cashflow
- —
- DSCR
- —
- Eligible?
- —
Short-term bridge; refi at stabilization.
Rent comps 3 comps
| Address | Beds | Baths | Sqft | Rent | $/sqft | DOM | Units | Dist |
|---|---|---|---|---|---|---|---|---|
| 13743 S Fern St Glenpool, OK | 3.0 | 1.5 | 1139 | $1,450 | $1.27 | 12d | 1 | 0.89mi |
| 1110 E 137th Pl Glenpool, OK | 4.0 | 2.0 | 2169 | $2,095 | $0.97 | 25d | 1 | 1.21mi |
| 1110 E 137th Pl Glenpool, OK | 4.0 | 2.0 | 2169 | $2,095 | $0.97 | 3d | 1 | 1.21mi |
Listing history 7 events
-
2026-06-21days on market $219,000 Active 10 DOM
-
2026-06-18days on market $219,000 Active 7 DOM
-
2026-06-17days on market $219,000 Active 6 DOM
-
2026-06-16days on market $219,000 Active 5 DOM
-
2026-06-15days on market $219,000 Active 4 DOM
-
2026-06-13remarks 699-char remark
-
2026-06-13$219,000 Active 2 DOM
ⓘ Source: listings_history table (triggers on properties + properties_extension) + one-shot
backfill from property_details.listing_events for pre-trigger history.
Tax reassessment forecast OK · Resets to sale price
- Current annual tax
- $2,049 · $171/mo
- Projected year-2 tax
- $2,049 · $171/mo
- Expected delta
- $0/yr ($0/mo · 0.0%)
ⓘ Screening estimate from a state-policy table — verify with the county assessor before closing.
Climate risk First Street
- Flood 1/10 Low FEMA zone X (unshaded) · 0% chance over 30 yrs
- Wildfire 7/10 Severe
- Heat 6/10 Major 7 d/yr ≥110°F today · 18 d/yr by 30 yrs out
- Wind 3/10 Moderate 4% chance of damaging wind over 30 yrs
- Air quality 2/10 Low 1 unhealthy d/yr today · 1 by 30 yrs out
Nearby sold comps map
Loading sold comps map…
Walkable amenities ~0.75 mi
Loading nearby amenities…
Taxation est. · year 1
- Rental income
- $22,439
- − Mortgage interest
- −$12,267
- − Property taxes
- −$2,049
- − Insurance
- −$1,095
- − Repairs & maintenance
- −$1,795
- − Management
- −$1,795
- − Depreciation
- −$6,371
- Taxable loss
- −$2,934
- Est. tax savings @ 24.0%
- +$704
- After-tax cash flow
- $1,505/yr
For passive investors: Depreciation is non-cash, so a rental often shows a tax loss while cash-flowing — sheltering income. Rental losses are passive: they offset passive income freely, and up to $25,000/yr can offset ordinary (W-2) income if you actively participate and your MAGI is under $100k (phasing out to $0 by $150k); unused losses carry forward. On sale, claimed depreciation is recaptured at up to 25%, and gains may owe capital-gains tax (a 1031 exchange can defer both). Figures are a year-1 estimate at your 24.0% rate — not tax advice; consult a CPA.
Schools (NCES district)
- District
- Glenpool
- NCES district ID
- 4012720
- Math proficiency
- 25% ▼ -10.00%
- Reading proficiency
- 27% ▼ -6.00%
- Median HH income
- $60,823
- Composite
- 23.92/100
- National rank
- #7789
- State rank
- #78 of 270 in OK
Livability — Glenpool
- Score
- 70/100
- State rank
- #39
- US rank
- #7699
Category grades
Schools grade is shown separately in the Schools card above.
Census & demographics
- Census place
- Glenpool, OK
- County
- Tulsa County · 640,811 people
- City population
- 13,745
- Metro
- Tulsa, OK
- Population (ZIP)
- 13,745
- Household income
- $80,542
- Rent vs Own
- Severe rent burden
- 288.0
Population outlook (Tulsa County) Hauer SSP2
- Today (2025)
- 723,846 people
- By 2030
- 766,033 · +5.8%
- By 2040
- 851,386 · +17.6%
- By 2050
- 938,389 · +29.6%
- By 2075
- 1,166,011 · +61.1%
- By 2100
- 1,350,277 · +86.5%
Race, ethnicity, and origin ACS 2023
- Neighborhood character
- Diverse neighborhood (Simpson 0.61)
- Race & ethnicity
- White 61% Two or more races 17% Hispanic / Latino 11% Native American 7% Asian 4% Black 4%
- Hispanic origin (detail)
- Mexican 8%
- Common ancestry
- Lithuanian 3% Slovak 2% Romanian 2%
- Foreign-born
- 7% · Canada, Philippines, South Korea
- Languages at home
- 89% English-only · Spanish 6% Other Asian/Pacific 2% Tagalog/Filipino 1%
Political lean MEDSL · Tulsa
- 2024 margin
- R (+15.2) · D 41.3% · R 56.5% · Other 2.2%
- 2008→2024 swing
- +9.2pp toward D · 2008: -24.5pp · 2024: -15.2pp
- All cycles
- 2024: R+15.2 2020: R+15.6 2016: R+22.9 2012: R+27.4 2008: R+24.5
Not yet ingested
- Civics
- —
Market trends
- HPI YoY
- ▼ -51.90%
- Current HPI
- 223.9379
- Rent YoY
- —
- Metro
- Tulsa, OK
- State GDP YoY
- ▲ 1.55%
- F500 in state
- 6
Industry mix (Fortune 500 HQ in OK)
| Industry | F500 HQs | Revenue |
|---|---|---|
| Energy | 3 | $48B |
|
||
Price history
+454.4% since first listed10 events — show timeline
- 2026-06-11 Listed $219,000 MLS Technology, Inc.
- 2026-05-19 Listing Removed — MLS Technology, Inc.
- 2026-05-12 Price Changed $224,000 MLS Technology, Inc.
- 2026-03-27 Price Changed $229,500 MLS Technology, Inc.
- 2026-01-30 Price Changed $232,500 MLS Technology, Inc.
- 2026-01-19 Price Changed $234,000 MLS Technology, Inc.
- 2025-11-20 Listed $236,000 MLS Technology, Inc.
- 2023-02-28 Sold (Public Records) $160,000 Public Records
- 2010-06-28 Sold (Public Records) $70,000 Public Records
- 1991-04-12 Sold (Public Records) $39,500 Public Records
Property tax history
+6.1%/yrLatest (2025): $2,049 · -0.1% YoY. Source: county tax records.
Cash-flow waterfall
monthlySold comps — $/sqft
last 12 mo · ≤1 miLoading sold comps…