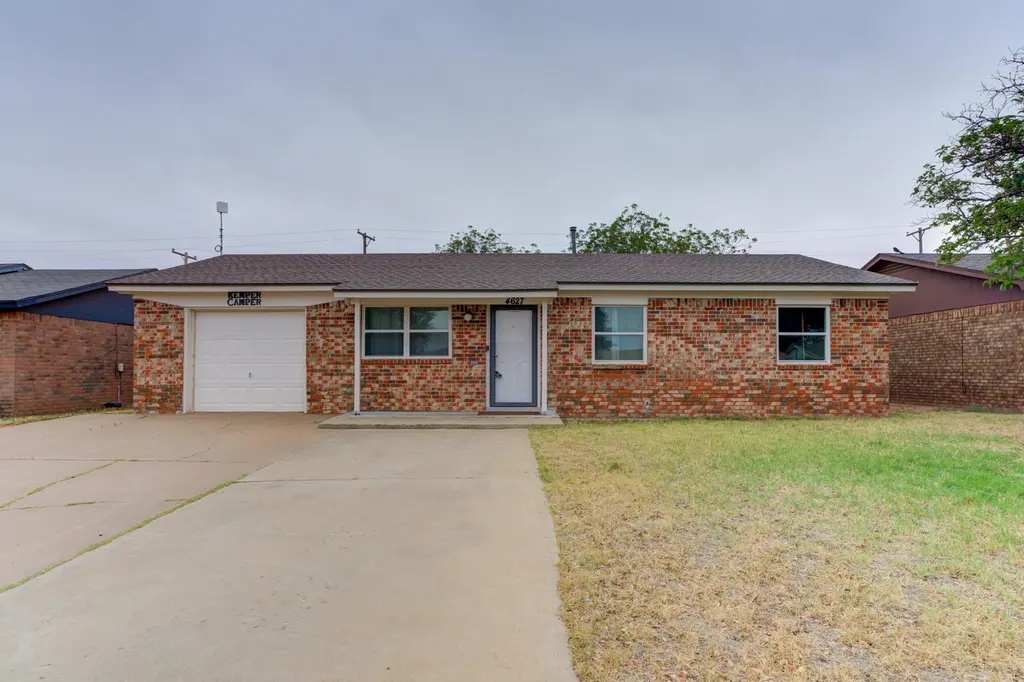
4627 Kemper St · Lubbock, TX
Flood risk 1/10 · Minimal
- FEMA flood zone
- X (shaded)
- Chance of flooding over 30 yrs
- 0.0%
- Est. flood insurance / yr
- $507 – $1,088
Fire risk 3/10 · Minor
- Est. fire insurance / yr
- $1,222 – $2,270
Heat risk 5/10 · Moderate
- Hot days now (above 99°F)
- 7 days/yr
- Hot days in 30 yrs
- 19 days/yr
Wind risk 2/10 · Minimal
- Chance of severe wind over 30 yrs
- —
Air-quality risk 2/10 · Minimal
- Unhealthy air days now
- 1 days/yr
- Unhealthy air days in 30 yrs
- 1 days/yr
Risk factors via First Street. Map © Google.
Why this score? — see what drove the D grade
The composite is a weighted blend of 9 inputs, each scored 0–100. Each bar is that input's sub-score; the figure is the points it added to the 100-point composite (weight × sub-score).
- Cash flow +12.9/30.0
- ARV discount +7.5/15.0
- Livability +4.0/5.0
- DSCR +3.8/10.0
- 1% rule +3.6/10.0
- Rent growth +3.1/5.0
- Schools +3.1/10.0
- Condition / age +2.5/5.0
- Appreciation +0.0/10.0
$165,000
🖨 Deal sheet (PDF) 📄 Offer letter ✓ Due diligence
Listing remarks MLS
Move in ready. Great location for easy access to Tech or the medical district, and right down the street from Centennial Elementary. Clean and freshly painted. All the expensive items have been updated including A/C unit, electrical panel, new dishwasher, windows, and solid surface flooring throughout. * Priced to sell quickly at $14,000 below tax appraisal. Get your offer in on this one before someone beats you to it.
Key facts
- Oversized backyard
- Bright sunroom
- 6,810 sq ft lot
Tags
Property features AI
Finance
- HOA & community: Sidewalks in the community
Exterior
- Parking: Attached garage (1 car)
- Utilities: Public water; Public sewer; Electricity connected; Natural gas connected / available; Cable available; Underground utilities; Water connected; Sewer connected
- Home design: Single-family residence; Residential property
- Construction: Brick veneer exterior; Composition roof; Slab foundation; Built area approximately 1,091
- Exterior features: Covered, enclosed rear porch; Fenced backyard with wood fencing; Front yard; Paved city street frontage; Publicly maintained road
Interior
- Kitchen: Dishwasher; Free-standing electric range; Microwave; Oven; Refrigerator
- Flooring: Tile; Vinyl
- Bathrooms: 2 full bathrooms
- Heating & cooling: Central heating (natural gas); Central electric air conditioning
- Interior features: Eat-in kitchen; Insulated windows
- Laundry & utility: Laundry room; Washer and dryer; Gas water heater
Neighborhood map
What this means for you Summary
Snapshot
- This is a 3-bed/2.0-bath single-family listed at $165k.
Deal economics
- At list price, monthly cash flow is $-13 ($-158/yr) — negative.
- To cash-flow at today's rent, offer at most $163k (1.4% below list).
- To meet the 1% rule (rent ≥ 1% of price), the offer needs to be $143k (13.6% below list).
- Recommended offer: $143k (13.6% below list) — sets the bar for 1% rule.
Location & tenants
- Location reads 80/100 on livability (#37 in TX, #1,749 nationally) — a professional / high-income tenant draw. Strengths: commute A+, cost of living A+, housing A+; Watch: employment C-, crime F.
- Lubbock ISD (urban): math 36% / reading 39% proficiency, ranked #481 of 826 in TX (top 58%) — families likely to look elsewhere, expect single-tenant / working-renter base with shorter leases; 60% free/reduced lunch — lower-income household profile, screen leases tightly.
- Zoned schools: Centennial El (math 38% / reading 36%, grade F, #1,769 of 4,322 statewide, top 44%, 618 students, 84% FRL); Mackenzie Middle (math 19% / reading 27%, grade F, #1,327 of 1,662 statewide, top 81%, 515 students, 88% FRL); Coronado H S (math 34% / reading 38%, grade F, #930 of 1,632 statewide, top 57%, 1,960 students, 66% FRL) — zoned schools average 79% FRL vs 60% district-wide (19 pts higher); higher-poverty schools than district average — tighter screening recommended.
- Market conditions: Rents rising (+2.2%/yr); 464 active listings in the ZIP; 40 comparable units currently listed for rent nearby; rentals lingering (median 45d on market — plan ~5-8 weeks vacancy on turnover, expect pricing pressure); 55% of comp listings sitting > 30 days — soft ceiling on asking rent; 2,219 units permitted in Lubbock County in 2024 (252 in 5+ unit buildings).
Forward outlook
- Local home prices are declining (-3.0%/yr); year-one equity from $1k of loan paydown is wiped out by about $5k of value loss. Plan a longer hold.
- Lubbock County population projected at +39% by 2050 — long-run rental-demand tailwind backs the buy-and-hold thesis.
Negotiation context
- Only 3 days on market — expect competitive offers; lowballing is unlikely to land.
- 2 sale attempts with the ask held roughly flat each time — persistent listings suggest the price (not the market) is what's stuck; bring a comps-based counter.
- Current owner paid $75k; list at $165k implies a 120% gain — meaningful room to come down on a strong offer.
Risks & watch-outs
- Climate carrying-cost: extreme-heat days projected 7→19/yr by 2055 (HVAC capex compounding) — expect insurance premiums to compound above CPI over the hold.
Questions for the listing agent
- What do current leases actually rent for vs. the listed asking? Can we see a recent rent roll and the last 12 months of T-12 income?
- Built in 1977 — when were the roof, HVAC, electrical panel, plumbing, and water heater last replaced?
- Is there a deadline driving the sale (1031 exchange, divorce, estate, relocation)? That informs how much negotiation room exists.
- Schools are D-rated, which usually means shorter tenancies and higher turnover. Who's the typical renter profile here, and what's been the actual vacancy rate?
- Crime grade is F in this area — have there been break-ins, vandalism, or insurance claims at this property in the last 3 years? What carrier currently insures it and at what premium?
- The area grade is low — what's the realistic commute time and amenity access for the typical tenant pool here? Any planned neighborhood developments (good or bad) we should know about?
- What's the average days-on-market for RENTAL listings here right now (not sales)? A rising rental-DOM trend means longer vacancies and softer asking-rent achievability than the comps imply.
- What's the recent tenant-quality profile in this submarket — average credit score on applications, eviction rate, late-payment / NSF rate, and stable-employment percentage? A property-management company in the area should have these aggregated.
- How much new for-sale + rental construction is in the pipeline within 1–3 miles? Heavy new supply typically softens prices + rents 12–24 months out; constrained supply supports both.
Investment metrics
- 1% rule
- 0.86% ✗
- Cap rate
- 6.20%
- Cash-on-cash
- -0.34%
- DSCR
- 0.98
- GRM
- 9.6
CMA / ARV
No comps found within radius.
Projected returns pro-forma
-3.0% appreciation · 2.21% rent growth · sell at horizon
- IRR
- -17.7%
- Equity multiple
- 0.38×
- Total profit
- $-28,679
- Equity at exit
- $24,602
- IRR
- -11.4%
- Equity multiple
- 0.34×
- Total profit
- $-30,510
- Equity at exit
- $14,266
Cash invested: $46,200 (down + closing). Projections, not guarantees.
Landlord ↔ Tenant lean methodology
- Overall (STATE)
- 87 Strongly Landlord-Friendly
- State Texas
- 87 Strongly Landlord-Friendly · R+5
- County
- — inherits STATE
- City
- — inherits STATE
ZIP-level market 79416
- Home prices YoY
- -20.0%
- Rents YoY
- 2.2%
- Active inventory
- 464
- Price-to-rent
- 9.6×
Monthly cashflow live
- Estimated rent
- $1,426 high interval (Pro) →
- Mortgage (P&I)
- −$865
- Tax from tax record
- −$206 /mo · $2,471/yr
- Insurance
- −$69
- HOA
- −$0
- Vacancy / Maint / Mgmt
- −$300
- Net cashflow
- $-13
Break-even live
Sensitivity live
| Price | -10% $80 | -5% $34 | +0% $-13 | +5% $-60 | +10% $-107 |
|---|---|---|---|---|---|
| Rent | -10% $-126 | -5% $-70 | +0% $-13 | +5% $43 | +10% $100 |
| Rate | -1.0pp $70 | -0.5pp $29 | base $-13 | +0.5pp $-56 | +1.0pp $-99 |
UW: 25.0% down · 7.5% · 30yr · 1.5% tax · 5.0% vac · 8.0% maint · 8.0% mgmt
Financing live
Cash to close
- Down payment
- $41,250
- Closing costs
- $4,950
- Reserves months
- —
- Total cash needed
- —
Loan-product check · same deal, 3 products live
Conventional
25% down · 7.5% · 30yr
- Down + closing
- —
- Monthly P&I
- —
- Monthly cashflow
- —
- DSCR
- —
- Eligible?
- —
Personal DTI + credit; lowest rate.
DSCR
20% down · 8.5% · 30yr
- Down + closing
- —
- Monthly P&I
- —
- Monthly cashflow
- —
- DSCR
- —
- Eligible?
- —
No personal income docs; deal must DSCR.
Hard money
10% down · 12.0% · 12mo
- Down + closing
- —
- Monthly P&I
- —
- Monthly cashflow
- —
- DSCR
- —
- Eligible?
- —
Short-term bridge; refi at stabilization.
Rent comps 40 comps
| Address | Beds | Baths | Sqft | Rent | $/sqft | DOM | Units | Dist |
|---|---|---|---|---|---|---|---|---|
| 4530 Marshall St Lubbock, TX | 4.0 | 2.0 | 1106 | $1,600 | $1.45 | 14d | 1 | 0.14mi |
| 4512 Lehigh St Lubbock, TX | 2.0 | 1.0 | 720 | $800 | $1.11 | 44d | 1 | 0.19mi |
| 4605 Harvard St Lubbock, TX | 3.0 | 2.0 | 1362 | $1,400 | $1.03 | 22d | 1 | 0.23mi |
| 4615 Grinnell St Lubbock, TX | 3.0 | 1.5 | 1446 | $1,474 | $1.02 | 44d | 1 | 0.26mi |
| 4615 Grinnell St Lubbock, TX | 3.0 | 1.5 | 1446 | $1,700 | $1.18 | 14d | 1 | 0.26mi |
| 4412 Kemper St Lubbock, TX | 3.0 | 2.0 | 1157 | $1,250 | $1.08 | 44d | 1 | 0.31mi |
| 4638 Erskine St Lubbock, TX | 2.0 | 2.0 | 949 | $1,100 | $1.16 | 22d | 1 | 0.34mi |
| 212 N Troy Ave Unit B Lubbock, TX | 2.0 | 1.0 | 800 | $775 | $0.97 | 22d | 1 | 0.79mi |
| 201 N Troy Ave Unit A Lubbock, TX | 2.0 | 1.0 | 818 | $875 | $1.07 | 44d | 1 | 0.84mi |
| 201 N Troy Ave Unit A Lubbock, TX | 2.0 | 1.0 | 818 | $875 | $1.07 | 22d | 1 | 0.84mi |
| 139 N Troy Ave Unit B Lubbock, TX | 2.0 | 1.0 | 818 | $725 | $0.89 | 22d | 1 | 0.86mi |
| 128 N Troy Ave Lubbock, TX | 2.0 | 1.0 | 800 | $899 | $1.12 | 14d | 1 | 0.90mi |
| 908 N Belmont Ave Unit A Lubbock, TX | 3.0 | 3.0 | 1366 | $1,175 | $0.86 | 44d | 1 | 0.93mi |
| 906 N Belmont Ave Lubbock, TX | 3.0 | 3.0 | 1366 | $1,225 | $0.90 | 44d | 1 | 0.93mi |
| 602 N Belmont Ave Lubbock, TX | 3.0 | 3.0 | 1370 | $1,325 | $0.97 | 14d | 3 | 0.99mi |
| 3701 Clovis Rd Lubbock, TX | 1.0–2.0 | 1.0–2.0 | 833 | $1,400 | $1.68 | 14d | 19 | 1.06mi |
| 5420 Kemper St Lubbock, TX | 3.0 | 3.0 | 1381 | $1,175 | $0.85 | 44d | 1 | 1.07mi |
| 5504 Itasca St Unit B Lubbock, TX | 3.0 | 3.0 | 1445 | $1,500 | $1.04 | 44d | 1 | 1.12mi |
| 5501 Jarvis St Unit A Lubbock, TX | 3.0 | 2.0 | 1445 | $1,450 | $1.00 | 22d | 1 | 1.12mi |
| 1217 N Chicago Ave Unit A Lubbock, TX | 3.0 | 2.0 | 1375 | $1,400 | $1.02 | 44d | 1 | 1.13mi |
| 1415 N Knoxville Ave Lubbock, TX | 3.0–4.0 | 2.0 | 1291 | $934 | $0.72 | 14d | 1 | 1.14mi |
| 1309 N Chicago Ave Lubbock, TX | 3.0 | 2.0 | 1450 | $1,745 | $1.20 | 14d | 1 | 1.14mi |
| 1315 N Chicago Ave Lubbock, TX | 3.0 | 2.0 | 1450 | $1,745 | $1.20 | 22d | 1 | 1.14mi |
| 5506 Itasca St Unit A Lubbock, TX | 3.0 | 3.0 | 1445 | $1,500 | $1.04 | 44d | 1 | 1.15mi |
| 5511 Itasca St Lubbock, TX | 4.0 | 4.0 | 1348 | $2,000 | $1.48 | 14d | 1 | 1.15mi |
| 5513 Itasca St Lubbock, TX | 3.0 | 3.0 | 1368 | $1,500 | $1.10 | 44d | 1 | 1.16mi |
| 522 N Chicago Ave Unit B Lubbock, TX | 3.0 | 3.0 | 1370 | $1,200 | $0.88 | 44d | 1 | 1.16mi |
| 516 N Chicago Ave Unit B Lubbock, TX | 3.0 | 3.0 | 1370 | $1,200 | $0.88 | 44d | 1 | 1.18mi |
| 310 N Brentwood Ave Unit B Lubbock, TX | 3.0 | 3.0 | 1400 | $1,250 | $0.89 | 44d | 1 | 1.18mi |
| 1303 N Clinton Ave Unit A Lubbock, TX | 3.0 | 2.0 | 1375 | $1,495 | $1.09 | 44d | 1 | 1.18mi |
| 5515 Kemper St Unit A Lubbock, TX | 3.0 | 2.0 | 1350 | $1,425 | $1.06 | 44d | 1 | 1.19mi |
| 503 N Brentwood Ave Unit B Lubbock, TX | 3.0 | 3.0 | 1370 | $1,200 | $0.88 | 44d | 1 | 1.19mi |
| 5516 Itasca St Lubbock, TX | 3.0 | 3.0 | 1360 | $1,500 | $1.10 | 44d | 1 | 1.21mi |
| 533 N Clinton Ave Unit B Lubbock, TX | 3.0 | 3.0 | 1340 | $1,300 | $0.97 | 44d | 1 | 1.22mi |
| 505 N Chicago Ave Unit B Lubbock, TX | 3.0 | 3.0 | 1435 | $1,325 | $0.92 | 44d | 1 | 1.24mi |
| 505 N Chicago Ave Lubbock, TX | 3.0 | 3.0 | 1435 | $1,425 | $0.99 | 44d | 1 | 1.24mi |
| 523 N Clinton Ave Unit Clinton Side A Lubbock, TX | 3.0 | 3.0 | 1435 | $1,295 | $0.90 | 22d | 1 | 1.24mi |
| 1303 N Colton Ave Unit B Lubbock, TX | 3.0 | 2.0 | 1445 | $1,275 | $0.88 | 44d | 1 | 1.24mi |
| 5549 Lehigh St Lubbock, TX | 2.0 | 2.0 | 1500 | $1,550 | $1.03 | 22d | 1 | 1.26mi |
| 5524 Itasca St Lubbock, TX | 3.0 | 3.0 | 1360 | $1,500 | $1.10 | 22d | 1 | 1.26mi |
Listing history 14 events
-
2026-06-05statusdays on market $165,000 Pending 3 DOM
-
2026-06-03days on market $165,000 Active 2 DOM
-
2026-06-01days on market $165,000 Active 1 DOM
-
2026-05-31days on market $165,000 Active 9 DOM
-
2026-05-30days on market $165,000 Active 8 DOM
-
2026-05-22$165,000 Active
-
2025-07-17soldstatus
-
2025-07-15soldstatus Closed 422-char remark
Show marketing remark (422 chars)
Move in ready. Great location for easy access to Tech or the medical district, and right down the street from Centennial Elementary. Clean and freshly painted. All the expensive items have been updated including A/C unit, electrical panel, new dishwasher, windows, and solid surface flooring throughout. * Priced to sell quickly at $14,000 below tax appraisal. Get your offer in on this one before someone beats you to it.
-
2025-06-17status Pending 422-char remark
Show marketing remark (422 chars)
Move in ready. Great location for easy access to Tech or the medical district, and right down the street from Centennial Elementary. Clean and freshly painted. All the expensive items have been updated including A/C unit, electrical panel, new dishwasher, windows, and solid surface flooring throughout. * Priced to sell quickly at $14,000 below tax appraisal. Get your offer in on this one before someone beats you to it.
-
2025-06-05$129,000 Active 422-char remark
Show marketing remark (422 chars)
Move in ready. Great location for easy access to Tech or the medical district, and right down the street from Centennial Elementary. Clean and freshly painted. All the expensive items have been updated including A/C unit, electrical panel, new dishwasher, windows, and solid surface flooring throughout. * Priced to sell quickly at $14,000 below tax appraisal. Get your offer in on this one before someone beats you to it.
-
2025-04-15price $129,000
-
2010-05-20soldstatus
-
2010-05-19soldstatus
-
2007-08-24soldstatus $75,000
ⓘ Source: listings_history table (triggers on properties + properties_extension) + one-shot
backfill from property_details.listing_events for pre-trigger history.
Tax reassessment forecast TX · Resets to sale price
- Current annual tax
- $2,471 · $206/mo
- Projected year-2 tax
- $3,020 · $252/mo
- Expected delta
- +$548/yr (+$46/mo · 22.2%)
ⓘ Screening estimate from a state-policy table — verify with the county assessor before closing.
Climate risk First Street
- Flood 1/10 Low FEMA zone X (shaded) · 0% chance over 30 yrs
- Wildfire 3/10 Moderate
- Heat 5/10 Major 7 d/yr ≥99°F today · 19 d/yr by 30 yrs out
- Wind 2/10 Low
- Air quality 2/10 Low 1 unhealthy d/yr today · 1 by 30 yrs out
Nearby sold comps map
Loading sold comps map…
Walkable amenities ~0.75 mi
Loading nearby amenities…
Taxation est. · year 1
- Rental income
- $17,116
- − Mortgage interest
- −$9,243
- − Property taxes
- −$2,471
- − Insurance
- −$825
- − Repairs & maintenance
- −$1,369
- − Management
- −$1,369
- − Depreciation
- −$4,800
- Taxable loss
- −$2,961
- Est. tax savings @ 24.0%
- +$711
- After-tax cash flow
- $553/yr
For passive investors: Depreciation is non-cash, so a rental often shows a tax loss while cash-flowing — sheltering income. Rental losses are passive: they offset passive income freely, and up to $25,000/yr can offset ordinary (W-2) income if you actively participate and your MAGI is under $100k (phasing out to $0 by $150k); unused losses carry forward. On sale, claimed depreciation is recaptured at up to 25%, and gains may owe capital-gains tax (a 1031 exchange can defer both). Figures are a year-1 estimate at your 24.0% rate — not tax advice; consult a CPA.
Schools (NCES district)
- District
- Lubbock ISD
- NCES district ID
- 4828500
- Math proficiency
- 36% ▼ -8.00%
- Reading proficiency
- 39% ▼ -1.00%
- Median HH income
- $39,820
- Composite
- 31.44/100
- National rank
- #5984
- State rank
- #481 of 826 in TX
Livability — Lubbock
- Score
- 80/100
- State rank
- #37
- US rank
- #1749
Category grades
Schools grade is shown separately in the Schools card above.
Census & demographics
- Census place
- Lubbock, TX
- County
- Lubbock County · 293,542 people
- City population
- 283,030
- Metro
- Lubbock, TX
- Population (ZIP)
- 36,442
- Household income
- $63,896
- Rent vs Own
- Severe rent burden
- 2214.0
Population outlook (Lubbock County) Hauer SSP2
- Today (2025)
- 345,960 people
- By 2030
- 371,449 · +7.4%
- By 2040
- 424,539 · +22.7%
- By 2050
- 481,150 · +39.1%
- By 2075
- 633,467 · +83.1%
- By 2100
- 746,853 · +115.9%
Race, ethnicity, and origin ACS 2023
- Neighborhood character
- Diverse neighborhood (Simpson 0.62)
- Race & ethnicity
- White 49% Hispanic / Latino 35% Two or more races 14% Black 9% Asian 3%
- Hispanic origin (detail)
- Mexican 28%
- Common ancestry
- Slovak 3% Italian 1% Serbian 1%
- Foreign-born
- 7% · Canada, China, South Korea
- Languages at home
- 81% English-only · Spanish 13% Chinese 1% Tagalog/Filipino 1%
Political lean MEDSL · Lubbock
- 2024 margin
- Solid R (+39.5) · D 29.7% · R 69.2% · Other 1.0%
- 2008→2024 swing
- -2.8pp toward R · 2008: -36.7pp · 2024: -39.5pp
- All cycles
- 2024: R+39.5 2020: R+32.2 2016: R+38.4 2012: R+40.9 2008: R+36.7
Not yet ingested
- Civics
- —
Market trends
- HPI YoY
- ▼ -56.94%
- Current HPI
- 227.7841
- Rent YoY
- ▲ 2.21%
- Metro
- Lubbock, TX
- State GDP YoY
- ▲ 3.95%
- F500 in state
- 110
Industry mix (Fortune 500 HQ in TX)
| Industry | F500 HQs | Revenue |
|---|---|---|
| Energy | 16 | $1,198B |
|
||
| Technology | 5 | $198B |
|
||
| Engineering / Construction | 4 | $72B |
|
||
| Energy Services | 3 | $60B |
|
||
| Utilities | 3 | $41B |
|
||
| Healthcare | 2 | $330B |
|
||
Price history
+120.0% since first listed9 events — show timeline
- 2026-05-22 Listed $165,000 LARMLS
- 2025-07-17 Sold (Public Records) — Public Records
- 2025-07-15 Sold (MLS) — LARMLS
- 2025-06-17 Pending — LARMLS
- 2025-06-05 Listed $129,000 LARMLS
- 2025-04-15 Price Changed $129,000 LARMLS
- 2010-05-20 Sold (Public Records) — Public Records
- 2010-05-19 Sold (Public Records) — Public Records
- 2007-08-24 Sold (Public Records) $75,000 Public Records
Property tax history
+4.8%/yrLatest (2025): $2,471 · -2.2% YoY. Source: county tax records.
Cash-flow waterfall
monthlySold comps — $/sqft
last 12 mo · ≤1 miLoading sold comps…