2117 Willow Crossing Pkwy #265 · Fort Lupton, CO
Flood risk No data
- FEMA flood zone
- —
- Chance of flooding over 30 yrs
- —
- Est. flood insurance / yr
- —
Fire risk No data
- Est. fire insurance / yr
- —
Heat risk No data
- Hot days now (above threshold)
- —
- Hot days in 30 yrs
- —
Wind risk No data
- Chance of severe wind over 30 yrs
- —
Air-quality risk No data
- Unhealthy air days now
- —
- Unhealthy air days in 30 yrs
- —
Risk factors via First Street. Map © Google.
Why this score? — see what drove the B- grade
The composite is a weighted blend of 9 inputs, each scored 0–100. Each bar is that input's sub-score; the figure is the points it added to the 100-point composite (weight × sub-score).
- Cash flow +24.5/30.0
- ARV discount +15.0/15.0
- DSCR +7.9/10.0
- 1% rule +6.4/10.0
- Condition / age +4.0/5.0
- Livability +3.4/5.0
- Rent growth +2.5/5.0
- Schools +1.8/10.0
- Appreciation +0.0/10.0
$184,995
🖨 Deal sheet 📄 Offer letter ✓ Due diligence
Listing remarks MLS
Step into this beautiful new 3 bed, 2 bath home designed for both comfort and convenience! The spacious galley kitchen offers plenty of counter space and storage, making cooking and entertaining a breeze. All bedrooms feature walk-in closets, while the primary bathroom includes a stylish walk-in shower for a modern touch. You ll also love the large laundry and mud room, perfect for keeping everything organized. Complete with a storage shed for extra space, this home is move-in ready and full of features you ll love! Call us today to find out more about this beautiful home!
Key facts
- Whirlpool appliances
- Dining area
- Open-concept living
Tags
Neighborhood map
What this means for you Summary
Snapshot
- This is a 3-bed/2.0-bath manufactured listed at $185k. Condition is rated good.
Deal economics
- At list price, monthly cash flow is $381 ($5k/yr) — positive.
- The deal already cash-flows at list — no discount required.
- Meets the 1% rule at list price ($2k rent vs $185k).
- Recommended offer: $174k (6.0% below list) — sets the bar for market timing.
- Cap rate 8.8% vs local median 3.8% in Fort Lupton — top-decile yield for the area; either an underpriced asset or a hidden risk that comps aren't pricing in. Stress-test before assuming the spread holds.
Location & tenants
- Location reads 67/100 on livability (#130 in CO) — a middle-class / working-renter tenant base. Strengths: housing A+, amenities B; Watch: health & safety D, schools F, commute F.
- Weld County Reorganized School District No. Re-8 (town): math 17% / reading 23% proficiency, ranked #74 of 86 in CO (top 86%) — low school quality limits family demand, transient renter base, plan for 1-2y turnover.
- Market conditions: 221 active listings in the ZIP; 2 comparable units currently listed for rent nearby; 3,170 units permitted in Weld County in 2024 (278 in 5+ unit buildings).
Forward outlook
- Local home prices are declining (-3.0%/yr); year-one equity from $1k of loan paydown is wiped out by about $6k of value loss. Plan a longer hold.
- Weld County population projected at +46% by 2050 — long-run rental-demand tailwind backs the buy-and-hold thesis.
Negotiation context
- It's been on market 80 days — a 6% lower offer ($174k) is reasonable based on typical stale-listing flexibility.
Questions for the listing agent
- It's been on market 80 days. Have you received any prior offers? Is the seller open to a 6% concession, seller financing, or rate buy-down credit?
- Why hasn't it sold? Are there any deal-killer items the seller is aware of (foundation, flood, title, zoning, code violations)?
- Is there a deadline driving the sale (1031 exchange, divorce, estate, relocation)? That informs how much negotiation room exists.
- Schools are F-rated, which usually means shorter tenancies and higher turnover. Who's the typical renter profile here, and what's been the actual vacancy rate?
- What's the average days-on-market for RENTAL listings here right now (not sales)? A rising rental-DOM trend means longer vacancies and softer asking-rent achievability than the comps imply.
- What's the recent tenant-quality profile in this submarket — average credit score on applications, eviction rate, late-payment / NSF rate, and stable-employment percentage? A property-management company in the area should have these aggregated.
- How much new for-sale + rental construction is in the pipeline within 1–3 miles? Heavy new supply typically softens prices + rents 12–24 months out; constrained supply supports both.
Investment metrics
- 1% rule
- 1.14% ✓
- Cap rate
- 8.76%
- Cash-on-cash
- 8.81%
- DSCR
- 1.39
- GRM
- 7.3
CMA / ARV
- ARV (median comp)
- $268,798
- List price
- $184,995
- Delta
- -31.18%
- Verdict
- UNDERPRICED
- Comps
- 5 within 2.0 mi
Projected returns pro-forma
-3.0% appreciation · 3.0% rent growth · sell at horizon
- IRR
- -2.9%
- Equity multiple
- 0.89×
- Total profit
- $-5,711
- Equity at exit
- $27,583
- IRR
- 6.8%
- Equity multiple
- 1.51×
- Total profit
- $26,361
- Equity at exit
- $15,995
Cash invested: $51,799 (down + closing). Projections, not guarantees.
Landlord ↔ Tenant lean methodology
- Overall (STATE)
- 38 Tenant-Leaning
- State Colorado
- 38 Tenant-Leaning · D+4
- County
- — inherits STATE
- City
- — inherits STATE
ZIP-level market 80621
- Active inventory
- 221
- Price-to-rent
- 7.3×
Monthly cashflow live
- Estimated rent
- $2,100 medium interval (Pro) →
- Mortgage (P&I)
- −$970
- Tax est. 1.5%
- −$231 /mo · $2,775/yr
- Insurance
- −$77
- HOA
- −$0
- Vacancy / Maint / Mgmt
- −$441
- Net cashflow
- $381
Break-even live
UW: 25.0% down · 7.5% · 30yr · 1.5% tax · 5.0% vac · 8.0% maint · 8.0% mgmt
Financing live
Cash to close
- Down payment
- $46,249
- Closing costs
- $5,550
- Reserves months
- —
- Total cash needed
- —
Loan-product check · same deal, 3 products live
Conventional
25% down · 7.5% · 30yr
- Down + closing
- —
- Monthly P&I
- —
- Monthly cashflow
- —
- DSCR
- —
- Eligible?
- —
Personal DTI + credit; lowest rate.
DSCR
20% down · 8.5% · 30yr
- Down + closing
- —
- Monthly P&I
- —
- Monthly cashflow
- —
- DSCR
- —
- Eligible?
- —
No personal income docs; deal must DSCR.
Hard money
10% down · 12.0% · 12mo
- Down + closing
- —
- Monthly P&I
- —
- Monthly cashflow
- —
- DSCR
- —
- Eligible?
- —
Short-term bridge; refi at stabilization.
Rent comps 2 comps
| Address | Beds | Baths | Sqft | Rent | $/sqft | DOM | Units | Dist |
|---|---|---|---|---|---|---|---|---|
| 1300 Whitetail Ave Fort Lupton, CO | 2.0–4.0 | 2.0 | 1296 | $1,800 | $1.39 | 4d | 1 | 0.14mi |
| 2155 Alyssa St Fort Lupton, CO | 3.0 | 2.5 | 1870 | $2,845 | $1.52 | 4d | 1 | 0.27mi |
Listing history 15 events
-
2026-06-18days on market $184,995 Active 80 DOM
-
2026-06-17days on market $184,995 Active 79 DOM
-
2026-06-16days on market $184,995 Active 78 DOM
-
2026-06-15days on market $184,995 Active 77 DOM
-
2026-06-14days on market $184,995 Active 75 DOM
-
2026-06-10days on market $184,995 Active 72 DOM
-
2026-06-09days on market $184,995 Active 71 DOM
-
2026-06-08days on market $184,995 Active 70 DOM
-
2026-06-07days on market $184,995 Active 69 DOM
-
2026-06-03days on market $184,995 Active 65 DOM
-
2026-06-02days on market $184,995 Active 64 DOM
-
2026-06-01days on market $184,995 Active 63 DOM
-
2026-05-31days on market $184,995 Active 62 DOM
-
2026-05-30days on market $184,995 Active 61 DOM
-
2026-03-30$184,995 Active 579-char remark
Show marketing remark (579 chars)
Step into this beautiful new 3 bed, 2 bath home designed for both comfort and convenience! The spacious galley kitchen offers plenty of counter space and storage, making cooking and entertaining a breeze. All bedrooms feature walk-in closets, while the primary bathroom includes a stylish walk-in shower for a modern touch. You ll also love the large laundry and mud room, perfect for keeping everything organized. Complete with a storage shed for extra space, this home is move-in ready and full of features you ll love! Call us today to find out more about this beautiful home!
ⓘ Source: listings_history table (triggers on properties + properties_extension) + one-shot
backfill from property_details.listing_events for pre-trigger history.
Nearby sold comps map
Loading sold comps map…
Walkable amenities ~0.75 mi
Loading nearby amenities…
Taxation est. · year 1
- Rental income
- $25,199
- − Mortgage interest
- −$10,363
- − Property taxes
- −$2,775
- − Insurance
- −$925
- − Repairs & maintenance
- −$2,016
- − Management
- −$2,016
- − Depreciation
- −$5,382
- Taxable income
- $1,723
- Est. tax owed @ 24.0%
- −$414
- After-tax cash flow
- $4,152/yr
For passive investors: Depreciation is non-cash, so a rental often shows a tax loss while cash-flowing — sheltering income. Rental losses are passive: they offset passive income freely, and up to $25,000/yr can offset ordinary (W-2) income if you actively participate and your MAGI is under $100k (phasing out to $0 by $150k); unused losses carry forward. On sale, claimed depreciation is recaptured at up to 25%, and gains may owe capital-gains tax (a 1031 exchange can defer both). Figures are a year-1 estimate at your 24.0% rate — not tax advice; consult a CPA.
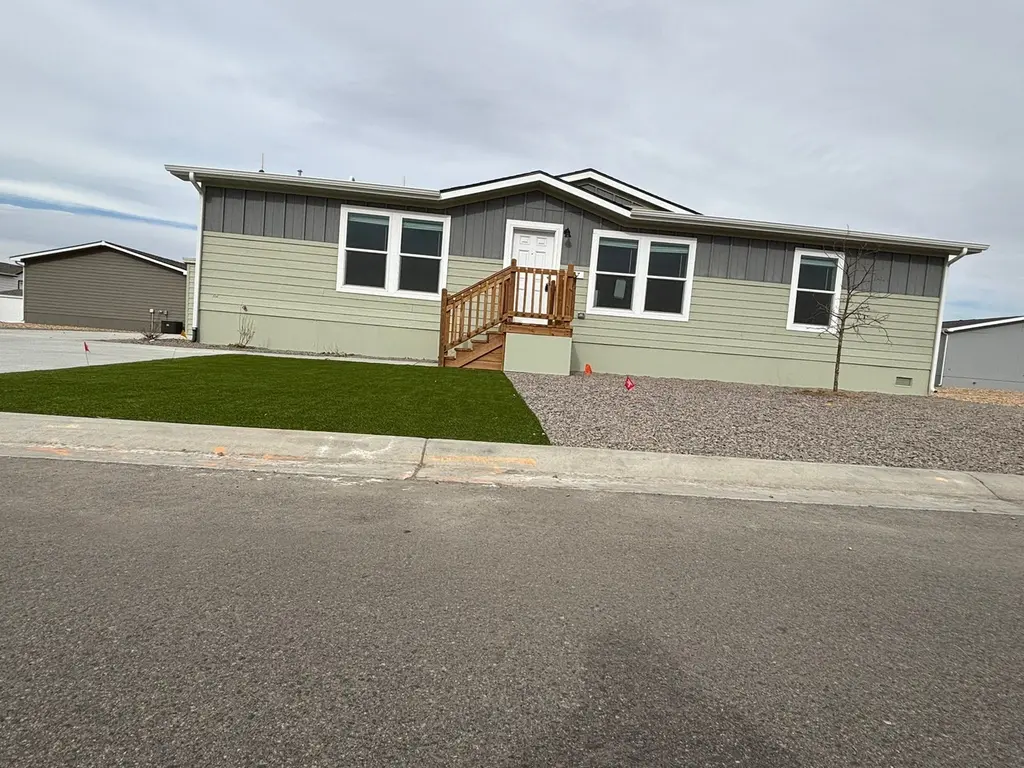
Condition & rehab AI · 1 photo
This move-in ready manufactured home is in excellent condition with a good condition score of 80. It offers a spacious kitchen, modern bathrooms, and well-maintained exterior. Upgrades in paint, landscaping, and appliances would significantly enhance its value for both resale and rental.
Value-add opportunities
- Both Painting exterior and interior walls — Fresh paint enhances curb appeal and interior aesthetics.
- Both Landscaping improvements — Enhances curb appeal and adds value for both resale and rental.
- Both Kitchen appliances — Upgrading appliances can attract more buyers and renters.
- Both Bathroom fixtures — Modernizing bathrooms can increase appeal and value.
- Both Flooring upgrades — Replacing worn-out flooring can improve the home's overall appearance and functionality.
Renovation cost estimate screening
Value-add ROI direction
- Both Painting exterior and interior walls — Fresh paint enhances curb appeal and interior aesthetics. ↑
- Both Landscaping improvements — Enhances curb appeal and adds value for both resale and rental. ↑
- Both Kitchen appliances — Upgrading appliances can attract more buyers and renters. ↑
- Both Bathroom fixtures — Modernizing bathrooms can increase appeal and value. ↑
- Both Flooring upgrades — Replacing worn-out flooring can improve the home's overall appearance and functionality. ↑
ⓘ Cost ranges are severity-bucket heuristics (US national rule-of-thumb). Get contractor quotes + a written scope before underwriting a rehab budget.
Schools (NCES district)
- District
- Weld County Reorganized School District No. Re-8
- NCES district ID
- 0804020
- Math proficiency
- 17% ▼ -6.00%
- Reading proficiency
- 23% ▼ -6.00%
- Median HH income
- $56,116
- Composite
- 18.48/100
- National rank
- #8921
- State rank
- #74 of 86 in CO
Livability — Fort Lupton
- Score
- 67/100
- State rank
- #130
- US rank
- #11069
Category grades
Schools grade is shown separately in the Schools card above.
Census & demographics
- Census place
- Fort Lupton, CO
- City population
- 14,542
- Population (ZIP)
- 14,542
Population outlook (Weld County) Hauer SSP2
- Today (2025)
- 351,957 people
- By 2030
- 385,304 · +9.5%
- By 2040
- 451,818 · +28.4%
- By 2050
- 514,478 · +46.2%
- By 2075
- 648,733 · +84.3%
- By 2100
- 720,400 · +104.7%
Race, ethnicity, and origin ACS 2023
- Neighborhood character
- Majority Hispanic (51%)
- Race & ethnicity
- Hispanic / Latino 51% White 44% Two or more races 16%
- Hispanic origin (detail)
- Mexican 44%
- Common ancestry
- Portuguese 2% Serbian 1% Italian 1%
- Foreign-born
- 14% · Canada
- Languages at home
- 66% English-only · Spanish 34%
Political lean MEDSL · Weld
- 2024 margin
- Strong R (+21.0) · D 38.2% · R 59.2% · Other 2.6%
- 2008→2024 swing
- -12.2pp toward R · 2008: -8.7pp · 2024: -21.0pp
- All cycles
- 2024: R+21.0 2020: R+18.0 2016: R+22.4 2012: R+13.2 2008: R+8.7
Not yet ingested
- Civics
- —
Market trends
- HPI YoY
- ▼ -164.37%
- Current HPI
- 285.9162
- Rent YoY
- —
- Metro
- —
- State GDP YoY
- ▲ 1.95%
- F500 in state
- 14
Industry mix (Fortune 500 HQ in CO)
| Industry | F500 HQs | Revenue |
|---|---|---|
| Technology Distribution | 1 | $31B |
|
||
| Food / Agriculture | 1 | $18B |
|
||
| Packaging | 1 | $14B |
|
||
| Healthcare | 1 | $13B |
|
||
| Energy | 1 | $10B |
|
||
| Technology | 1 | $4B |
|
||
Price history
1 event — show timeline
- 2026-03-30 Listed $184,995 Zillow
Cash-flow waterfall
monthlySold comps — $/sqft
last 12 mo · ≤1 miLoading sold comps…