 🔨 Auction
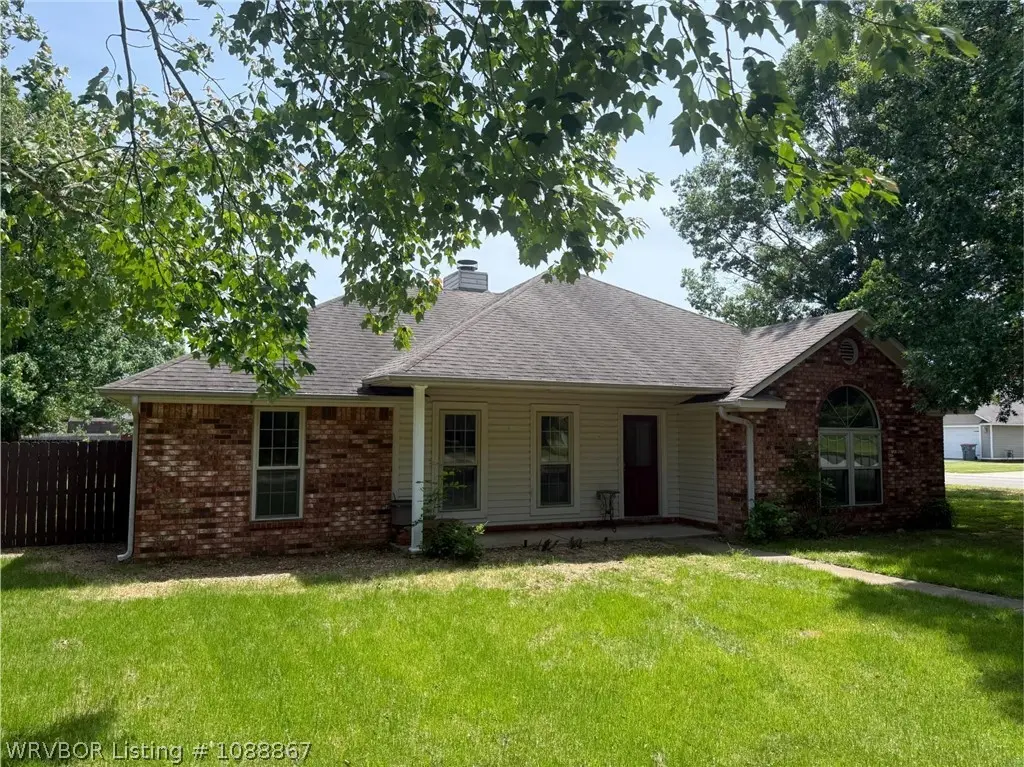
1803 Oakview Dr · Lavaca, AR
Flood risk 1/10 · Minimal
- FEMA flood zone
- X (unshaded)
- Chance of flooding over 30 yrs
- 0.0%
- Est. flood insurance / yr
- $507 – $1,088
Fire risk 6/10 · Moderate
- Est. fire insurance / yr
- $1,499 – $2,785
Heat risk 7/10 · Major
- Hot days now (above 111°F)
- 7 days/yr
- Hot days in 30 yrs
- 21 days/yr
Wind risk 2/10 · Minimal
- Chance of severe wind over 30 yrs
- 2.0%
Air-quality risk 2/10 · Minimal
- Unhealthy air days now
- 0 days/yr
- Unhealthy air days in 30 yrs
- 1 days/yr
Risk factors via First Street. Map © Google.
Why this score? — see what drove the F grade
The composite is a weighted blend of 9 inputs, each scored 0–100. Each bar is that input's sub-score; the figure is the points it added to the 100-point composite (weight × sub-score).
- Appreciation +10.0/10.0
- ARV discount +7.5/15.0
- Livability +3.9/5.0
- Schools +3.3/10.0
- Rent growth +2.5/5.0
- Condition / age +2.5/5.0
- Cash flow +0.0/30.0
- 1% rule +0.0/10.0
- DSCR +0.0/10.0
$1
🖨 Deal sheet 📄 Offer letter ✓ Due diligence
Listing remarks
Auction 5/29/2026 @ 11 am. This charming and recently remodeled 1,658 sf brick home is a standout opportunity for homeowners and investors alike. Situated on a spacious corner lot, the three-bedroom, two-bathroom residence features a fresh interior with new paint and durable vinyl plank flooring throughout. The heart of the home is a large, open living room anchored by a cozy fireplace, providing an inviting space for relaxation or entertaining. The property is equally impressive outside, offering a private backyard enclosed by a sturdy privacy fence and a convenient two-car garage. Also included are two shop buildings equipped with roll-up doors, perfect for storage, projects, or equipment
Key facts
- Recently remodeled
- Private backyard
- Sturdy privacy fence
Tags
Property features AI
Exterior
- Parking: Attached garage with 2 covered spaces; Concrete driveway; Garage door opener
- Utilities: Public water; Electricity available; Natural gas available
- Home design: Single family house; One story; Slab foundation
- Construction: Brick construction; Shingle roof; Built as a house
- Exterior features: Covered patio/porch; Privacy wood fencing; Back yard fencing; Outbuilding
Interior
- Kitchen: Dishwasher; Microwave; Oven
- Flooring: Vinyl
- Bathrooms: 2 full bathrooms
- Heating & cooling: Central heating; Central air; Ceiling fan(s)
- Interior features: Ceiling fan(s); Eat-in kitchen; Gas water heater; Family room fireplace
- Laundry & utility: Washer hookup; Electric dryer hookup
Neighborhood map
What this means for you Summary
Snapshot
- This is a 3-bed/2.0-bath single-family listed at $1.
Deal economics
- At list price, monthly cash flow is $-1k ($-15k/yr) — negative.
- The deal already cash-flows at list — no discount required.
- Meets the 1% rule at list price ($750 rent vs $1).
- Cap rate 0.6% vs local median 2.0% in Lavaca — below-typical yield; the buyer is paying a premium for something (appreciation thesis, condition, location) that the cap rate doesn't capture.
Location & tenants
- Location reads 78/100 on livability (#5 in AR, #2,687 nationally) — a middle-class / working-renter tenant base. Strengths: cost of living A+, housing A+, health & safety A+; Watch: amenities F, commute F.
- Lavaca School District (rural): math 36% / reading 39% proficiency, ranked #77 of 238 in AR (top 32%) — families likely to look elsewhere, expect single-tenant / working-renter base with shorter leases.
- Zoned schools: Lavaca Elementary School (math 57% / reading 42%, grade D, #93 of 454 statewide, top 23%, 346 students, 56% FRL); Lavaca Middle School (math 32% / reading 35%, grade F, #129 of 201 statewide, top 64%, 231 students, 48% FRL); Lavaca High School (math 27% / reading 47%, grade F, #64 of 292 statewide, top 26%, 260 students, 44% FRL).
- Market conditions: 61 active listings in the ZIP; 1 comparable units currently listed for rent nearby; 388 units permitted in Sebastian County in 2024 (16 in 5+ unit buildings).
Forward outlook
- In year one you build about $29k of equity ($2k loan paydown + $27k appreciation (10.0% local appreciation)).
- Sebastian County population projected at +7% by 2050 — modest demand growth; plan on rents tracking national, not racing it.
- By year 2, paydown + projected appreciation supports a ~$47k cash-out refi (75% LTV) — recoverable capital for the next deal without selling this one.
Negotiation context
- It's been on market 24 days — a 2% lower offer ($0) is reasonable based on typical stale-listing flexibility.
Risks & watch-outs
- Watch-outs: property tax is 407868.0% of price.
- Climate carrying-cost: major wildfire risk; extreme-heat days projected 7→21/yr by 2055 (HVAC capex compounding) — expect insurance premiums to compound above CPI over the hold.
Questions for the listing agent
- What do current leases actually rent for vs. the listed asking? Can we see a recent rent roll and the last 12 months of T-12 income?
- Property tax is high relative to price — has the assessment been appealed recently, and will the sale trigger a re-assessment?
- Is there a deadline driving the sale (1031 exchange, divorce, estate, relocation)? That informs how much negotiation room exists.
- The area grade is low — what's the realistic commute time and amenity access for the typical tenant pool here? Any planned neighborhood developments (good or bad) we should know about?
- What's the average days-on-market for RENTAL listings here right now (not sales)? A rising rental-DOM trend means longer vacancies and softer asking-rent achievability than the comps imply.
- What's the recent tenant-quality profile in this submarket — average credit score on applications, eviction rate, late-payment / NSF rate, and stable-employment percentage? A property-management company in the area should have these aggregated.
- How much new for-sale + rental construction is in the pipeline within 1–3 miles? Heavy new supply typically softens prices + rents 12–24 months out; constrained supply supports both.
Investment metrics
- 1% rule
- 0.28% ✗
- Cap rate
- 0.61%
- Cash-on-cash
- -20.28%
- DSCR
- 0.10
- GRM
- 30.2
CMA / ARV
- ARV (on-the-fly)
- $271,912
- Comps found
- 12
Show comp detail 12 sales within ~0.75 mi
| Address | Dist | Beds/Ba | Sqft | Sold | Price | $/sf | Match |
|---|---|---|---|---|---|---|---|
| 906 Jessie Dr | 0.21mi | 3/2.0 | 1,688 (+2%) | 3mo | $275,000 | $163 | 85 |
| 200 Kelly Cir | 0.31mi | 3/2.0 | 1,642 (-1%) | 8mo | $250,000 | $152 | 78 |
| 109 Adams St | 0.11mi | 3/2.0 | 1,710 (+3%) | 16mo | $230,000 | $135 | 76 |
| 414 Kyla Marie Ct | 0.51mi | 3/2.0 | 1,658 (0%) | 3mo | $285,000 | $172 | 73 |
| 907 Village Dr | 0.25mi | 3/2.0 | 1,542 (-7%) | 12mo | $199,900 | $130 | 66 |
| 605 Highway 96 | 0.30mi | 3/2.0 | 1,743 (+5%) | 15mo | $250,000 | $143 | 65 |
| 510 Kyla Marie | 0.52mi | 3/2.0 | 1,759 (+6%) | 4mo | $306,500 | $174 | 62 |
| 510 Caseys Ct | 0.45mi | 3/2.0 | 1,490 (-10%) | 7mo | $245,000 | $164 | 56 |
| 2301 Joyce Dr | 0.41mi | 3/2.0 | 1,860 (+12%) | 10mo | $310,000 | $167 | 52 |
| 201 Kelly Cir | 0.34mi | 3/2.0 | 1,900 (+15%) | 12mo | $263,000 | $138 | 50 |
| 301 Rock Cir | 0.68mi | 3/2.0 | 1,495 (-10%) | 17mo | $275,000 | $184 | 38 |
| 414 Stoneledge Dr | 0.57mi | 3/2.0 | 1,893 (+14%) | 16mo | $367,500 | $194 | 36 |
Match score weights: distance 35% · size 25% · config 20% · recency 20%. Top-matched comps best support the ARV.
Projected returns pro-forma
10.0% appreciation · 3.0% rent growth · sell at horizon
- IRR
- 10.4%
- Equity multiple
- 1.87×
- Total profit
- $66,156
- Equity at exit
- $244,960
- IRR
- 11.5%
- Equity multiple
- 4.41×
- Total profit
- $259,283
- Equity at exit
- $528,265
Cash invested: $76,135 (down + closing). Projections, not guarantees.
Landlord ↔ Tenant lean methodology
- Overall (STATE)
- 92 Strongly Landlord-Friendly
- State Arkansas
- 92 Strongly Landlord-Friendly · R+14
- County
- — inherits STATE
- City
- — inherits STATE
ZIP-level market 72941
- Home prices YoY
- 5.0%
- Active inventory
- 61
Monthly cashflow live
- Estimated rent
- $750 medium interval (Pro) →
- Mortgage (P&I)
- −$1,426
- Tax est. 1.5%
- −$340 /mo · $4,079/yr
- Insurance
- −$113
- HOA
- −$0
- Vacancy / Maint / Mgmt
- −$158
- Net cashflow
- $-1,287
Break-even live
UW: 25.0% down · 7.5% · 30yr · 1.5% tax · 5.0% vac · 8.0% maint · 8.0% mgmt
Financing live
Cash to close
- Down payment
- $67,978
- Closing costs
- $8,157
- Reserves months
- —
- Total cash needed
- —
Loan-product check · same deal, 3 products live
Conventional
25% down · 7.5% · 30yr
- Down + closing
- —
- Monthly P&I
- —
- Monthly cashflow
- —
- DSCR
- —
- Eligible?
- —
Personal DTI + credit; lowest rate.
DSCR
20% down · 8.5% · 30yr
- Down + closing
- —
- Monthly P&I
- —
- Monthly cashflow
- —
- DSCR
- —
- Eligible?
- —
No personal income docs; deal must DSCR.
Hard money
10% down · 12.0% · 12mo
- Down + closing
- —
- Monthly P&I
- —
- Monthly cashflow
- —
- DSCR
- —
- Eligible?
- —
Short-term bridge; refi at stabilization.
Rent comps 1 comps
| Address | Beds | Baths | Sqft | Rent | $/sqft | DOM | Units | Dist |
|---|---|---|---|---|---|---|---|---|
| 1307 W Main St Unit 53 Lavaca, AR | 3.0 | 2.0 | 1280 | $750 | $0.59 | 44d | 1 | 0.28mi |
Listing history 4 events
-
2026-05-05$1 Active
-
2010-08-30soldstatus $135,000
-
1992-02-27soldstatus $73,000
-
1989-08-14soldstatus $62,000
ⓘ Source: listings_history table (triggers on properties + properties_extension) + one-shot
backfill from property_details.listing_events for pre-trigger history.
Climate risk First Street
- Flood 1/10 Low FEMA zone X (unshaded) · 0% chance over 30 yrs
- Wildfire 6/10 Major
- Heat 7/10 Severe 7 d/yr ≥111°F today · 21 d/yr by 30 yrs out
- Wind 2/10 Low 2% chance of damaging wind over 30 yrs
- Air quality 2/10 Low 0 unhealthy d/yr today · 1 by 30 yrs out
Nearby sold comps map
Loading sold comps map…
Walkable amenities ~0.75 mi
Loading nearby amenities…
Taxation est. · year 1
- Rental income
- $9,000
- − Mortgage interest
- −$15,231
- − Property taxes
- −$4,079
- − Insurance
- −$1,360
- − Repairs & maintenance
- −$720
- − Management
- −$720
- − Depreciation
- −$7,910
- Taxable loss
- −$21,020
- Est. tax savings @ 24.0%
- +$5,045
- After-tax cash flow
- $-10,395/yr
For passive investors: Depreciation is non-cash, so a rental often shows a tax loss while cash-flowing — sheltering income. Rental losses are passive: they offset passive income freely, and up to $25,000/yr can offset ordinary (W-2) income if you actively participate and your MAGI is under $100k (phasing out to $0 by $150k); unused losses carry forward. On sale, claimed depreciation is recaptured at up to 25%, and gains may owe capital-gains tax (a 1031 exchange can defer both). Figures are a year-1 estimate at your 24.0% rate — not tax advice; consult a CPA.
Schools (NCES district)
- District
- Lavaca School District
- NCES district ID
- 0508730
- Math proficiency
- 36% ▼ -15.00%
- Reading proficiency
- 39% ▼ -10.00%
- Median HH income
- $51,457
- Composite
- 32.55/100
- National rank
- #5687
- State rank
- #77 of 238 in AR
Livability — Lavaca
- Score
- 78/100
- State rank
- #5
- US rank
- #2687
Category grades
Schools grade is shown separately in the Schools card above.
Census & demographics
- Census place
- Lavaca, AR
- Population (ZIP)
- 4,775
Population outlook (Sebastian County) Hauer SSP2
- Today (2025)
- 133,992 people
- By 2030
- 136,620 · +2.0%
- By 2040
- 140,832 · +5.1%
- By 2050
- 143,301 · +6.9%
- By 2075
- 147,964 · +10.4%
- By 2100
- 145,848 · +8.8%
Race, ethnicity, and origin ACS 2023
- Neighborhood character
- Predominantly White (89%)
- Race & ethnicity
- White 89% Two or more races 7% Hispanic / Latino 5%
- Common ancestry
- Slovak 2% Iranian 1% Serbian 1%
- Foreign-born
- 1% · Canada
- Languages at home
- 99% English-only · Spanish 1%
Political lean MEDSL · Sebastian
- 2024 margin
- Solid R (+37.5) · D 30.0% · R 67.6% · Other 2.4%
- 2008→2024 swing
- -2.9pp toward R · 2008: -34.6pp · 2024: -37.5pp
- All cycles
- 2024: R+37.5 2020: R+35.5 2016: R+38.1 2012: R+37.1 2008: R+34.6
Not yet ingested
- Civics
- —
Market trends
- HPI YoY
- ▲ 17.99%
- Current HPI
- 376.37
- Rent YoY
- —
- Metro
- —
- State GDP YoY
- ▲ 3.80%
- F500 in state
- 10
Industry mix (Fortune 500 HQ in AR)
| Industry | F500 HQs | Revenue |
|---|---|---|
| Retail | 1 | $681B |
|
||
| Food / Agriculture | 1 | $53B |
|
||
| Retail / Energy | 1 | $22B |
|
||
| Transportation / Logistics | 1 | $12B |
|
||
| Energy | 1 | $4B |
|
||
Price history
+117.7% since first listed4 events — show timeline
- 2026-05-05 Listed $1 WRVBOR
- 2010-08-30 Sold (Public Records) $135,000 Public Records
- 1992-02-27 Sold (Public Records) $73,000 Public Records
- 1989-08-14 Sold (Public Records) $62,000 Public Records
Property tax history
+8.1%/yrLatest (2025): $2,482 · +400.8% YoY. Source: county tax records.
Cash-flow waterfall
monthlySold comps — $/sqft
last 12 mo · ≤1 miLoading sold comps…