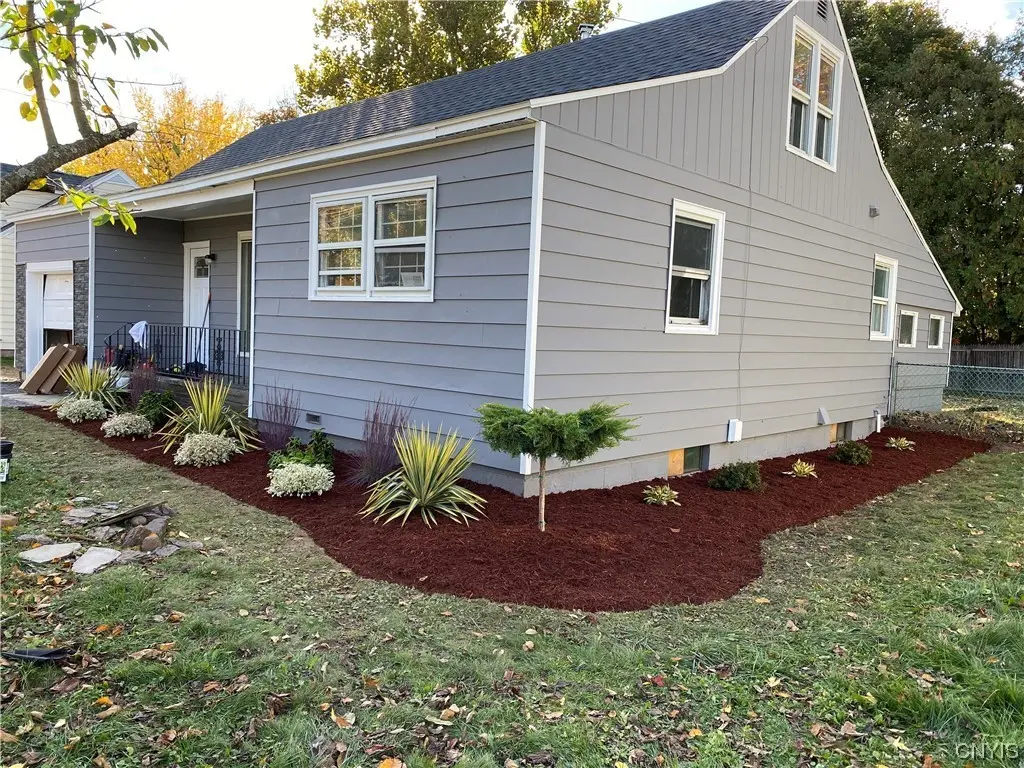
230 Orchard Dr W · Mattydale, NY
Flood risk 1/10 · Minimal
- FEMA flood zone
- X (unshaded)
- Chance of flooding over 30 yrs
- 0.0%
- Est. flood insurance / yr
- $473 – $860
Fire risk 1/10 · Minimal
- Est. fire insurance / yr
- $691 – $1,283
Heat risk 3/10 · Minor
- Hot days now (above 95°F)
- 7 days/yr
- Hot days in 30 yrs
- 16 days/yr
Wind risk 1/10 · Minimal
- Chance of severe wind over 30 yrs
- 0.0%
Air-quality risk 2/10 · Minimal
- Unhealthy air days now
- 0 days/yr
- Unhealthy air days in 30 yrs
- 1 days/yr
Risk factors via First Street. Map © Google.
Why this score? — see what drove the D+ grade
The composite is a weighted blend of 9 inputs, each scored 0–100. Each bar is that input's sub-score; the figure is the points it added to the 100-point composite (weight × sub-score).
- ARV discount +15.0/15.0
- Cash flow +11.9/30.0
- 1% rule +5.5/10.0
- Schools +4.3/10.0
- Livability +3.6/5.0
- DSCR +3.5/10.0
- Rent growth +2.5/5.0
- Condition / age +2.5/5.0
- Appreciation +0.0/10.0
$229,500
🖨 Deal sheet 📄 Offer letter ✓ Due diligence
Listing remarks MLS
1774 Square foot 4 Bedroom 1 1/2 bath Cape Cod in the Liverpool School District. Has full basement ready for your new ideas. Large private back yard. Located off Bailey Road on quiet dead end street.
Key facts
- 8,307 sq ft lot
- Garage
- Built 1951
Neighborhood map
What this means for you Summary
Snapshot
- This is a 4-bed/2.5-bath single-family listed at $230k.
Deal economics
- At list price, monthly cash flow is $-60 ($-718/yr) — negative.
- To cash-flow at today's rent, offer at most $219k (4.6% below list).
- Meets the 1% rule at list price ($2k rent vs $230k).
- Recommended offer: $216k (6.0% below list) — sets the bar for market timing.
Location & tenants
- Location reads 72/100 on livability (#360 in NY) — a middle-class / working-renter tenant base. Strengths: cost of living A+, housing A+, health & safety A+; Watch: schools D, crime D, amenities F.
- Liverpool Central School District (suburban): math 49% / reading 49% proficiency, ranked #381 of 590 in NY (top 65%) — families likely to look elsewhere, expect single-tenant / working-renter base with shorter leases.
- Market conditions: 65 active listings in the ZIP; 1 comparable units currently listed for rent nearby; 616 units permitted in Onondaga County in 2024 (256 in 5+ unit buildings).
Forward outlook
- Local home prices are declining (-3.0%/yr); year-one equity from $2k of loan paydown is wiped out by about $7k of value loss. Plan a longer hold.
- Onondaga County population projected to shrink 9% by 2050 — rents likely to lag national; underwrite the cash flow, not the appreciation.
Negotiation context
- It's been on market 76 days — a 6% lower offer ($216k) is reasonable based on typical stale-listing flexibility.
- 2 sale attempts since 7y ago with the ask held roughly flat each time — persistent listings suggest the price (not the market) is what's stuck; bring a comps-based counter.
Risks & watch-outs
- Watch-outs: property tax is 3.4% of price; built in 1951 — expect roof / HVAC / electrical / plumbing capex.
Questions for the listing agent
- What do current leases actually rent for vs. the listed asking? Can we see a recent rent roll and the last 12 months of T-12 income?
- It's been on market 76 days. Have you received any prior offers? Is the seller open to a 6% concession, seller financing, or rate buy-down credit?
- Built in 1951 — when were the roof, HVAC, electrical panel, plumbing, and water heater last replaced?
- Property tax is high relative to price — has the assessment been appealed recently, and will the sale trigger a re-assessment?
- Why hasn't it sold? Are there any deal-killer items the seller is aware of (foundation, flood, title, zoning, code violations)?
- Is there a deadline driving the sale (1031 exchange, divorce, estate, relocation)? That informs how much negotiation room exists.
- Schools are D-rated, which usually means shorter tenancies and higher turnover. Who's the typical renter profile here, and what's been the actual vacancy rate?
- Crime grade is D in this area — have there been break-ins, vandalism, or insurance claims at this property in the last 3 years? What carrier currently insures it and at what premium?
- The area grade is low — what's the realistic commute time and amenity access for the typical tenant pool here? Any planned neighborhood developments (good or bad) we should know about?
- What's the average days-on-market for RENTAL listings here right now (not sales)? A rising rental-DOM trend means longer vacancies and softer asking-rent achievability than the comps imply.
- What's the recent tenant-quality profile in this submarket — average credit score on applications, eviction rate, late-payment / NSF rate, and stable-employment percentage? A property-management company in the area should have these aggregated.
- How much new for-sale + rental construction is in the pipeline within 1–3 miles? Heavy new supply typically softens prices + rents 12–24 months out; constrained supply supports both.
Investment metrics
- 1% rule
- 1.05% ✓
- Cap rate
- 5.98%
- Cash-on-cash
- -1.12%
- DSCR
- 0.95
- GRM
- 8.0
CMA / ARV
- ARV (on-the-fly)
- $310,450
- Comps found
- 12
Show comp detail 12 sales within ~0.75 mi
| Address | Dist | Beds/Ba | Sqft | Sold | Price | $/sf | Match |
|---|---|---|---|---|---|---|---|
| 104 Orchard Dr E | 0.20mi | 3/1.5 (-1) | 1,683 (-5%) | 1mo | $295,000 | $175 | 72 |
| 6846 Crystalwood Dr | 0.48mi | 4/2.5 | 1,792 (+1%) | 12mo | $326,000 | $182 | 65 |
| 5068 Constitution Ln | 0.30mi | 3/2.0 (-1) | 1,808 (+2%) | 18mo | $415,000 | $230 | 61 |
| 304 Colony Park Dr | 0.68mi | 4/2.5 | 1,872 (+6%) | 2mo | $362,000 | $193 | 57 |
| 4990 Sandalwood Ln | 0.70mi | 4/2.5 | 1,840 (+4%) | 6mo | $340,000 | $185 | 56 |
| 4963 Driftwood Dr | 0.66mi | 4/1.5 | 1,792 (+1%) | 10mo | $340,000 | $190 | 56 |
| 219 Carlton Dr | 0.54mi | 4/2.0 | 1,747 (-2%) | 18mo | $275,000 | $157 | 55 |
| 306 Hyland Dr | 0.60mi | 3/2.0 (-1) | 1,830 (+3%) | 8mo | $255,000 | $139 | 53 |
| 6867 Thomas Dr | 0.61mi | 4/2.5 | 1,968 (+11%) | 5mo | $295,000 | $150 | 49 |
| 120 Colony Park Dr | 0.53mi | 4/2.5 | 1,948 (+10%) | 16mo | $330,000 | $169 | 45 |
| 230 Crestwood Dr | 0.59mi | 4/2.0 | 1,521 (-14%) | 7mo | $255,000 | $168 | 41 |
| 214 Crestwood Dr | 0.48mi | 3/1.5 (-1) | 1,536 (-13%) | 12mo | $220,000 | $143 | 36 |
Match score weights: distance 35% · size 25% · config 20% · recency 20%. Top-matched comps best support the ARV.
Projected returns pro-forma
-3.0% appreciation · 3.0% rent growth · sell at horizon
- IRR
- -18.0%
- Equity multiple
- 0.37×
- Total profit
- $-40,737
- Equity at exit
- $34,219
- IRR
- -9.9%
- Equity multiple
- 0.39×
- Total profit
- $-39,311
- Equity at exit
- $19,843
Cash invested: $64,260 (down + closing). Projections, not guarantees.
Landlord ↔ Tenant lean methodology
- Overall (STATE)
- 15 Strongly Tenant-Friendly
- State New York
- 15 Strongly Tenant-Friendly · D+10
- County
- — inherits STATE
- City
- — inherits STATE
ZIP-level market 13212
- Active inventory
- 65
- Price-to-rent
- 8.0×
Monthly cashflow live
- Estimated rent
- $2,400 medium interval (Pro) →
- Mortgage (P&I)
- −$1,204
- Tax from tax record
- −$657 /mo · $7,880/yr
- Insurance
- −$96
- HOA
- −$0
- Vacancy / Maint / Mgmt
- −$504
- Net cashflow
- $-60
Break-even live
UW: 25.0% down · 7.5% · 30yr · 1.5% tax · 5.0% vac · 8.0% maint · 8.0% mgmt
Financing live
Cash to close
- Down payment
- $57,375
- Closing costs
- $6,885
- Reserves months
- —
- Total cash needed
- —
Loan-product check · same deal, 3 products live
Conventional
25% down · 7.5% · 30yr
- Down + closing
- —
- Monthly P&I
- —
- Monthly cashflow
- —
- DSCR
- —
- Eligible?
- —
Personal DTI + credit; lowest rate.
DSCR
20% down · 8.5% · 30yr
- Down + closing
- —
- Monthly P&I
- —
- Monthly cashflow
- —
- DSCR
- —
- Eligible?
- —
No personal income docs; deal must DSCR.
Hard money
10% down · 12.0% · 12mo
- Down + closing
- —
- Monthly P&I
- —
- Monthly cashflow
- —
- DSCR
- —
- Eligible?
- —
Short-term bridge; refi at stabilization.
Rent comps 1 comps
| Address | Beds | Baths | Sqft | Rent | $/sqft | DOM | Units | Dist |
|---|---|---|---|---|---|---|---|---|
| 103 Hyland Dr Syracuse, NY | 3.0 | 1.0 | 1260 | $2,400 | $1.90 | 13d | 1 | 0.29mi |
Listing history 13 events
-
2023-12-27status Pending
-
2023-08-04soldstatus $220,000
-
2023-06-12status Pending Sale
-
2023-03-28$229,500 Active
-
2020-01-08soldstatus $86,000
-
2020-01-03soldstatus $86,000 Closed Sale or Rented 199-char remark
Show marketing remark (199 chars)
1774 Square foot 4 Bedroom 1 1/2 bath Cape Cod in the Liverpool School District. Has full basement ready for your new ideas. Large private back yard. Located off Bailey Road on quiet dead end street.
-
2019-12-09status Pending Sale 199-char remark
Show marketing remark (199 chars)
1774 Square foot 4 Bedroom 1 1/2 bath Cape Cod in the Liverpool School District. Has full basement ready for your new ideas. Large private back yard. Located off Bailey Road on quiet dead end street.
-
2019-12-02status Under Contract- Do Not Show 199-char remark
Show marketing remark (199 chars)
1774 Square foot 4 Bedroom 1 1/2 bath Cape Cod in the Liverpool School District. Has full basement ready for your new ideas. Large private back yard. Located off Bailey Road on quiet dead end street.
-
2019-11-19historical Continue to Show- Under Contract 199-char remark
Show marketing remark (199 chars)
1774 Square foot 4 Bedroom 1 1/2 bath Cape Cod in the Liverpool School District. Has full basement ready for your new ideas. Large private back yard. Located off Bailey Road on quiet dead end street.
-
2019-10-03price $89,500 199-char remark
Show marketing remark (199 chars)
1774 Square foot 4 Bedroom 1 1/2 bath Cape Cod in the Liverpool School District. Has full basement ready for your new ideas. Large private back yard. Located off Bailey Road on quiet dead end street.
-
2019-08-28$94,500 Active 199-char remark
Show marketing remark (199 chars)
1774 Square foot 4 Bedroom 1 1/2 bath Cape Cod in the Liverpool School District. Has full basement ready for your new ideas. Large private back yard. Located off Bailey Road on quiet dead end street.
-
2006-07-07soldstatus $114,000
-
2004-03-09soldstatus $87,900
ⓘ Source: listings_history table (triggers on properties + properties_extension) + one-shot
backfill from property_details.listing_events for pre-trigger history.
Tax reassessment forecast NY · Partial reset (capped growth)
- Current annual tax
- $7,880 · $657/mo
- Projected year-2 tax
- $7,880 · $657/mo
- Expected delta
- $0/yr ($0/mo · 0.0%)
ⓘ Screening estimate from a state-policy table — verify with the county assessor before closing.
Climate risk First Street
- Flood 1/10 Low FEMA zone X (unshaded) · 0% chance over 30 yrs
- Wildfire 1/10 Low
- Heat 3/10 Moderate 7 d/yr ≥95°F today · 16 d/yr by 30 yrs out
- Wind 1/10 Low 0% chance of damaging wind over 30 yrs
- Air quality 2/10 Low 0 unhealthy d/yr today · 1 by 30 yrs out
Nearby sold comps map
Loading sold comps map…
Walkable amenities ~0.75 mi
Loading nearby amenities…
Taxation est. · year 1
- Rental income
- $28,800
- − Mortgage interest
- −$12,856
- − Property taxes
- −$7,880
- − Insurance
- −$1,148
- − Repairs & maintenance
- −$2,304
- − Management
- −$2,304
- − Depreciation
- −$6,676
- Taxable loss
- −$4,368
- Est. tax savings @ 24.0%
- +$1,048
- After-tax cash flow
- $330/yr
For passive investors: Depreciation is non-cash, so a rental often shows a tax loss while cash-flowing — sheltering income. Rental losses are passive: they offset passive income freely, and up to $25,000/yr can offset ordinary (W-2) income if you actively participate and your MAGI is under $100k (phasing out to $0 by $150k); unused losses carry forward. On sale, claimed depreciation is recaptured at up to 25%, and gains may owe capital-gains tax (a 1031 exchange can defer both). Figures are a year-1 estimate at your 24.0% rate — not tax advice; consult a CPA.
Schools (NCES district)
- District
- Liverpool Central School District
- NCES district ID
- 3617520
- Math proficiency
- 49% ▼ -6.00%
- Reading proficiency
- 49% ▲ 1.00%
- Median HH income
- $59,134
- Composite
- 42.84/100
- National rank
- #3134
- State rank
- #381 of 590 in NY
Livability — Mattydale
- Score
- 72/100
- State rank
- #360
- US rank
- #6130
Category grades
Schools grade is shown separately in the Schools card above.
Census & demographics
- City population
- 6,155
- Population (ZIP)
- 20,185
Population outlook (Onondaga County) Hauer SSP2
- Today (2025)
- 467,894 people
- By 2030
- 463,381 · -1.0%
- By 2040
- 447,697 · -4.3%
- By 2050
- 426,399 · -8.9%
- By 2075
- 373,661 · -20.1%
- By 2100
- 307,967 · -34.2%
Race, ethnicity, and origin ACS 2023
- Neighborhood character
- Predominantly White (90%)
- Race & ethnicity
- White 90% Two or more races 5% Hispanic / Latino 4% Black 1%
- Common ancestry
- Romanian 10% Lithuanian 5% Slovak 2%
- Foreign-born
- 4% · Canada
- Languages at home
- 93% English-only · Spanish 3% Other Indo-European 2% German/W. Germanic 1%
Political lean MEDSL · Onondaga
- 2024 margin
- D (+17.3) · D 58.6% · R 41.4%
- 2008→2024 swing
- -3.0pp toward R · 2008: 20.3pp · 2024: 17.3pp
- All cycles
- 2024: D+17.3 2020: D+20.6 2016: D+12.8 2012: D+21.1 2008: D+20.3
Not yet ingested
- Civics
- —
Market trends
- HPI YoY
- ▼ -210.93%
- Current HPI
- 317.7322
- Rent YoY
- —
- Metro
- —
- State GDP YoY
- ▲ 2.60%
- F500 in state
- 92
Industry mix (Fortune 500 HQ in NY)
| Industry | F500 HQs | Revenue |
|---|---|---|
| Financial Services | 10 | $950B |
|
||
| Consumer Goods | 9 | $162B |
|
||
| Insurance | 4 | $225B |
|
||
| Telecommunications | 2 | $144B |
|
||
| Pharmaceuticals | 2 | $112B |
|
||
| Media / Entertainment | 2 | $69B |
|
||
Price history
+150.3% since first listed13 events — show timeline
- 2023-12-27 Pending — CNYIS
- 2023-08-04 Sold (Public Records) $220,000 Public Records
- 2023-06-12 Pending — CNYIS
- 2023-03-28 Listed $229,500 CNYIS
- 2020-01-08 Sold (Public Records) $86,000 Public Records
- 2020-01-03 Sold (MLS) $86,000 CNYIS
- 2019-12-09 Pending — CNYIS
- 2019-12-02 Pending — CNYIS
- 2019-11-19 Contingent — CNYIS
- 2019-10-03 Price Changed $89,500 CNYIS
- 2019-08-28 Listed $94,500 CNYIS
- 2006-07-07 Sold (Public Records) $114,000 Public Records
- 2004-03-09 Sold (Public Records) $87,900 Public Records
Property tax history
+5.7%/yrLatest (2025): $7,880 · +0.3% YoY. Source: county tax records.
Cash-flow waterfall
monthlySold comps — $/sqft
last 12 mo · ≤1 miLoading sold comps…