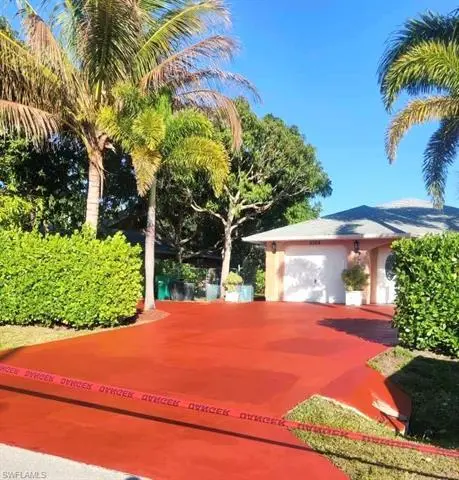
5364 Texas Ave · Naples Manor, FL
Flood risk 8/10 · Major
- FEMA flood zone
- AE
- Chance of flooding over 30 yrs
- 0.98%
- Est. flood insurance / yr
- $1,737 – $8,500
Fire risk 1/10 · Minimal
- Est. fire insurance / yr
- $947 – $1,759
Heat risk 10/10 · Severe
- Hot days now (above 108°F)
- 7 days/yr
- Hot days in 30 yrs
- 29 days/yr
Wind risk 10/10 · Severe
- Chance of severe wind over 30 yrs
- 99.0%
Air-quality risk 2/10 · Minimal
- Unhealthy air days now
- 2 days/yr
- Unhealthy air days in 30 yrs
- 2 days/yr
Risk factors via First Street. Map © Google.
Why this score? — see what drove the C grade
The composite is a weighted blend of 9 inputs, each scored 0–100. Each bar is that input's sub-score; the figure is the points it added to the 100-point composite (weight × sub-score).
- Cash flow +25.8/30.0
- DSCR +8.6/10.0
- 1% rule +5.8/10.0
- Schools +5.0/10.0
- ARV discount +4.5/15.0
- Rent growth +3.9/5.0
- Livability +3.3/5.0
- Condition / age +2.5/5.0
- Appreciation +0.0/10.0
$450,000
🖨 Deal sheet (PDF) 📄 Offer letter ✓ Due diligence
Listing remarks MLS
Bank owned! Not a Short Sale! 3 BR 2 BA 1 car garage. Seller will pay 3% of buyers costs. Lender owned property, Pre-qualification letter or proof of funds must accompany all offers. Being sold As-is with right to inspect.
Key facts
- Large deck
- Fruit trees
- New roof
Tags
Property features AI
Finance
- Other: Located in the Naples Manor development; Lot is approximately 0.19 acres with landscaped area view
- HOA & community: Non-gated community; HOA maintenance covers sewer; Community offers extra storage and internet access
Exterior
- Parking: Attached 1-car garage
- Security: Impact resistant windows
- Utilities: Central water; Central sewer; Cable available
- Home design: Single-family residential home; One-story (Ranch) design; Rear exposure faces north
- Construction: Built in 2004; Concrete block construction; Stucco exterior finish; Shingle roof; Single-hung windows
- Exterior features: Fruit trees on property; Exterior storage
Interior
- Kitchen: Range; Refrigerator
- Bedrooms: 3 bedrooms
- Flooring: Tile floors
- Bathrooms: 2 full bathrooms; Master bathroom with tub only
- Heating & cooling: Central electric heat; Central electric cooling
- Interior features: Smoke detectors; Formal dining area; Split-bedroom floor plan; Laundry located in the garage; Unfurnished
- Laundry & utility: Washer/dryer hookup; Laundry in garage
Neighborhood map
What this means for you Summary
Snapshot
- This is a 3-bed/2.0-bath single-family listed at $450k.
Deal economics
- At list price, monthly cash flow is $666 ($8k/yr) — positive.
- The deal already cash-flows at list — no discount required.
- Meets the 1% rule at list price ($5k rent vs $450k).
Location & tenants
- Location reads 66/100 on livability (#615 in FL) — a middle-class / working-renter tenant base. Strengths: housing A+, health & safety A+, cost of living B+; Watch: amenities F, commute F, employment D-.
- Collier (suburban): math 60% / reading 56% proficiency, ranked #16 of 73 in FL (top 22%) — acceptable for families but not a draw, mixed tenant base, ~2y average lease.
- Zoned schools: Parkside Elementary School (math 54% / reading 45%, grade D, #1,088 of 2,144 statewide, top 53%, 608 students, 70% FRL); Manatee Middle School (math 61% / reading 43%, grade C+, #217 of 571 statewide, top 40%, 749 students, 64% FRL); Lely High School (math 40% / reading 39%, grade F, #304 of 667 statewide, top 47%, 1,504 students, 54% FRL).
- Market conditions: Rents rising fast (+5.6%/yr); 598 active listings in the ZIP; 40 comparable units currently listed for rent nearby; rentals at typical pace (median 25d on market — plan ~3-4 weeks tenant-placement turnaround); solid renter incomes; 3,520 units permitted in Collier County in 2024 (959 in 5+ unit buildings).
- At $4,844/mo this rent would consume 71% of the median local household income ($82k/yr) (locally 954% of renters already pay >50% of income on rent) — very limited rent-growth headroom before tenants either downsize or default.
Forward outlook
- Local home prices are declining (-3.0%/yr); year-one equity from $3k of loan paydown is wiped out by about $14k of value loss. Plan a longer hold.
- Collier County population projected at +30% by 2050 — long-run rental-demand tailwind backs the buy-and-hold thesis.
- At projected returns (-3.0% appreciation + 5.6% rent growth), your $126k cash investment doubles in ~10 years — after that, you're playing with house money.
Negotiation context
- Only 10 days on market — expect competitive offers; lowballing is unlikely to land.
- 3 sale attempts since 17y ago with the ask held roughly flat each time — persistent listings suggest the price (not the market) is what's stuck; bring a comps-based counter.
- Current owner paid $78k; list at $450k implies a 478% gain — meaningful room to come down on a strong offer.
Risks & watch-outs
- Watch-outs: flood insurance adds $427/mo.
- Climate carrying-cost: in FEMA flood zone AE (mandatory federal flood insurance); severe wind risk, 99% chance of damaging wind over 30y; extreme-heat days projected 7→29/yr by 2055 (HVAC capex compounding) — expect insurance premiums to compound above CPI over the hold.
Questions for the listing agent
- What's the actual annual flood-insurance premium (NFIP or private), and is the property in a SFHA with mandatory coverage?
- Is there a deadline driving the sale (1031 exchange, divorce, estate, relocation)? That informs how much negotiation room exists.
- Schools are F-rated, which usually means shorter tenancies and higher turnover. Who's the typical renter profile here, and what's been the actual vacancy rate?
- What's the average days-on-market for RENTAL listings here right now (not sales)? A rising rental-DOM trend means longer vacancies and softer asking-rent achievability than the comps imply.
- What's the recent tenant-quality profile in this submarket — average credit score on applications, eviction rate, late-payment / NSF rate, and stable-employment percentage? A property-management company in the area should have these aggregated.
- How much new for-sale + rental construction is in the pipeline within 1–3 miles? Heavy new supply typically softens prices + rents 12–24 months out; constrained supply supports both.
Investment metrics
- 1% rule
- 1.08% ✓
- Cap rate
- 9.21%
- Cash-on-cash
- 10.40%
- DSCR
- 1.46
- GRM
- 7.7
CMA / ARV
- ARV (on-the-fly)
- $421,968
- Comps found
- 1
Show comp detail 1 sale within ~0.75 mi
| Address | Dist | Beds/Ba | Sqft | Sold | Price | $/sf | Match |
|---|---|---|---|---|---|---|---|
| 5309 Warren St | 0.74mi | 3/2.0 | 1,451 (+2%) | 9mo | $433,000 | $298 | 54 |
Match score weights: distance 35% · size 25% · config 20% · recency 20%. Top-matched comps best support the ARV.
Projected returns pro-forma
-3.0% appreciation · 5.59% rent growth · sell at horizon
- IRR
- -3.6%
- Equity multiple
- 0.86×
- Total profit
- $-17,472
- Equity at exit
- $67,096
- IRR
- 8.9%
- Equity multiple
- 1.76×
- Total profit
- $95,837
- Equity at exit
- $38,908
Cash invested: $126,000 (down + closing). Projections, not guarantees.
Landlord ↔ Tenant lean methodology
- Overall (STATE)
- 87 Strongly Landlord-Friendly
- State Florida
- 87 Strongly Landlord-Friendly · R+3
- County
- — inherits STATE
- City
- — inherits STATE
ZIP-level market 34113
- Rents YoY
- 5.6%
- Active inventory
- 598
- Price-to-rent
- 7.7×
Monthly cashflow live
- Estimated rent
- $4,844 high interval (Pro) →
- Mortgage (P&I)
- −$2,360
- Tax from tax record
- −$187 /mo · $2,248/yr
- Insurance
- −$188
- Flood insurance flood zone
- −$427 /mo · $5,118/yr
- HOA
- −$0
- Vacancy / Maint / Mgmt
- −$1,017
- Net cashflow
- $666
Break-even live
Sensitivity live
| Price | -10% $920 | -5% $793 | +0% $666 | +5% $538 | +10% $411 |
|---|---|---|---|---|---|
| Rent | -10% $283 | -5% $474 | +0% $666 | +5% $857 | +10% $1,048 |
| Rate | -1.0pp $892 | -0.5pp $780 | base $666 | +0.5pp $549 | +1.0pp $430 |
UW: 25.0% down · 7.5% · 30yr · 1.5% tax · 5.0% vac · 8.0% maint · 8.0% mgmt
Financing live
Cash to close
- Down payment
- $112,500
- Closing costs
- $13,500
- Reserves months
- —
- Total cash needed
- —
Loan-product check · same deal, 3 products live
Conventional
25% down · 7.5% · 30yr
- Down + closing
- —
- Monthly P&I
- —
- Monthly cashflow
- —
- DSCR
- —
- Eligible?
- —
Personal DTI + credit; lowest rate.
DSCR
20% down · 8.5% · 30yr
- Down + closing
- —
- Monthly P&I
- —
- Monthly cashflow
- —
- DSCR
- —
- Eligible?
- —
No personal income docs; deal must DSCR.
Hard money
10% down · 12.0% · 12mo
- Down + closing
- —
- Monthly P&I
- —
- Monthly cashflow
- —
- DSCR
- —
- Eligible?
- —
Short-term bridge; refi at stabilization.
Rent comps 40 comps
| Address | Beds | Baths | Sqft | Rent | $/sqft | DOM | Units | Dist |
|---|---|---|---|---|---|---|---|---|
| 6065 Divot Ct Naples, FL | 3.0 | 2.0 | 1738 | $10,000 | $5.75 | 25d | 1 | 0.22mi |
| 6101 Dogleg Dr Naples, FL | 3.0 | 2.0 | 1694 | $12,000 | $7.08 | 25d | 1 | 0.29mi |
| 5324 Treetops Dr Unit G-2 Naples, FL | 2.0 | 2.0 | 878 | $1,800 | $2.05 | 15d | 1 | 0.58mi |
| 5379 Treetops Dr Unit M203 Naples, FL | 2.0 | 2.0 | 950 | $1,700 | $1.79 | 25d | 1 | 0.64mi |
| 6769 Bent Grass Dr Naples, FL | 2.0 | 2.0 | 1719 | $10,500 | $6.11 | 25d | 1 | 0.64mi |
| 6757 Bent Grass Dr Naples, FL | 3.0 | 2.0 | 1719 | $3,650 | $2.12 | 25d | 1 | 0.66mi |
| 6719 Crowned Eagle Ln Naples, FL | 3.0 | 2.0 | 1745 | $3,850 | $2.21 | 25d | 1 | 0.66mi |
| 5300 Treetops Dr Unit I206 Naples, FL | 2.0 | 2.0 | 878 | $1,850 | $2.11 | 25d | 1 | 0.67mi |
| 5254 Treetops Dr Naples, FL | 2.0 | 2.0 | 878 | $1,700 | $1.94 | 25d | 1 | 0.67mi |
| 6737 Bent Grass Dr Naples, FL | 3.0 | 2.0 | 1745 | $12,000 | $6.88 | 25d | 1 | 0.70mi |
| 11496 Sumter Grove Cir Naples, FL | 1.0–2.0 | 1.0–2.0 | 1067 | $2,134 | $2.00 | 15d | 14 | 0.70mi |
| 6971 Amen Corner Ct Naples, FL | 3.0 | 2.0 | 1749 | $12,000 | $6.86 | 25d | 1 | 0.73mi |
| 494 Saint Andrews Blvd Naples, FL | 3.0 | 2.0 | 1700 | $2,800 | $1.65 | 25d | 1 | 0.83mi |
| 6815 Ascot Dr #102 Naples, FL | 3.0 | 2.0 | 1632 | $7,500 | $4.60 | 25d | 1 | 0.90mi |
| 5293 Dixie Dr Unit 1546039P Naples, FL | 2.0 | 2.0 | 1130 | $1,561 | $1.38 | 15d | 1 | 0.96mi |
| 24 Cheyenne Trl Naples, FL | 2.0 | 2.0 | 888 | $3,500 | $3.94 | 15d | 1 | 0.97mi |
| 8432 Indian Wells Way Naples, FL | 3.0 | 2.0 | 1746 | $3,495 | $2.00 | 15d | 1 | 0.98mi |
| 332 Bradstrom Cir #201 Naples, FL | 2.0 | 2.0 | 1257 | $2,200 | $1.75 | 25d | 1 | 0.99mi |
| 326 Bradstrom Cir Unit 204F Naples, FL | 3.0 | 2.0 | 1200 | $3,500 | $2.92 | 25d | 1 | 1.01mi |
| 326 Bradstrom Cir Unit 103F Naples, FL | 2.0 | 2.0 | 1113 | $1,800 | $1.62 | 25d | 1 | 1.01mi |
| 8468 Indian Wells Way Naples, FL | 3.0 | 2.0 | 1704 | $10,500 | $6.16 | 25d | 1 | 1.04mi |
| 8036 Belmont Ct Unit 1073497P Naples, FL | 3.0 | 2.0 | 1840 | $5,316 | $2.89 | 25d | 1 | 1.05mi |
| 315 Saint Andrews Blvd Unit A25 Naples, FL | 2.0 | 2.0 | 1126 | $1,530 | $1.36 | 25d | 1 | 1.06mi |
| 8161 Twelve Oaks Cir #512 Naples, FL | 2.0 | 2.0 | 1066 | $5,000 | $4.69 | 25d | 1 | 1.08mi |
| 265 Deerwood Cir Naples, FL | 2.0 | 2.0 | 1179 | $5,000 | $4.24 | 25d | 1 | 1.10mi |
| 9115 Napoli Ct #101 Naples, FL | 3.0 | 2.0 | 1741 | $9,500 | $5.46 | 25d | 1 | 1.13mi |
| 248 Pebble Beach Cir Unit G201 Naples, FL | 2.0 | 2.0 | 1163 | $2,300 | $1.98 | 25d | 1 | 1.14mi |
| 9512 Napoli Ln Unit 101 Naples, FL | 3.0 | 2.0 | 1741 | $10,000 | $5.74 | 15d | 1 | 1.15mi |
| 7100 Falcons Glen Blvd Naples, FL | 3.0 | 2.0 | 1650 | $10,000 | $6.06 | 25d | 1 | 1.16mi |
| 7112 Falcons Glen Blvd Naples, FL | 3.0 | 2.0 | 1786 | $14,000 | $7.84 | 25d | 1 | 1.17mi |
| 255 Pine Valley Cir Naples, FL | 3.0 | 1.5 | 1574 | $3,500 | $2.22 | 25d | 1 | 1.17mi |
| 9022 Michael Cir Unit 2-205 Naples, FL | 2.0 | 2.0 | 1450 | $3,500 | $2.41 | 25d | 1 | 1.20mi |
| 452 Bristle Cone Ln #27 Naples, FL | 2.0 | 2.0 | 1129 | $2,000 | $1.77 | 25d | 1 | 1.21mi |
| 7955 Mahogany Run Ln #515 Naples, FL | 2.0 | 2.0 | 1244 | $8,925 | $7.17 | 25d | 1 | 1.21mi |
| 7955 Mahogany Run Ln Unit 1504173P Naples, FL | 3.0 | 2.0 | 1442 | $5,840 | $4.05 | 15d | 1 | 1.21mi |
| 7940 Mahogany Run Ln #623 Naples, FL | 2.0 | 2.0 | 1389 | $8,000 | $5.76 | 25d | 1 | 1.22mi |
| 520 Augusta Blvd Unit B204 Naples, FL | 3.0 | 2.0 | 1294 | $2,200 | $1.70 | 25d | 1 | 1.22mi |
| 640 Augusta Blvd Naples, FL | 2.0 | 2.0 | 1634 | $2,700 | $1.65 | 25d | 1 | 1.23mi |
| 9175 Michael Cir #4 Naples, FL | 3.0 | 2.0 | 1639 | $3,195 | $1.95 | 15d | 1 | 1.24mi |
| 7930 Mahogany Run Ln #826 Naples, FL | 3.0 | 2.0 | 1454 | $9,450 | $6.50 | 25d | 1 | 1.25mi |
Listing history 10 events
-
2026-05-14status Pending
-
2026-05-04$450,000 Active
-
2026-05-04historical
-
2026-02-27price $470,000
-
2025-11-10price $485,000
-
2025-09-01price $505,000
-
2025-07-28$525,000 Active
-
2009-03-27soldstatus $77,900 224-char remark
Show marketing remark (224 chars)
Bank owned! Not a Short Sale! 3 BR 2 BA 1 car garage. Seller will pay 3% of buyers costs. Lender owned property, Pre-qualification letter or proof of funds must accompany all offers. Being sold As-is with right to inspect.
-
2009-02-09$79,900 224-char remark
Show marketing remark (224 chars)
Bank owned! Not a Short Sale! 3 BR 2 BA 1 car garage. Seller will pay 3% of buyers costs. Lender owned property, Pre-qualification letter or proof of funds must accompany all offers. Being sold As-is with right to inspect.
-
2006-08-02soldstatus $318,000
ⓘ Source: listings_history table (triggers on properties + properties_extension) + one-shot
backfill from property_details.listing_events for pre-trigger history.
Tax reassessment forecast FL · Resets to sale price
- Current annual tax
- $2,248 · $187/mo
- Projected year-2 tax
- $3,735 · $311/mo
- Expected delta
- +$1,487/yr (+$124/mo · 66.2%)
ⓘ Screening estimate from a state-policy table — verify with the county assessor before closing.
Climate risk First Street
- Flood 8/10 Severe FEMA zone AE · 98% chance over 30 yrs
- Wildfire 1/10 Low
- Heat 10/10 Extreme 7 d/yr ≥108°F today · 29 d/yr by 30 yrs out
- Wind 10/10 Extreme 99% chance of damaging wind over 30 yrs
- Air quality 2/10 Low 2 unhealthy d/yr today · 2 by 30 yrs out
Nearby sold comps map
Loading sold comps map…
Walkable amenities ~0.75 mi
Loading nearby amenities…
Taxation est. · year 1
- Rental income
- $58,129
- − Mortgage interest
- −$25,207
- − Property taxes
- −$2,248
- − Insurance
- −$7,369
- − Repairs & maintenance
- −$4,650
- − Management
- −$4,650
- − Depreciation
- −$13,091
- Taxable income
- $914
- Est. tax owed @ 24.0%
- −$219
- After-tax cash flow
- $7,768/yr
For passive investors: Depreciation is non-cash, so a rental often shows a tax loss while cash-flowing — sheltering income. Rental losses are passive: they offset passive income freely, and up to $25,000/yr can offset ordinary (W-2) income if you actively participate and your MAGI is under $100k (phasing out to $0 by $150k); unused losses carry forward. On sale, claimed depreciation is recaptured at up to 25%, and gains may owe capital-gains tax (a 1031 exchange can defer both). Figures are a year-1 estimate at your 24.0% rate — not tax advice; consult a CPA.
Schools (NCES district)
- District
- Collier
- NCES district ID
- 1200330
- Math proficiency
- 60% ▼ -4.00%
- Reading proficiency
- 56% ▼ -2.00%
- Median HH income
- $58,275
- Composite
- 50.23/100
- National rank
- #1892
- State rank
- #16 of 73 in FL
Livability — Naples Manor
- Score
- 66/100
- State rank
- #615
- US rank
- #11875
Category grades
Schools grade is shown separately in the Schools card above.
Census & demographics
- Census place
- Naples Manor, FL
- County
- Collier County · 396,295 people
- Metro
- Naples-Marco Island, FL
- Population (ZIP)
- 26,056
- Household income
- $81,674
- Rent vs Own
- Severe rent burden
- 954.0
Population outlook (Collier County) Hauer SSP2
- Today (2025)
- 420,858 people
- By 2030
- 450,054 · +6.9%
- By 2040
- 502,232 · +19.3%
- By 2050
- 544,932 · +29.5%
- By 2075
- 627,203 · +49.0%
- By 2100
- 659,015 · +56.6%
Race, ethnicity, and origin ACS 2023
- Neighborhood character
- Diverse neighborhood (Simpson 0.59)
- Race & ethnicity
- White 56% Hispanic / Latino 28% Black 12% Two or more races 11% Asian 2%
- Hispanic origin (detail)
- Mexican 17% Puerto Rican 3% Cuban 2%
- Common ancestry
- Hispanic 10% Romanian 3% Lithuanian 2%
- Foreign-born
- 26% · Canada, Jamaica, Vietnam
- Languages at home
- 63% English-only · Spanish 24% French/Haitian/Cajun 9% Other Indo-European 2%
Political lean MEDSL · Collier
- 2024 margin
- Solid R (+33.1) · D 33.1% · R 66.2%
- 2008→2024 swing
- -10.6pp toward R · 2008: -22.5pp · 2024: -33.1pp
- All cycles
- 2024: R+33.1 2020: R+24.7 2016: R+26.0 2012: R+30.1 2008: R+22.5
Not yet ingested
- Civics
- —
Market trends
- HPI YoY
- ▼ -194.86%
- Current HPI
- 279.4232
- Rent YoY
- ▲ 5.59%
- Metro
- Naples-Marco Island, FL
- State GDP YoY
- ▲ 3.28%
- F500 in state
- 36
Industry mix (Fortune 500 HQ in FL)
| Industry | F500 HQs | Revenue |
|---|---|---|
| Industrial Technology | 2 | $29B |
|
||
| Insurance | 2 | $17B |
|
||
| Retail | 1 | $60B |
|
||
| Technology Distribution | 1 | $58B |
|
||
| Homebuilding | 1 | $35B |
|
||
| Technology Manufacturing | 1 | $35B |
|
||
Price history
+41.5% since first listed10 events — show timeline
- 2026-05-14 Pending — NAPLESMLS
- 2026-05-04 Listing Removed — NAPLESMLS
- 2026-05-04 Listed $450,000 NAPLESMLS
- 2026-02-27 Price Changed $470,000 NAPLESMLS
- 2025-11-10 Price Changed $485,000 NAPLESMLS
- 2025-09-01 Price Changed $505,000 NAPLESMLS
- 2025-07-28 Listed $525,000 NAPLESMLS
- 2009-03-27 Sold (MLS) $77,900 NAPLESMLS
- 2009-02-09 Listed $79,900 NAPLESMLS
- 2006-08-02 Sold (Public Records) $318,000 Public Records
Property tax history
+9.3%/yrLatest (2025): $2,248 · +11.6% YoY. Source: county tax records.
Cash-flow waterfall
monthlySold comps — $/sqft
last 12 mo · ≤1 miLoading sold comps…