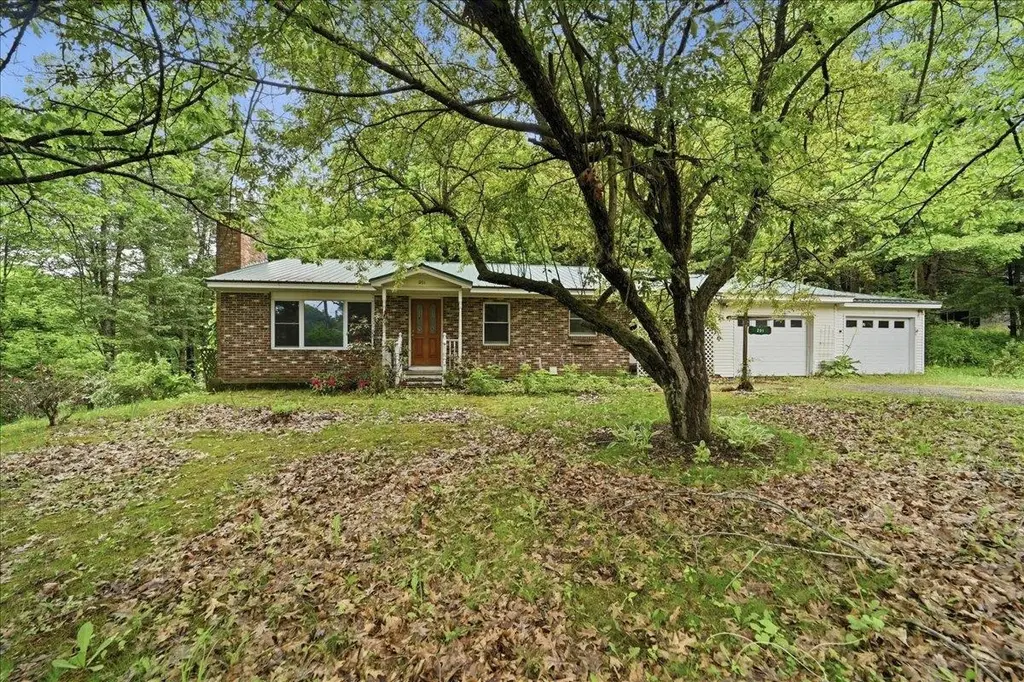
201 High St · Lyndon, VT
Flood risk 1/10 · Minimal
- FEMA flood zone
- X
- Chance of flooding over 30 yrs
- 0.0%
- Est. flood insurance / yr
- $473 – $860
Fire risk 2/10 · Minimal
- Est. fire insurance / yr
- $480 – $892
Heat risk 2/10 · Minimal
- Hot days now (above 90°F)
- 7 days/yr
- Hot days in 30 yrs
- 16 days/yr
Wind risk 2/10 · Minimal
- Chance of severe wind over 30 yrs
- 4.0%
Air-quality risk 2/10 · Minimal
- Unhealthy air days now
- 1 days/yr
- Unhealthy air days in 30 yrs
- 1 days/yr
Risk factors via First Street. Map © Google.
Why this score? — see what drove the C grade
The composite is a weighted blend of 9 inputs, each scored 0–100. Each bar is that input's sub-score; the figure is the points it added to the 100-point composite (weight × sub-score).
- Cash flow +16.7/30.0
- Appreciation +10.0/10.0
- ARV discount +7.5/15.0
- DSCR +5.2/10.0
- Schools +5.0/10.0
- 1% rule +4.5/10.0
- Rent growth +2.5/5.0
- Livability +2.5/5.0
- Condition / age +2.5/5.0
$209,900
🖨 Deal sheet 📄 Offer letter ✓ Due diligence
Listing remarks
Opportunity awaits with this spacious 3-bedroom, 2-bath home conveniently located in the heart of Lyndonville. Offering over 2,600 square feet of living space, this property features a finished basement complete with a kitchenette, providing flexible options for extended family, guests, or additional living and entertaining space. Recent freeze damage presents a unique opportunity for buyers looking to add value and make the home their own. With a generous lot, ample living space, and an in-town location close to schools, shopping, restaurants, and local amenities, this property offers plenty of potential for renovation and customization. Whether you're an investor, contractor, or buyer loo
Key facts
- Kitchenette
- Generous lot
- In-town location
Tags
Property features AI
Finance
- Financial info: Property listed as foreclosed/bank-owned/REO
Exterior
- Parking: 2-car garage; Gravel driveway
- Utilities: Public water; Public sewer; 100 Amp service with circuit breakers; No listed utilities (other); Internet availability unknown
- Home design: Ranch-style home; Existing construction; Metal roof
- Construction: Wood frame with vinyl siding; Built in 1973
- Exterior features: Corner lot; Hilly terrain; Landscaped; Level areas
Interior
- Kitchen: Main-level kitchen; Basement kitchen
- Bedrooms: Three bedrooms on the main level
- Flooring: Carpet
- Bathrooms: One full bathroom on the main level; One 3/4 bathroom in the basement
- Heating & cooling: Baseboard heat
- Interior features: Five total rooms; Bonus room in the basement; Family room in the basement; Main-level family room; Main-level kitchen; Basement kitchen; Basement 3/4 bath; Basement walkout; Concrete basement
Neighborhood map
What this means for you Summary
Snapshot
- This is a 3-bed/2.0-bath single-family listed at $210k.
Deal economics
- At list price, monthly cash flow is $132 ($2k/yr) — positive.
- The deal already cash-flows at list — no discount required.
- To meet the 1% rule (rent ≥ 1% of price), the offer needs to be $199k (5.3% below list).
- Recommended offer: $199k (5.3% below list) — sets the bar for 1% rule.
Location & tenants
- Location reads: area grade C — affects rentability + tenant quality, not the cash-flow math above.
- Zoned schools: Lyndon Town School (math 31% / reading 39%, grade F, #121 of 192 statewide, top 63%, 501 students, 45% FRL).
- Market conditions: 41 active listings in the ZIP; 112 units permitted in Caledonia County in 2024 (15 in 5+ unit buildings).
Forward outlook
- In year one you build about $22k of equity ($1k loan paydown + $21k appreciation (10.0% local appreciation)).
- Caledonia County population projected at -20% by 2050 — secular population decline; favor cash flow + early exit over multi-decade hold.
- At projected returns (10.0% appreciation + 3.0% rent growth), your $59k cash investment doubles in ~3 years — after that, you're playing with house money.
- By year 2, paydown + projected appreciation supports a ~$36k cash-out refi (75% LTV) — recoverable capital for the next deal without selling this one.
Negotiation context
- Only 1 days on market — expect competitive offers; lowballing is unlikely to land.
- Current owner paid $116k; list at $210k implies a 80% gain — meaningful room to come down on a strong offer.
Questions for the listing agent
- Built in 1973 — when were the roof, HVAC, electrical panel, plumbing, and water heater last replaced?
- Is there a deadline driving the sale (1031 exchange, divorce, estate, relocation)? That informs how much negotiation room exists.
- What's the average days-on-market for RENTAL listings here right now (not sales)? A rising rental-DOM trend means longer vacancies and softer asking-rent achievability than the comps imply.
- What's the recent tenant-quality profile in this submarket — average credit score on applications, eviction rate, late-payment / NSF rate, and stable-employment percentage? A property-management company in the area should have these aggregated.
- How much new for-sale + rental construction is in the pipeline within 1–3 miles? Heavy new supply typically softens prices + rents 12–24 months out; constrained supply supports both.
Investment metrics
- 1% rule
- 0.95% ✗
- Cap rate
- 7.05%
- Cash-on-cash
- 2.70%
- DSCR
- 1.12
- GRM
- 8.8
CMA / ARV
No comps found within radius.
Projected returns pro-forma
10.0% appreciation · 3.0% rent growth · sell at horizon
- IRR
- 26.2%
- Equity multiple
- 3.09×
- Total profit
- $122,773
- Equity at exit
- $189,095
- IRR
- 23.0%
- Equity multiple
- 7.04×
- Total profit
- $354,959
- Equity at exit
- $407,790
Cash invested: $58,772 (down + closing). Projections, not guarantees.
Landlord ↔ Tenant lean methodology
- Overall (STATE)
- 41 Moderately Tenant-Leaning
- State Vermont
- 41 Moderately Tenant-Leaning · D+15
- County
- — inherits STATE
- City
- — inherits STATE
ZIP-level market 05851
- Home prices YoY
- 9.6%
- Active inventory
- 41
- Price-to-rent
- 8.8×
Monthly cashflow live
- Estimated rent
- $1,988 medium interval (Pro) →
- Mortgage (P&I)
- −$1,101
- Tax from tax record
- −$250 /mo · $2,994/yr
- Insurance
- −$87
- HOA
- −$0
- Vacancy / Maint / Mgmt
- −$417
- Net cashflow
- $132
Break-even live
UW: 25.0% down · 7.5% · 30yr · 1.5% tax · 5.0% vac · 8.0% maint · 8.0% mgmt
Financing live
Cash to close
- Down payment
- $52,475
- Closing costs
- $6,297
- Reserves months
- —
- Total cash needed
- —
Loan-product check · same deal, 3 products live
Conventional
25% down · 7.5% · 30yr
- Down + closing
- —
- Monthly P&I
- —
- Monthly cashflow
- —
- DSCR
- —
- Eligible?
- —
Personal DTI + credit; lowest rate.
DSCR
20% down · 8.5% · 30yr
- Down + closing
- —
- Monthly P&I
- —
- Monthly cashflow
- —
- DSCR
- —
- Eligible?
- —
No personal income docs; deal must DSCR.
Hard money
10% down · 12.0% · 12mo
- Down + closing
- —
- Monthly P&I
- —
- Monthly cashflow
- —
- DSCR
- —
- Eligible?
- —
Short-term bridge; refi at stabilization.
Listing history 3 events
-
2026-06-18status $209,900 Active 1 DOM
-
2026-06-17remarks 699-char remark
-
2026-06-17$209,900 Coming Soon 1 DOM
ⓘ Source: listings_history table (triggers on properties + properties_extension) + one-shot
backfill from property_details.listing_events for pre-trigger history.
Tax reassessment forecast VT · Partial reset (capped growth)
- Current annual tax
- $2,994 · $250/mo
- Projected year-2 tax
- $3,491 · $291/mo
- Expected delta
- +$497/yr (+$41/mo · 16.6%)
ⓘ Screening estimate from a state-policy table — verify with the county assessor before closing.
Climate risk First Street
- Flood 1/10 Low FEMA zone X · 0% chance over 30 yrs
- Wildfire 2/10 Low
- Heat 2/10 Low 7 d/yr ≥90°F today · 16 d/yr by 30 yrs out
- Wind 2/10 Low 4% chance of damaging wind over 30 yrs
- Air quality 2/10 Low 1 unhealthy d/yr today · 1 by 30 yrs out
Nearby sold comps map
Loading sold comps map…
Walkable amenities ~0.75 mi
Loading nearby amenities…
Taxation est. · year 1
- Rental income
- $23,850
- − Mortgage interest
- −$11,758
- − Property taxes
- −$2,994
- − Insurance
- −$1,050
- − Repairs & maintenance
- −$1,908
- − Management
- −$1,908
- − Depreciation
- −$6,106
- Taxable loss
- −$1,873
- Est. tax savings @ 24.0%
- +$450
- After-tax cash flow
- $2,039/yr
For passive investors: Depreciation is non-cash, so a rental often shows a tax loss while cash-flowing — sheltering income. Rental losses are passive: they offset passive income freely, and up to $25,000/yr can offset ordinary (W-2) income if you actively participate and your MAGI is under $100k (phasing out to $0 by $150k); unused losses carry forward. On sale, claimed depreciation is recaptured at up to 25%, and gains may owe capital-gains tax (a 1031 exchange can defer both). Figures are a year-1 estimate at your 24.0% rate — not tax advice; consult a CPA.
Schools (NCES district)
No district data.
Livability — Lyndon
No livability data for this city. (Only ~50 U.S. cities are tracked.)
Census & demographics
- Census place
- Lyndonville, VT
- Population (ZIP)
- 5,972
Population outlook (Caledonia County) Hauer SSP2
- Today (2025)
- 29,828 people
- By 2030
- 28,820 · -3.4%
- By 2040
- 26,262 · -12.0%
- By 2050
- 23,780 · -20.3%
- By 2075
- 18,516 · -37.9%
- By 2100
- 13,647 · -54.2%
Race, ethnicity, and origin ACS 2023
- Neighborhood character
- Predominantly White (91%)
- Race & ethnicity
- White 91% Two or more races 5% Hispanic / Latino 3% Black 1%
- Common ancestry
- Lithuanian 9% Slovak 6% Romanian 2%
- Foreign-born
- 2% · Canada
- Languages at home
- 98% English-only · French/Haitian/Cajun 1%
Political lean MEDSL · Caledonia
- 2024 margin
- D (+12.4) · D 54.5% · R 42.0% · Other 3.5%
- 2008→2024 swing
- -10.8pp toward R · 2008: 23.3pp · 2024: 12.4pp
- All cycles
- 2024: D+12.4 2020: D+15.2 2016: D+7.0 2012: D+22.9 2008: D+23.3
Not yet ingested
- Civics
- —
Market trends
- HPI YoY
- ▲ 28.00%
- Current HPI
- 319.1832
- Rent YoY
- —
- Metro
- —
- State GDP YoY
- —
- F500 in state
- 0
Price history
+80.3% since first listed2 events — show timeline
- 2026-06-17 Coming Soon $209,900 PrimeMLS
- 2015-08-07 Sold (Public Records) $116,400 Public Records
Property tax history
-0.1%/yrLatest (2024): $2,994 · +13.4% YoY. Source: county tax records.
Cash-flow waterfall
monthlySold comps — $/sqft
last 12 mo · ≤1 miLoading sold comps…