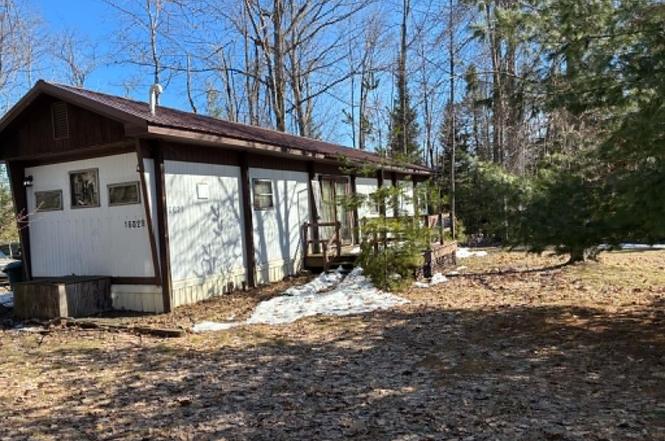
16029 Hiawatha Trl · Hillman, MI
Flood risk 1/10 · Minimal
- FEMA flood zone
- —
- Chance of flooding over 30 yrs
- 0.0%
- Est. flood insurance / yr
- —
Fire risk 4/10 · Minor
- Est. fire insurance / yr
- $784 – $1,456
Heat risk 1/10 · Minimal
- Hot days now (above 94°F)
- 7 days/yr
- Hot days in 30 yrs
- 13 days/yr
Wind risk 1/10 · Minimal
- Chance of severe wind over 30 yrs
- —
Air-quality risk 1/10 · Minimal
- Unhealthy air days now
- 0 days/yr
- Unhealthy air days in 30 yrs
- 0 days/yr
Risk factors via First Street. Map © Google.
Why this score? — see what drove the C- grade
The composite is a weighted blend of 9 inputs, each scored 0–100. Each bar is that input's sub-score; the figure is the points it added to the 100-point composite (weight × sub-score).
- Cash flow +15.0/30.0
- Appreciation +10.0/10.0
- ARV discount +7.5/15.0
- 1% rule +5.0/10.0
- DSCR +5.0/10.0
- Livability +3.1/5.0
- Schools +2.6/10.0
- Rent growth +2.5/5.0
- Condition / age +2.5/5.0
$19,900
🖨 Deal sheet (PDF) 📄 Offer letter ✓ Due diligence
Listing remarks
Tucked near state land, this 2-bedroom mobile home is the perfect up-north getaway. A roof-built-over design adds extra protection. Enjoy easy access to nearby trails for riding, outdoor adventures, and exploring Northern Michigan's natural beauty. Whether you're looking for a recreational base camp or a peaceful place to unwind, this property offers a great location close to nature and endless outdoor opportunities. All offers subject to court approval.
Key facts
- 0.92 acre lot
- Listed 10 days
Tags
Neighborhood map
What this means for you Summary
Snapshot
- This is a 2-bed/1.0-bath single-family listed at $20k.
Deal economics
- At list price, monthly cash flow is $763 ($9k/yr) — positive.
- The deal already cash-flows at list — no discount required.
- Meets the 1% rule at list price ($1k rent vs $20k).
Location & tenants
- Location reads 61/100 on livability (#575 in MI) — a middle-class / working-renter tenant base. Strengths: cost of living A+, housing A-; Watch: crime F, amenities F, commute F.
- Hillman Community Schools (rural): math 22% / reading 40% proficiency, ranked #361 of 540 in MI (top 67%) — families likely to look elsewhere, expect single-tenant / working-renter base with shorter leases.
- Zoned schools: Hillman Elementary School (math 17% / reading 27%, grade F, #1,035 of 1,397 statewide, top 77%, 187 students, 61% FRL); Hillman Community Jrsr High School (math 27% / reading 47%, grade F, #334 of 713 statewide, top 51%, 228 students, 50% FRL) — zoned schools at 55% FRL track the district average.
- Market conditions: 59 active listings in the ZIP.
Forward outlook
- In year one you build about $2k of equity ($138 loan paydown + $2k appreciation (10.0% local appreciation)).
- Montmorency County population projected at -38% by 2050 — secular population decline; favor cash flow + early exit over multi-decade hold.
- At projected returns (10.0% appreciation + 3.0% rent growth), your $6k cash investment doubles in ~1 year — after that, you're playing with house money.
Negotiation context
- Only 11 days on market — expect competitive offers; lowballing is unlikely to land.
- Current owner paid $14k; 37% above their basis — modest negotiation headroom, anchor on the comps not their cost.
Questions for the listing agent
- Is there a deadline driving the sale (1031 exchange, divorce, estate, relocation)? That informs how much negotiation room exists.
- Schools are F-rated, which usually means shorter tenancies and higher turnover. Who's the typical renter profile here, and what's been the actual vacancy rate?
- Crime grade is F in this area — have there been break-ins, vandalism, or insurance claims at this property in the last 3 years? What carrier currently insures it and at what premium?
- What's the average days-on-market for RENTAL listings here right now (not sales)? A rising rental-DOM trend means longer vacancies and softer asking-rent achievability than the comps imply.
- What's the recent tenant-quality profile in this submarket — average credit score on applications, eviction rate, late-payment / NSF rate, and stable-employment percentage? A property-management company in the area should have these aggregated.
- How much new for-sale + rental construction is in the pipeline within 1–3 miles? Heavy new supply typically softens prices + rents 12–24 months out; constrained supply supports both.
Investment metrics
- 1% rule
- 5.67% ✓
- Cap rate
- 52.29%
- Cash-on-cash
- 164.29%
- DSCR
- 8.31
- GRM
- 1.5
CMA / ARV
- ARV (median comp)
- $78,874
- List price
- $19,900
- Delta
- -74.77%
- Verdict
- UNDERPRICED
- Comps
- 6 within 1.0 mi
Show comp detail 1 sale within ~0.75 mi
| Address | Dist | Beds/Ba | Sqft | Sold | Price | $/sf | Match |
|---|---|---|---|---|---|---|---|
| 17870 Fourth St | 0.26mi | 2/1.0 | 750 (+12%) | 24mo | $77,000 | $103 | 49 |
Match score weights: distance 35% · size 25% · config 20% · recency 20%. Top-matched comps best support the ARV.
Projected returns pro-forma
10.0% appreciation · 3.0% rent growth · sell at horizon
- IRR
- —
- Equity multiple
- 11.67×
- Total profit
- $59,435
- Equity at exit
- $17,927
- IRR
- —
- Equity multiple
- 25.56×
- Total profit
- $136,841
- Equity at exit
- $38,661
Cash invested: $5,572 (down + closing). Projections, not guarantees.
Landlord ↔ Tenant lean methodology
- Overall (STATE)
- 62 Landlord-Friendly
- State Michigan
- 62 Landlord-Friendly · EVEN
- County
- — inherits STATE
- City
- — inherits STATE
ZIP-level market 49709
- Home prices YoY
- 13.5%
- Active inventory
- 59
- Price-to-rent
- 1.5×
Monthly cashflow live
- Estimated rent
- $1,128 medium interval (Pro) →
- Mortgage (P&I)
- −$104
- Tax from tax record
- −$15 /mo · $183/yr
- Insurance
- −$8
- HOA
- −$0
- Vacancy / Maint / Mgmt
- −$237
- Net cashflow
- $763
Break-even live
Sensitivity live
| Price | -10% $774 | -5% $768 | +0% $763 | +5% $757 | +10% $752 |
|---|---|---|---|---|---|
| Rent | -10% $674 | -5% $718 | +0% $763 | +5% $807 | +10% $852 |
| Rate | -1.0pp $773 | -0.5pp $768 | base $763 | +0.5pp $758 | +1.0pp $752 |
UW: 25.0% down · 7.5% · 30yr · 1.5% tax · 5.0% vac · 8.0% maint · 8.0% mgmt
Financing live
Cash to close
- Down payment
- $4,975
- Closing costs
- $597
- Reserves months
- —
- Total cash needed
- —
Loan-product check · same deal, 3 products live
Conventional
25% down · 7.5% · 30yr
- Down + closing
- —
- Monthly P&I
- —
- Monthly cashflow
- —
- DSCR
- —
- Eligible?
- —
Personal DTI + credit; lowest rate.
DSCR
20% down · 8.5% · 30yr
- Down + closing
- —
- Monthly P&I
- —
- Monthly cashflow
- —
- DSCR
- —
- Eligible?
- —
No personal income docs; deal must DSCR.
Hard money
10% down · 12.0% · 12mo
- Down + closing
- —
- Monthly P&I
- —
- Monthly cashflow
- —
- DSCR
- —
- Eligible?
- —
Short-term bridge; refi at stabilization.
Listing history 2 events
-
2026-05-14$19,900 Active 458-char remark
-
2017-09-25soldstatus $14,500
ⓘ Source: listings_history table (triggers on properties + properties_extension) + one-shot
backfill from property_details.listing_events for pre-trigger history.
Tax reassessment forecast MI · Partial reset (capped growth)
- Current annual tax
- $183 · $15/mo
- Projected year-2 tax
- $245 · $20/mo
- Expected delta
- +$62/yr (+$5/mo · 33.7%)
ⓘ Screening estimate from a state-policy table — verify with the county assessor before closing.
Climate risk First Street
- Flood 1/10 Low 0% chance over 30 yrs
- Wildfire 4/10 Moderate
- Heat 1/10 Low 7 d/yr ≥94°F today · 13 d/yr by 30 yrs out
- Wind 1/10 Low
- Air quality 1/10 Low 0 unhealthy d/yr today · 0 by 30 yrs out
Nearby sold comps map
Loading sold comps map…
Walkable amenities ~0.75 mi
Loading nearby amenities…
Taxation est. · year 1
- Rental income
- $13,530
- − Mortgage interest
- −$1,115
- − Property taxes
- −$183
- − Insurance
- −$100
- − Repairs & maintenance
- −$1,082
- − Management
- −$1,082
- − Depreciation
- −$579
- Taxable income
- $9,389
- Est. tax owed @ 24.0%
- −$2,253
- After-tax cash flow
- $6,901/yr
For passive investors: Depreciation is non-cash, so a rental often shows a tax loss while cash-flowing — sheltering income. Rental losses are passive: they offset passive income freely, and up to $25,000/yr can offset ordinary (W-2) income if you actively participate and your MAGI is under $100k (phasing out to $0 by $150k); unused losses carry forward. On sale, claimed depreciation is recaptured at up to 25%, and gains may owe capital-gains tax (a 1031 exchange can defer both). Figures are a year-1 estimate at your 24.0% rate — not tax advice; consult a CPA.
Schools (NCES district)
- District
- Hillman Community Schools
- NCES district ID
- 2618360
- Math proficiency
- 22% ▬ 0.00%
- Reading proficiency
- 40% ▲ 3.00%
- Median HH income
- $37,668
- Composite
- 25.78/100
- National rank
- #7368
- State rank
- #361 of 540 in MI
Livability — Hillman
- Score
- 61/100
- State rank
- #575
- US rank
- #18368
Category grades
Schools grade is shown separately in the Schools card above.
Census & demographics
- Population (ZIP)
- 3,524
Population outlook (Montmorency County) Hauer SSP2
- Today (2025)
- 8,233 people
- By 2030
- 7,575 · -8.0%
- By 2040
- 6,202 · -24.7%
- By 2050
- 5,081 · -38.3%
- By 2075
- 3,119 · -62.1%
- By 2100
- 1,923 · -76.6%
Race, ethnicity, and origin ACS 2023
- Neighborhood character
- Predominantly White (94%)
- Race & ethnicity
- White 94% Two or more races 4% Hispanic / Latino 2%
- Common ancestry
- Romanian 11% Lithuanian 7% Slovak 6%
- Foreign-born
- 1% · Canada
- Languages at home
- 98% English-only · Other Asian/Pacific 1% Spanish 1%
Political lean MEDSL · Montmorency
- 2024 margin
- Solid R (+45.3) · D 26.6% · R 72.0% · Other 1.4%
- 2008→2024 swing
- -37.2pp toward R · 2008: -8.2pp · 2024: -45.3pp
- All cycles
- 2024: R+45.3 2020: R+43.4 2016: R+44.2 2012: R+17.4 2008: R+8.2
Not yet ingested
- Civics
- —
Market trends
- HPI YoY
- ▲ 42.88%
- Current HPI
- 361.3052
- Rent YoY
- —
- Metro
- —
- State GDP YoY
- ▲ 1.37%
- F500 in state
- 28
Industry mix (Fortune 500 HQ in MI)
| Industry | F500 HQs | Revenue |
|---|---|---|
| Automotive Parts | 3 | $48B |
|
||
| Automotive | 2 | $372B |
|
||
| Chemicals | 1 | $45B |
|
||
| Automotive Retail | 1 | $29B |
|
||
| Healthcare / Medical Devices | 1 | $23B |
|
||
| Automotive Technology | 1 | $20B |
|
||
Price history
1 event — show timeline
- 2017-09-25 Sold (Public Records) $14,500 Public Records
Property tax history
-1.1%/yrLatest (2024): $183 · -64.0% YoY. Source: county tax records.
Cash-flow waterfall
monthlySold comps — $/sqft
last 12 mo · ≤1 miLoading sold comps…