8171 Denwood Dr Unit K-3 · Sterling Heights, MI
Flood risk 1/10 · Minimal
- FEMA flood zone
- X (unshaded)
- Chance of flooding over 30 yrs
- 0.0%
- Est. flood insurance / yr
- $473 – $860
Fire risk 1/10 · Minimal
- Est. fire insurance / yr
- $784 – $1,456
Heat risk 3/10 · Minor
- Hot days now (above 97°F)
- 7 days/yr
- Hot days in 30 yrs
- 15 days/yr
Wind risk 1/10 · Minimal
- Chance of severe wind over 30 yrs
- —
Air-quality risk 3/10 · Minor
- Unhealthy air days now
- 3 days/yr
- Unhealthy air days in 30 yrs
- 4 days/yr
Risk factors via First Street. Map © Google.
Why this score? — see what drove the C- grade
The composite is a weighted blend of 9 inputs, each scored 0–100. Each bar is that input's sub-score; the figure is the points it added to the 100-point composite (weight × sub-score).
- Cash flow +19.6/30.0
- 1% rule +9.0/10.0
- ARV discount +7.5/15.0
- DSCR +6.2/10.0
- Livability +3.7/5.0
- Rent growth +2.5/5.0
- Schools +2.5/10.0
- Condition / age +2.5/5.0
- Appreciation +0.0/10.0
$85,000
🖨 Deal sheet 📄 Offer letter ✓ Due diligence
Listing remarks MLS
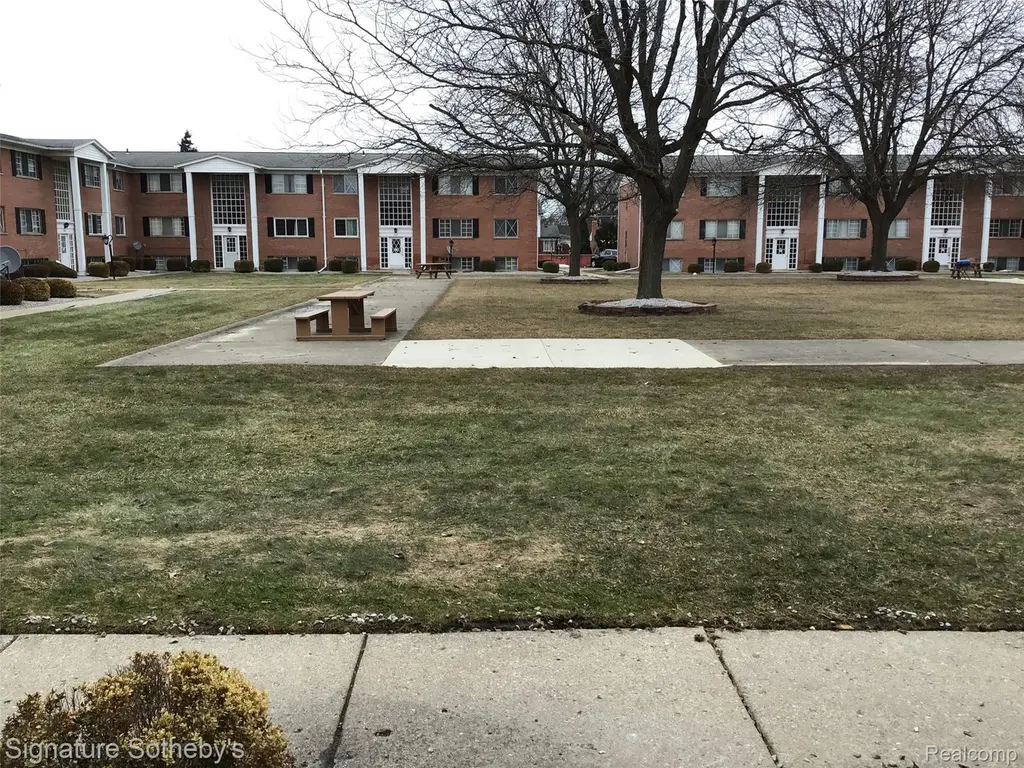
Well maintained UPPER Level condo with new carpet, pool, and a view of the courtyard. Condo located minutes from shopping, restaurants and medical facilities. Shared basement with storage, Washer & Dryer. Subject to Probate Court final approval (the property has already gone through the court process)
Key facts
- Storage
- Washer and dryer
- Shared basement
Tags
Property features AI
Finance
- Other: Subdivision: SOMERSET SQUARE; Directions: Van Dyke & Crestview; Cross street: Van Dyke & Crestview
- HOA & community: Homeowners association with a monthly fee of $221
Exterior
- Parking: No garage
- Utilities: Public water; Public sewer
- Home design: Condominium; Residential property; One level; Upper-level entry with steps; Brick exterior
- Construction: Brick construction; Brick/mortar foundation; Built with shingle roof not specified
- Exterior features: Paved road access; Sidewalks in the community; Pets not allowed
Interior
- Kitchen: Dishwasher; Free-standing gas range; Free-standing refrigerator; Microwave
- Bathrooms: 1 full bathroom
- Heating & cooling: Central air conditioning; Forced air heating (natural gas)
- Interior features: Dishwasher; Free-standing gas range; Free-standing refrigerator; Microwave; Unfinished basement; Common area laundry
- Laundry & utility: Common area laundry
Neighborhood map
What this means for you Summary
Snapshot
- This is a 1-bed/1.0-bath condo listed at $85k.
Deal economics
- At list price, monthly cash flow is $99 ($1k/yr) — positive.
- The deal already cash-flows at list — no discount required.
- Meets the 1% rule at list price ($1k rent vs $85k).
- Cap rate 7.7% vs local median 3.8% in Sterling Heights — top-decile yield for the area; either an underpriced asset or a hidden risk that comps aren't pricing in. Stress-test before assuming the spread holds.
Location & tenants
- Location reads 74/100 on livability (#173 in MI, #4,545 nationally) — a middle-class / working-renter tenant base. Strengths: commute A+, cost of living A+, housing A+; Watch: schools C-, health & safety D+, amenities F.
- Warren Consolidated Schools (urban): math 18% / reading 39% proficiency, ranked #373 of 540 in MI (top 69%) — low school quality limits family demand, transient renter base, plan for 1-2y turnover.
- Market conditions: 159 active listings in the ZIP; 8 comparable units currently listed for rent nearby; rentals leasing fast (median 3d on market — plan ~1-2 weeks tenant-placement turnaround); 1,321 units permitted in Macomb County in 2024 (86 in 5+ unit buildings).
Forward outlook
- Local home prices are declining (-3.0%/yr); year-one equity from $588 of loan paydown is wiped out by about $3k of value loss. Plan a longer hold.
- Macomb County population projected at +9% by 2050 — modest demand growth; plan on rents tracking national, not racing it.
Negotiation context
- Only 14 days on market — expect competitive offers; lowballing is unlikely to land.
- 4 sale attempts since 2y ago with the ask held roughly flat each time — persistent listings suggest the price (not the market) is what's stuck; bring a comps-based counter.
Questions for the listing agent
- Built in 1965 — when were the roof, HVAC, electrical panel, plumbing, and water heater last replaced?
- What does the HOA fee cover, when was the last increase, and are there any pending special assessments or reserve-fund shortfalls?
- Any open or pending special assessments — roof, HVAC, plumbing, elevator, façade? What's the per-unit balance and payoff schedule, and is the seller paying it off at close or rolling it to the buyer?
- Is there a deadline driving the sale (1031 exchange, divorce, estate, relocation)? That informs how much negotiation room exists.
- What's the average days-on-market for RENTAL listings here right now (not sales)? A rising rental-DOM trend means longer vacancies and softer asking-rent achievability than the comps imply.
- What's the recent tenant-quality profile in this submarket — average credit score on applications, eviction rate, late-payment / NSF rate, and stable-employment percentage? A property-management company in the area should have these aggregated.
- How much new apartment / multifamily construction is in the pipeline within 1–3 miles? Heavy new supply (>2% of stock underway) typically softens rents 12–24 months out; light construction supports rent growth.
Investment metrics
- 1% rule
- 1.40% ✓
- Cap rate
- 7.69%
- Cash-on-cash
- 4.98%
- DSCR
- 1.22
- GRM
- 6.0
CMA / ARV
No comps found within radius.
Projected returns pro-forma
-3.0% appreciation · 3.0% rent growth · sell at horizon
- IRR
- -8.3%
- Equity multiple
- 0.69×
- Total profit
- $-7,310
- Equity at exit
- $12,674
- IRR
- 1.4%
- Equity multiple
- 1.10×
- Total profit
- $2,435
- Equity at exit
- $7,349
Cash invested: $23,800 (down + closing). Projections, not guarantees.
Landlord ↔ Tenant lean methodology
- Overall (STATE)
- 62 Landlord-Friendly
- State Michigan
- 62 Landlord-Friendly · EVEN
- County
- — inherits STATE
- City
- — inherits STATE
ZIP-level market 48312
- Active inventory
- 159
- Price-to-rent
- 6.0×
Monthly cashflow live
- Estimated rent
- $1,187 high interval (Pro) →
- Mortgage (P&I)
- −$446
- Tax from tax record
- −$137 /mo · $1,642/yr
- Insurance
- −$35
- HOA
- −$221
- Vacancy / Maint / Mgmt
- −$249
- Net cashflow
- $99
Break-even live
UW: 25.0% down · 7.5% · 30yr · 1.5% tax · 5.0% vac · 8.0% maint · 8.0% mgmt
Financing live
Cash to close
- Down payment
- $21,250
- Closing costs
- $2,550
- Reserves months
- —
- Total cash needed
- —
Loan-product check · same deal, 3 products live
Conventional
25% down · 7.5% · 30yr
- Down + closing
- —
- Monthly P&I
- —
- Monthly cashflow
- —
- DSCR
- —
- Eligible?
- —
Personal DTI + credit; lowest rate.
DSCR
20% down · 8.5% · 30yr
- Down + closing
- —
- Monthly P&I
- —
- Monthly cashflow
- —
- DSCR
- —
- Eligible?
- —
No personal income docs; deal must DSCR.
Hard money
10% down · 12.0% · 12mo
- Down + closing
- —
- Monthly P&I
- —
- Monthly cashflow
- —
- DSCR
- —
- Eligible?
- —
Short-term bridge; refi at stabilization.
Rent comps 8 comps
| Address | Beds | Baths | Sqft | Rent | $/sqft | DOM | Units | Dist |
|---|---|---|---|---|---|---|---|---|
| 8100 Denwood Dr Sterling Heights, MI | 1.0 | 1.0 | 525 | $1,000 | $1.90 | 14d | 1 | 0.10mi |
| 34911 Van Dyke Ave Sterling Heights, MI | 1.0 | 1.0–2.0 | 800 | $1,300 | $1.62 | 43d | 1 | 0.57mi |
| 8600 Beech Dr Sterling Heights, MI | 1.0–2.0 | 1.0 | 900 | $990 | $1.10 | 2d | 6 | 0.59mi |
| 11221 14 Mile Rd Sterling Heights, MI | 1.0–2.0 | 1.0–2.0 | 818 | $1,275 | $1.56 | 2d | 6 | 0.65mi |
| 8484 Brougham Dr Sterling Heights, MI | 1.0–3.0 | 1.0–2.0 | 857 | $1,595 | $1.86 | 1d | 26 | 1.00mi |
| 5800 Streefkerk Dr Warren, MI | 1.0 | 1.0 | 560 | $877 | $1.57 | 2d | 2 | 1.28mi |
| 31727 Hoover Rd Unit 21 Warren, MI | 2.0 | 1.0 | 900 | $1,395 | $1.55 | 4d | 1 | 1.34mi |
| 5924 Chicago Rd Warren, MI | 1.0 | 1.0 | 1000 | $1,500 | $1.50 | 3d | 1 | 1.43mi |
HOA detail condo
- Monthly dues
- $221 · $2,652/yr
- Likely covers
- pool
- Assessments
- None detected in remarks — confirm with the listing agent.
Listing history 10 events
-
2026-06-18days on market $85,000 Active 14 DOM
-
2026-06-17days on market $85,000 Active 13 DOM
-
2026-06-16days on market $85,000 Active 12 DOM
-
2026-06-15days on market $85,000 Active 11 DOM
-
2026-06-13days on market $85,000 Active 9 DOM
-
2026-06-09days on market $85,000 Active 5 DOM
-
2026-06-08days on market $85,000 Active 4 DOM
-
2026-06-07days on market $85,000 Active 3 DOM
-
2026-06-04remarks 304-char remark
Show marketing remark (308 chars)
Well maintained UPPER Level condo with new carpet, pool, and a view of the courtyard. Condo located minutes from shopping, restaurants and medical facilities. Shared basement with storage, Washer & Dryer. Subject to Probate Court final approval (the property has already gone through the court process)
-
2026-06-04$85,000 Active 1 DOM
Show marketing remark (308 chars)
Well maintained UPPER Level condo with new carpet, pool, and a view of the courtyard. Condo located minutes from shopping, restaurants and medical facilities. Shared basement with storage, Washer & Dryer. Subject to Probate Court final approval (the property has already gone through the court process)
ⓘ Source: listings_history table (triggers on properties + properties_extension) + one-shot
backfill from property_details.listing_events for pre-trigger history.
Tax reassessment forecast MI · Partial reset (capped growth)
- Current annual tax
- $1,642 · $137/mo
- Projected year-2 tax
- $1,642 · $137/mo
- Expected delta
- $0/yr ($0/mo · 0.0%)
ⓘ Screening estimate from a state-policy table — verify with the county assessor before closing.
Climate risk First Street
- Flood 1/10 Low FEMA zone X (unshaded) · 0% chance over 30 yrs
- Wildfire 1/10 Low
- Heat 3/10 Moderate 7 d/yr ≥97°F today · 15 d/yr by 30 yrs out
- Wind 1/10 Low
- Air quality 3/10 Moderate 3 unhealthy d/yr today · 4 by 30 yrs out
Nearby sold comps map
Loading sold comps map…
Walkable amenities ~0.75 mi
Loading nearby amenities…
Taxation est. · year 1
- Rental income
- $14,244
- − Mortgage interest
- −$4,761
- − Property taxes
- −$1,642
- − Insurance
- −$425
- − Repairs & maintenance
- −$1,140
- − Management
- −$1,140
- − HOA
- −$2,652
- − Depreciation
- −$2,473
- Taxable income
- $12
- Est. tax owed @ 24.0%
- −$3
- After-tax cash flow
- $1,182/yr
For passive investors: Depreciation is non-cash, so a rental often shows a tax loss while cash-flowing — sheltering income. Rental losses are passive: they offset passive income freely, and up to $25,000/yr can offset ordinary (W-2) income if you actively participate and your MAGI is under $100k (phasing out to $0 by $150k); unused losses carry forward. On sale, claimed depreciation is recaptured at up to 25%, and gains may owe capital-gains tax (a 1031 exchange can defer both). Figures are a year-1 estimate at your 24.0% rate — not tax advice; consult a CPA.
Schools (NCES district)
- District
- Warren Consolidated Schools
- NCES district ID
- 2635190
- Math proficiency
- 18% ▼ -14.00%
- Reading proficiency
- 39% ▼ -8.00%
- Median HH income
- $52,259
- Composite
- 25.09/100
- National rank
- #7533
- State rank
- #373 of 540 in MI
Livability — Sterling Heights
- Score
- 74/100
- State rank
- #173
- US rank
- #4545
Category grades
Schools grade is shown separately in the Schools card above.
Census & demographics
- Census place
- Sterling Heights, MI
- County
- Macomb County · 638,552 people
- City population
- 133,573
- Metro
- Detroit-Warren-Dearborn, MI
- Population (ZIP)
- 34,401
- Household income
- $68,061
- Rent vs Own
- Severe rent burden
- 910.0
Population outlook (Macomb County) Hauer SSP2
- Today (2025)
- 925,296 people
- By 2030
- 948,226 · +2.5%
- By 2040
- 983,961 · +6.3%
- By 2050
- 1,010,200 · +9.2%
- By 2075
- 1,076,222 · +16.3%
- By 2100
- 1,077,065 · +16.4%
Race, ethnicity, and origin ACS 2023
- Neighborhood character
- Predominantly White (75%)
- Race & ethnicity
- White 75% Black 9% Asian 9% Two or more races 5% Hispanic / Latino 3%
- Common ancestry
- Romanian 14% Arab 3% Lithuanian 2%
- Foreign-born
- 25% · Canada, China, Vietnam
- Languages at home
- 66% English-only · Other Indo-European 8% Arabic 8% Russian/Polish/Slavic 3%
Political lean MEDSL · Macomb
- 2024 margin
- R (+13.7) · D 42.2% · R 55.9% · Other 1.9%
- 2008→2024 swing
- -22.3pp toward R · 2008: 8.6pp · 2024: -13.7pp
- All cycles
- 2024: R+13.7 2020: R+8.1 2016: R+11.6 2012: D+4.0 2008: D+8.6
Not yet ingested
- Civics
- —
Market trends
- HPI YoY
- ▼ -279.41%
- Current HPI
- 203.3039
- Rent YoY
- —
- Metro
- Detroit-Warren-Dearborn, MI
- State GDP YoY
- ▲ 1.37%
- F500 in state
- 28
Industry mix (Fortune 500 HQ in MI)
| Industry | F500 HQs | Revenue |
|---|---|---|
| Automotive Parts | 3 | $48B |
|
||
| Automotive | 2 | $372B |
|
||
| Chemicals | 1 | $45B |
|
||
| Automotive Retail | 1 | $29B |
|
||
| Healthcare / Medical Devices | 1 | $23B |
|
||
| Automotive Technology | 1 | $20B |
|
||
Price history
+178.7% since first listed15 events — show timeline
- 2026-06-04 Listed $85,000 MiRealSource-MiMLS
- 2026-06-04 Listed $85,000 REALCOMP
- 2024-09-19 Sold (Public Records) $78,000 Public Records
- 2024-09-13 Sold (MLS) $78,000 MiRealSource-MiMLS
- 2024-09-13 Sold (MLS) $78,000 REALCOMP
- 2024-08-27 Pending — MiRealSource-MiMLS
- 2024-08-27 Pending — REALCOMP
- 2024-08-03 Price Changed $80,000 MiRealSource-MiMLS
- 2024-08-03 Price Changed $80,000 REALCOMP
- 2024-07-31 Price Changed $85,000 MiRealSource-MiMLS
- 2024-07-31 Price Changed $85,000 REALCOMP
- 2024-07-23 Listed $89,000 MiRealSource-MiMLS
- 2024-07-23 Listed $89,000 REALCOMP
- 2021-09-22 Sold (Public Records) $60,000 Public Records
- 1994-12-30 Sold (Public Records) $30,500 Public Records
Property tax history
+9.3%/yrLatest (2025): $1,642 · +18.9% YoY. Source: county tax records.
Cash-flow waterfall
monthlySold comps — $/sqft
last 12 mo · ≤1 miLoading sold comps…