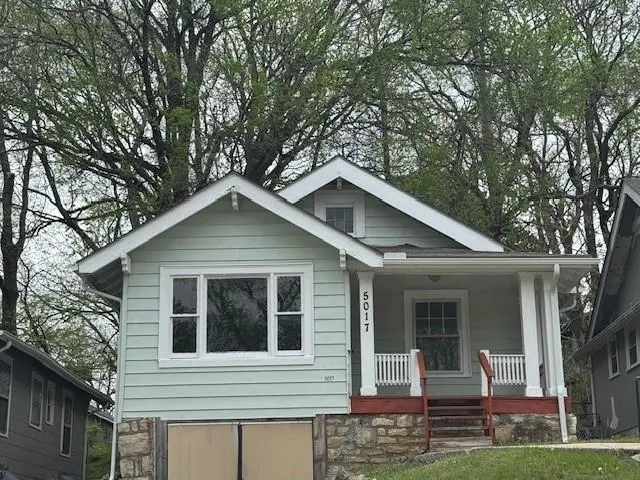
5017 Michigan Ave · Kansas City, MO
Flood risk 1/10 · Minimal
- FEMA flood zone
- X (unshaded)
- Chance of flooding over 30 yrs
- 0.0%
- Est. flood insurance / yr
- $473 – $860
Fire risk 1/10 · Minimal
- Est. fire insurance / yr
- $1,054 – $1,958
Heat risk 4/10 · Minor
- Hot days now (above 106°F)
- 7 days/yr
- Hot days in 30 yrs
- 17 days/yr
Wind risk 2/10 · Minimal
- Chance of severe wind over 30 yrs
- —
Air-quality risk 3/10 · Minor
- Unhealthy air days now
- 2 days/yr
- Unhealthy air days in 30 yrs
- 4 days/yr
Risk factors via First Street. Map © Google.
Why this score? — see what drove the C grade
The composite is a weighted blend of 9 inputs, each scored 0–100. Each bar is that input's sub-score; the figure is the points it added to the 100-point composite (weight × sub-score).
- Cash flow +23.6/30.0
- ARV discount +11.7/15.0
- DSCR +7.6/10.0
- 1% rule +4.9/10.0
- Livability +3.9/5.0
- Rent growth +3.6/5.0
- Condition / age +2.5/5.0
- Schools +1.5/10.0
- Appreciation +0.0/10.0
$122,000
🖨 Deal sheet 📄 Offer letter ✓ Due diligence
Listing remarks MLS
Charming and affordable! This 2-bedroom, 1-bath home features beautiful original wood floors that add warmth and character throughout. The spacious layout includes a full loft upstairs, perfect for a third bedroom, home office, den, or study to fit your needs. Enjoy the convenience of a one-car garage and an unfinished basement, offering plenty of storage or future expansion potential. Located in an urban core neighborhood, this home is just steps from the bus line and close to everything you need for easy living. Seller will consider, all mortgage types, this is an incredible opportunity for homeowners or investors alike. Don’t miss your chance to make this home yours!
Key facts
- One car garage
- Steps from bus line
- Unfinished basement
Tags
Neighborhood map
What this means for you Summary
Snapshot
- This is a 2-bed/1.0-bath single-family listed at $122k.
Deal economics
- At list price, monthly cash flow is $231 ($3k/yr) — positive.
- The deal already cash-flows at list — no discount required.
- To meet the 1% rule (rent ≥ 1% of price), the offer needs to be $120k (1.5% below list).
- Recommended offer: $115k (6.0% below list) — sets the bar for market timing.
- Cap rate 8.6% vs local median 3.9% in Kansas City — top-decile yield for the area; either an underpriced asset or a hidden risk that comps aren't pricing in. Stress-test before assuming the spread holds.
Location & tenants
- Location reads 78/100 on livability (#28 in MO, #2,671 nationally) — a middle-class / working-renter tenant base. Strengths: amenities A+, commute A+, cost of living A+; Watch: schools C-, crime F.
- Kansas City 33 (urban): math 12% / reading 24% proficiency, ranked #308 of 324 in MO (top 95%) — low school quality limits family demand, transient renter base, plan for 1-2y turnover; 75% free/reduced lunch — lower-income household profile, screen leases tightly.
- Market conditions: Rents rising fast (+4.4%/yr); 187 active listings in the ZIP; 40 comparable units currently listed for rent nearby; rentals at typical pace (median 20d on market — plan ~3-4 weeks tenant-placement turnaround); lower-income renter base — watch delinquency; 4,002 units permitted in Jackson County in 2024 (2,271 in 5+ unit buildings).
- This rent runs 34% of the median local income ($42k/yr) — at the standard rent-burdened threshold; future hikes will face affordability resistance.
Forward outlook
- Local home prices are declining (-3.0%/yr); year-one equity from $843 of loan paydown is wiped out by about $4k of value loss. Plan a longer hold.
- Jackson County population projected at +4% by 2050 — modest demand growth; plan on rents tracking national, not racing it.
Negotiation context
- It's been on market 61 days — a 6% lower offer ($115k) is reasonable based on typical stale-listing flexibility.
- 2 sale attempts since 11y ago; this cycle's ask has dropped $8k (6%) from the opening price — seller is motivated, your offer sets the floor, not the list.
Risks & watch-outs
- Watch-outs: built in 1924 — expect roof / HVAC / electrical / plumbing capex.
Questions for the listing agent
- It's been on market 61 days. Have you received any prior offers? Is the seller open to a 6% concession, seller financing, or rate buy-down credit?
- Built in 1924 — when were the roof, HVAC, electrical panel, plumbing, and water heater last replaced?
- Why hasn't it sold? Are there any deal-killer items the seller is aware of (foundation, flood, title, zoning, code violations)?
- Is there a deadline driving the sale (1031 exchange, divorce, estate, relocation)? That informs how much negotiation room exists.
- Crime grade is F in this area — have there been break-ins, vandalism, or insurance claims at this property in the last 3 years? What carrier currently insures it and at what premium?
- What's the average days-on-market for RENTAL listings here right now (not sales)? A rising rental-DOM trend means longer vacancies and softer asking-rent achievability than the comps imply.
- What's the recent tenant-quality profile in this submarket — average credit score on applications, eviction rate, late-payment / NSF rate, and stable-employment percentage? A property-management company in the area should have these aggregated.
- How much new for-sale + rental construction is in the pipeline within 1–3 miles? Heavy new supply typically softens prices + rents 12–24 months out; constrained supply supports both.
Investment metrics
- 1% rule
- 0.99% ✗
- Cap rate
- 8.57%
- Cash-on-cash
- 8.12%
- DSCR
- 1.36
- GRM
- 8.5
CMA / ARV
- ARV (median comp)
- $134,657
- List price
- $122,000
- Delta
- -9.40%
- Verdict
- FAIR
- Comps
- 20 within 1.0 mi
Show comp detail 12 sales within ~0.75 mi
| Address | Dist | Beds/Ba | Sqft | Sold | Price | $/sf | Match |
|---|---|---|---|---|---|---|---|
| 1537 E 50th St | 0.15mi | 2/1.0 | 910 (+6%) | 7mo | $110,000 | $121 | 77 |
| 1508 E 49th Ter | 0.25mi | 2/1.0 | 916 (+6%) | 4mo | $90,000 | $98 | 74 |
| 5001 Troostwood Rd | 0.43mi | 2/1.0 | 901 (+5%) | 3mo | $253,000 | $281 | 70 |
| 5114 Michigan Ave | 0.12mi | 3/1.0 (+1) | 965 (+12%) | 2mo | $94,900 | $98 | 67 |
| 5132 Wabash Ave | 0.38mi | 2/1.0 | 783 (-9%) | 2mo | $139,000 | $178 | 66 |
| 5507 Park Ave | 0.66mi | 2/1.0 | 874 (+2%) | 5mo | $94,900 | $109 | 62 |
| 5306 Olive St | 0.46mi | 2/1.0 | 946 (+10%) | 0mo | $154,900 | $164 | 62 |
| 5400 Paseo Blvd | 0.54mi | 3/2.0 (+1) | 864 (+0%) | 4mo | $159,000 | $184 | 62 |
| 5415 Highland Ave | 0.52mi | 2/1.0 | 928 (+8%) | 1mo | $129,900 | $140 | 61 |
| 4909 S Benton Ave | 0.64mi | 2/1.0 | 821 (-4%) | 5mo | $75,000 | $91 | 58 |
| 4824 Agnes Ave | 0.69mi | 2/1.0 | 792 (-8%) | 4mo | $79,000 | $100 | 51 |
| 1406 E 45th St | 0.74mi | 3/1.0 (+1) | 928 (+8%) | 0mo | $129,000 | $139 | 47 |
Match score weights: distance 35% · size 25% · config 20% · recency 20%. Top-matched comps best support the ARV.
Projected returns pro-forma
-3.0% appreciation · 4.42% rent growth · sell at horizon
- IRR
- -2.6%
- Equity multiple
- 0.90×
- Total profit
- $-3,372
- Equity at exit
- $18,191
- IRR
- 8.4%
- Equity multiple
- 1.68×
- Total profit
- $23,130
- Equity at exit
- $10,548
Cash invested: $34,160 (down + closing). Projections, not guarantees.
Landlord ↔ Tenant lean methodology
- Overall (STATE)
- 81 Strongly Landlord-Friendly
- State Missouri
- 81 Strongly Landlord-Friendly · R+10
- County
- — inherits STATE
- City
- — inherits STATE
ZIP-level market 64130
- Home prices YoY
- -21.5%
- Rents YoY
- 4.4%
- Active inventory
- 187
- Price-to-rent
- 8.5×
Monthly cashflow live
- Estimated rent
- $1,202 high interval (Pro) →
- Mortgage (P&I)
- −$640
- Tax from tax record
- −$28 /mo · $337/yr
- Insurance
- −$51
- HOA
- −$0
- Vacancy / Maint / Mgmt
- −$252
- Net cashflow
- $231
Break-even live
UW: 25.0% down · 7.5% · 30yr · 1.5% tax · 5.0% vac · 8.0% maint · 8.0% mgmt
Financing live
Cash to close
- Down payment
- $30,500
- Closing costs
- $3,660
- Reserves months
- —
- Total cash needed
- —
Loan-product check · same deal, 3 products live
Conventional
25% down · 7.5% · 30yr
- Down + closing
- —
- Monthly P&I
- —
- Monthly cashflow
- —
- DSCR
- —
- Eligible?
- —
Personal DTI + credit; lowest rate.
DSCR
20% down · 8.5% · 30yr
- Down + closing
- —
- Monthly P&I
- —
- Monthly cashflow
- —
- DSCR
- —
- Eligible?
- —
No personal income docs; deal must DSCR.
Hard money
10% down · 12.0% · 12mo
- Down + closing
- —
- Monthly P&I
- —
- Monthly cashflow
- —
- DSCR
- —
- Eligible?
- —
Short-term bridge; refi at stabilization.
Rent comps 40 comps
| Address | Beds | Baths | Sqft | Rent | $/sqft | DOM | Units | Dist |
|---|---|---|---|---|---|---|---|---|
| 5114 Brooklyn Ave Kansas City, MO | 3.0 | 1.5 | 1116 | $1,300 | $1.16 | 7d | 1 | 0.21mi |
| 4930 Park Ave Kansas City, MO | 3.0 | 1.0 | 900 | $1,300 | $1.44 | 16d | 1 | 0.26mi |
| 4818 The Paseo Unit 2N Kansas City, MO | 1.0 | 1.0 | 526 | $945 | $1.80 | 16d | 1 | 0.40mi |
| 4818 The Paseo Unit 2N Kansas City, MO | 1.0 | 1.0 | 526 | $995 | $1.89 | 23d | 1 | 0.40mi |
| 4818 The Paseo Unit 3S Kansas City, MO | 1.0 | 1.0 | 526 | $895 | $1.70 | 23d | 1 | 0.40mi |
| 4818 Paseo Blvd Kansas City, MO | 1.0 | 1.0 | 526 | $945 | $1.80 | 11d | 10 | 0.40mi |
| 4818 Paseo Blvd Kansas City, MO | 1.0 | 1.0 | 526 | $945 | $1.80 | 3d | 8 | 0.40mi |
| 4818 Paseo Blvd Unit 1W Kansas City, MO | 1.0 | 1.0 | 526 | $945 | $1.80 | 23d | 1 | 0.40mi |
| 5332 Highland Ave Kansas City, MO | 3.0 | 1.0 | 1022 | $1,350 | $1.32 | 7d | 1 | 0.42mi |
| 1320 E 49th St Kansas City, MO | 1.0 | 1.0 | 550 | $1,000 | $1.82 | 3d | 2 | 0.42mi |
| 4925 Tracy Ave Unit 1 Kansas City, MO | 2.0 | 1.0 | 1000 | $1,400 | $1.40 | 43d | 1 | 0.43mi |
| 5410 Euclid Ave Kansas City, MO | 3.0 | 2.0 | 1119 | $1,395 | $1.25 | 43d | 1 | 0.47mi |
| 1500 E 46th St Kansas City, MO | 1.0–3.0 | 1.0 | 803 | $1,050 | $1.31 | 43d | 1 | 0.61mi |
| 5529 Michigan Ave Kansas City, MO | 2.0 | 1.0 | 847 | $995 | $1.17 | 43d | 1 | 0.64mi |
| 5013 S Benton Ave Kansas City, MO | 3.0 | 1.0 | 978 | $1,225 | $1.25 | 23d | 1 | 0.65mi |
| 4917 S Benton Ave Kansas City, MO | 2.0 | 1.0 | 1000 | $1,100 | $1.10 | 23d | 1 | 0.66mi |
| 4911 S Benton Ave Kansas City, MO | 2.0 | 1.0 | 1000 | $1,100 | $1.10 | 17d | 1 | 0.66mi |
| 1214 Brush Creek Blvd Unit 03 Kansas City, MO | 2.0 | 1.0 | 950 | $1,050 | $1.11 | 17d | 1 | 0.74mi |
| 3017 E 51st St Kansas City, MO | 2.0 | 1.0 | 621 | $1,303 | $2.10 | 7d | 1 | 0.74mi |
| 5405 Harrison St Unit 2F Kansas City, MO | 2.0 | 1.0 | 1025 | $1,295 | $1.26 | 20d | 1 | 0.76mi |
| 5405 Harrison St Unit 2F Kansas City, MO | 2.0 | 1.0 | 1025 | $1,295 | $1.26 | 16d | 1 | 0.76mi |
| 5405 Harrison St Kansas City, MO | 2.0 | 1.0 | 1025 | $1,295 | $1.26 | 16d | 1 | 0.76mi |
| 5407 Harrison St Unit 1F Kansas City, MO | 2.0 | 1.0 | 1025 | $1,195 | $1.17 | 43d | 1 | 0.76mi |
| 5409 Harrison St Unit 5411 Kansas City, MO | 2.0 | 1.0 | 900 | $1,199 | $1.33 | 23d | 1 | 0.76mi |
| 5411 Harrison St Unit 1F Kansas City, MO | 2.0 | 1.0 | 900 | $1,199 | $1.33 | 23d | 1 | 0.76mi |
| 4401 Wayne Ave Kansas City, MO | 2.0 | 1.5 | 955 | $1,300 | $1.36 | 23d | 1 | 0.82mi |
| 5436 Harrison St Unit 1F Kansas City, MO | 2.0 | 1.0 | 1050 | $1,195 | $1.14 | 43d | 1 | 0.83mi |
| 5702 Euclid Ave Kansas City, MO | 2.0 | 1.0 | 683 | $1,000 | $1.46 | 43d | 1 | 0.83mi |
| 5446 Harrison St Unit 2F Kansas City, MO | 2.0 | 1.0 | 960 | $1,099 | $1.14 | 14d | 1 | 0.84mi |
| 4534 S Benton Ave Kansas City, MO | 2.0 | 1.0 | 912 | $1,045 | $1.15 | 16d | 1 | 0.85mi |
| 5335 Holmes St Unit 2F Kansas City, MO | 2.0 | 1.0 | 960 | $1,295 | $1.35 | 23d | 1 | 0.89mi |
| 5335 Holmes St Unit 2F Kansas City, MO | 2.0 | 1.0 | 960 | $1,295 | $1.35 | 16d | 1 | 0.89mi |
| 5713 Brooklyn Ave Kansas City, MO | 2.0 | 1.0 | 600 | $1,200 | $2.00 | 7d | 1 | 0.89mi |
| 5424 Charlotte St Kansas City, MO | 2.0 | 1.0 | 958 | $1,395 | $1.46 | 20d | 1 | 0.90mi |
| 5424 Charlotte St Kansas City, MO | 2.0 | 1.0 | 958 | $1,395 | $1.46 | 16d | 1 | 0.90mi |
| 5730 Garfield Ave Kansas City, MO | 3.0 | 1.0 | 866 | $1,195 | $1.38 | 16d | 1 | 0.91mi |
| 2100 E 58th St Kansas City, MO | 2.0 | 1.0 | 1030 | $1,500 | $1.46 | 43d | 1 | 0.93mi |
| 3315 E 52nd St Kansas City, MO | 2.0 | 1.0 | 662 | $1,125 | $1.70 | 23d | 1 | 0.96mi |
| 4427 Agnes Ave Kansas City, MO | 3.0 | 1.0 | 1100 | $1,350 | $1.23 | 16d | 1 | 1.02mi |
| 4232 Virginia Ave Unit 1 Kansas City, MO | 1.0 | 1.0 | 592 | $750 | $1.27 | 20d | 1 | 1.05mi |
Listing history 13 events
-
2026-06-15days on market $122,000 Active 61 DOM
-
2026-06-13days on market $122,000 Active 59 DOM
-
2026-06-09days on market $122,000 Active 55 DOM
-
2026-06-08days on market $122,000 Active 54 DOM
-
2026-06-07days on market $122,000 Active 53 DOM
-
2026-06-05pricedays on market $122,000 Active 50 DOM
-
2026-06-03days on market $129,500 Active 49 DOM
-
2026-06-02days on market $129,500 Active 48 DOM
-
2026-06-01days on market $129,500 Active 47 DOM
-
2026-05-31days on market $129,500 Active 46 DOM
-
2026-04-15$129,500 Active 684-char remark
Show marketing remark (684 chars)
Charming and affordable! This 2-bedroom, 1-bath home features beautiful original wood floors that add warmth and character throughout. The spacious layout includes a full loft upstairs, perfect for a third bedroom, home office, den, or study to fit your needs. Enjoy the convenience of a one-car garage and an unfinished basement, offering plenty of storage or future expansion potential. Located in an urban core neighborhood, this home is just steps from the bus line and close to everything you need for easy living. Seller will consider, all mortgage types, this is an incredible opportunity for homeowners or investors alike. Don’t miss your chance to make this home yours!
-
2015-06-03$23,900 175-char remark
Show marketing remark (175 chars)
Terrific opportunity for the handy home buyer. Cute with some updates already done. Needs your touch to finish and make this house a home. POF and 1000$ EMD to Frist American
-
1984-07-01soldstatus
ⓘ Source: listings_history table (triggers on properties + properties_extension) + one-shot
backfill from property_details.listing_events for pre-trigger history.
Tax reassessment forecast MO · Resets to sale price
- Current annual tax
- $337 · $28/mo
- Projected year-2 tax
- $1,183 · $99/mo
- Expected delta
- +$846/yr (+$71/mo · 250.8%)
ⓘ Screening estimate from a state-policy table — verify with the county assessor before closing.
Climate risk First Street
- Flood 1/10 Low FEMA zone X (unshaded) · 0% chance over 30 yrs
- Wildfire 1/10 Low
- Heat 4/10 Moderate 7 d/yr ≥106°F today · 17 d/yr by 30 yrs out
- Wind 2/10 Low
- Air quality 3/10 Moderate 2 unhealthy d/yr today · 4 by 30 yrs out
Nearby sold comps map
Loading sold comps map…
Walkable amenities ~0.75 mi
Loading nearby amenities…
Taxation est. · year 1
- Rental income
- $14,426
- − Mortgage interest
- −$6,834
- − Property taxes
- −$337
- − Insurance
- −$610
- − Repairs & maintenance
- −$1,154
- − Management
- −$1,154
- − Depreciation
- −$3,549
- Taxable income
- $788
- Est. tax owed @ 24.0%
- −$189
- After-tax cash flow
- $2,583/yr
For passive investors: Depreciation is non-cash, so a rental often shows a tax loss while cash-flowing — sheltering income. Rental losses are passive: they offset passive income freely, and up to $25,000/yr can offset ordinary (W-2) income if you actively participate and your MAGI is under $100k (phasing out to $0 by $150k); unused losses carry forward. On sale, claimed depreciation is recaptured at up to 25%, and gains may owe capital-gains tax (a 1031 exchange can defer both). Figures are a year-1 estimate at your 24.0% rate — not tax advice; consult a CPA.
Schools (NCES district)
- District
- Kansas City 33
- NCES district ID
- 2916400
- Math proficiency
- 12% ▼ -8.00%
- Reading proficiency
- 24% ▬ 0.00%
- Median HH income
- $35,227
- Composite
- 14.8/100
- National rank
- #9387
- State rank
- #308 of 324 in MO
Livability — Kansas City
- Score
- 78/100
- State rank
- #28
- US rank
- #2671
Category grades
Schools grade is shown separately in the Schools card above.
Census & demographics
- Census place
- Kansas City, MO
- County
- Jackson County · 687,798 people
- City population
- 439,467
- Metro
- Kansas City, MO-KS
- Population (ZIP)
- 19,644
- Household income
- $42,221
- Rent vs Own
- Severe rent burden
- 1132.0
Population outlook (Jackson County) Hauer SSP2
- Today (2025)
- 719,589 people
- By 2030
- 731,456 · +1.6%
- By 2040
- 746,689 · +3.8%
- By 2050
- 749,289 · +4.1%
- By 2075
- 736,227 · +2.3%
- By 2100
- 668,210 · -7.1%
Race, ethnicity, and origin ACS 2023
- Neighborhood character
- Predominantly Black (80%)
- Race & ethnicity
- Black 80% White 9% Hispanic / Latino 8% Two or more races 6%
- Hispanic origin (detail)
- Mexican 5%
- Common ancestry
- Lithuanian 1% Swedish 0%
- Foreign-born
- 6% · Canada
- Languages at home
- 92% English-only · Spanish 7%
Political lean MEDSL · Jackson
- 2024 margin
- D (+19.3) · D 58.9% · R 39.5% · Other 1.6%
- 2008→2024 swing
- -6.1pp toward R · 2008: 25.4pp · 2024: 19.3pp
- All cycles
- 2024: D+19.3 2020: D+22.0 2016: D+16.6 2012: D+19.0 2008: D+25.4
Not yet ingested
- Civics
- —
Market trends
- HPI YoY
- ▼ -73.32%
- Current HPI
- 267.491
- Rent YoY
- ▲ 4.42%
- Metro
- Kansas City, MO-KS
- State GDP YoY
- ▲ 1.84%
- F500 in state
- 20
Industry mix (Fortune 500 HQ in MO)
| Industry | F500 HQs | Revenue |
|---|---|---|
| Healthcare | 1 | $163B |
|
||
| Insurance | 1 | $21B |
|
||
| Industrial Technology | 1 | $17B |
|
||
| Retail | 1 | $16B |
|
||
| Industrial Distribution | 1 | $10B |
|
||
| Utilities | 1 | $9B |
|
||
Price history
+441.8% since first listed3 events — show timeline
- 2026-04-15 Listed $129,500 Heartland MLS as Distributed by MLS Grid
- 2015-06-03 Listed $23,900 Heartland MLS as Distributed by MLS Grid
- 1984-07-01 Sold (Public Records) — Public Records
Property tax history
+15.8%/yrLatest (2025): $337 · -40.3% YoY. Source: county tax records.
Cash-flow waterfall
monthlySold comps — $/sqft
last 12 mo · ≤1 miLoading sold comps…