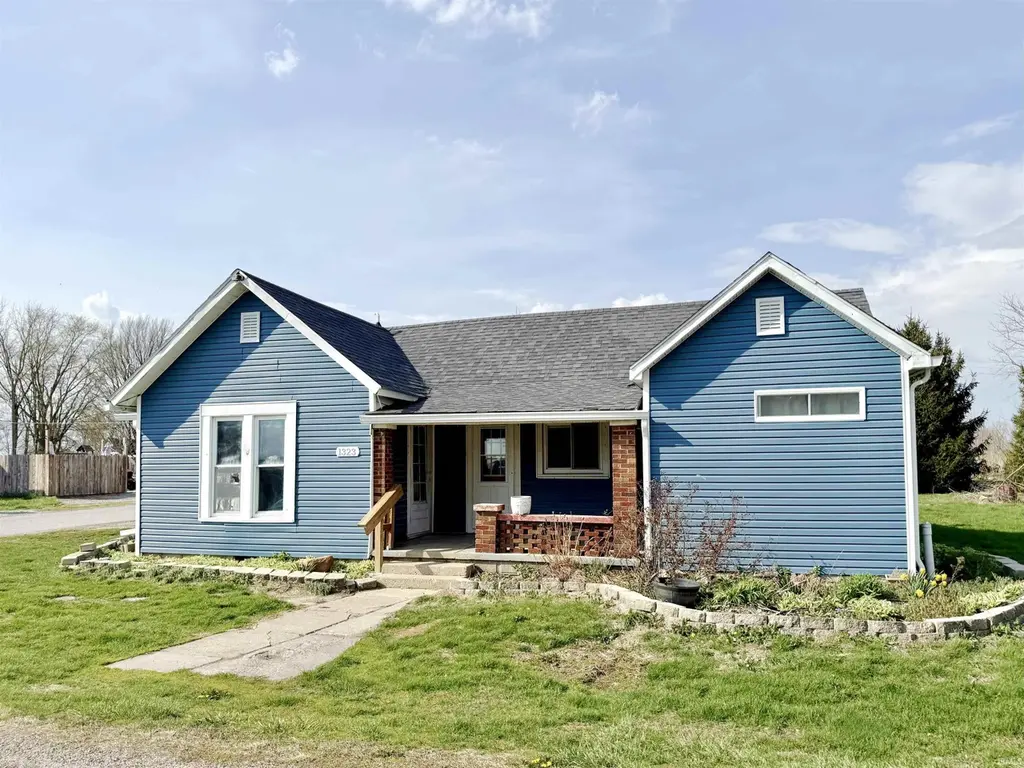
1323 Roush St · Young America, IN
Flood risk 1/10 · Minimal
- FEMA flood zone
- X (unshaded)
- Chance of flooding over 30 yrs
- 0.0%
- Est. flood insurance / yr
- $507 – $1,088
Fire risk 1/10 · Minimal
- Est. fire insurance / yr
- $717 – $1,331
Heat risk 3/10 · Minor
- Hot days now (above 100°F)
- 7 days/yr
- Hot days in 30 yrs
- 17 days/yr
Wind risk 2/10 · Minimal
- Chance of severe wind over 30 yrs
- 0.0%
Air-quality risk 3/10 · Minor
- Unhealthy air days now
- 2 days/yr
- Unhealthy air days in 30 yrs
- 5 days/yr
Risk factors via First Street. Map © Google.
Why this score? — see what drove the B+ grade
The composite is a weighted blend of 9 inputs, each scored 0–100. Each bar is that input's sub-score; the figure is the points it added to the 100-point composite (weight × sub-score).
- Cash flow +29.3/30.0
- ARV discount +15.0/15.0
- DSCR +10.0/10.0
- 1% rule +8.2/10.0
- Appreciation +5.0/10.0
- Schools +3.1/10.0
- Rent growth +2.5/5.0
- Livability +2.5/5.0
- Condition / age +2.2/5.0
$74,900
🖨 Deal sheet 📄 Offer letter ✓ Due diligence
Listing remarks MLS
This 2 bedroom, 1 bath home in Cass County offers great potential for an investor or buyer ready to make it their own. Features include a spacious great room filled with natural light, a roomy kitchen, hardwood flooring, and a large fenced backyard perfect for outdoor fun and entertaining. Located in an area with no HOA found and minimal flood risk, this property offers added flexibility and peace of mind. With some TLC, this home could truly shine.
Key facts
- Hardwood flooring
- Minimal flood risk
- Great room
Tags
Property features AI
Exterior
- Parking: Attached garage with workshop space (1-car garage, 448 sq ft)
- Security: Smoke detectors
- Utilities: Well (private water); Septic system; Electricity connected
- Home design: Single-family residence; One-level home; Facing south; Property listed as fixer
- Construction: Vinyl siding; Crawl space foundation
- Exterior features: Covered patio/porch; Chain link fence; Corner lot with mature trees and small trees; Has a view
Interior
- Kitchen: Dishwasher
- Bedrooms: 2 bedrooms (both on the main level)
- Flooring: Hardwood floors
- Bathrooms: 1 full bathroom (main level)
- Heating & cooling: Baseboard electric heating; Central air conditioning
- Interior features: Hardwood floors; Smart thermostat; Laundry in unit
- Laundry & utility: Washer in unit; Laundry room on main level; Electric water heater
Neighborhood map
What this means for you Summary
Snapshot
- This is a 2-bed/1.0-bath single-family listed at $75k. Condition is rated fair.
Deal economics
- At list price, monthly cash flow is $263 ($3k/yr) — positive.
- The deal already cash-flows at list — no discount required.
- Meets the 1% rule at list price ($988 rent vs $75k).
- Recommended offer: $73k (3.0% below list) — sets the bar for market timing.
Location & tenants
- Location reads: area grade B — affects rentability + tenant quality, not the cash-flow math above.
- Lewis Cass Schools (rural): math 35% / reading 37% proficiency, ranked #177 of 301 in IN (top 59%) — families likely to look elsewhere, expect single-tenant / working-renter base with shorter leases.
- Market conditions: 1 active listings in the ZIP; 22 units permitted in Cass County in 2024 (0 in 5+ unit buildings).
Forward outlook
- In year one you build about $3k of equity ($518 loan paydown + $2k appreciation (3.0% local appreciation)).
- Cass County population projected at -16% by 2050 — secular population decline; favor cash flow + early exit over multi-decade hold.
- At projected returns (3.0% appreciation + 3.0% rent growth), your $21k cash investment doubles in ~4 years — after that, you're playing with house money.
Negotiation context
- It's been on market 39 days — a 3% lower offer ($73k) is reasonable based on typical stale-listing flexibility.
- 2 sale attempts; this cycle's ask has dropped $5k (6%) from the opening price — seller is motivated, your offer sets the floor, not the list.
Risks & watch-outs
- Watch-outs: built in 1900 — expect roof / HVAC / electrical / plumbing capex.
Questions for the listing agent
- It's been on market 39 days. Have you received any prior offers? Is the seller open to a 3% concession, seller financing, or rate buy-down credit?
- Have any recent inspections been done? Can we get a copy of the seller's disclosures and any deferred-maintenance estimates?
- Built in 1900 — when were the roof, HVAC, electrical panel, plumbing, and water heater last replaced?
- Is there a deadline driving the sale (1031 exchange, divorce, estate, relocation)? That informs how much negotiation room exists.
- What's the average days-on-market for RENTAL listings here right now (not sales)? A rising rental-DOM trend means longer vacancies and softer asking-rent achievability than the comps imply.
- What's the recent tenant-quality profile in this submarket — average credit score on applications, eviction rate, late-payment / NSF rate, and stable-employment percentage? A property-management company in the area should have these aggregated.
- How much new for-sale + rental construction is in the pipeline within 1–3 miles? Heavy new supply typically softens prices + rents 12–24 months out; constrained supply supports both.
Investment metrics
- 1% rule
- 1.32% ✓
- Cap rate
- 10.51%
- Cash-on-cash
- 15.06%
- DSCR
- 1.67
- GRM
- 6.3
CMA / ARV
- ARV (median comp)
- $138,750
- List price
- $74,900
- Delta
- -46.02%
- Verdict
- UNDERPRICED
- Comps
- 3 within 1.0 mi
Projected returns pro-forma
3.0% appreciation · 3.0% rent growth · sell at horizon
- IRR
- 21.6%
- Equity multiple
- 2.23×
- Total profit
- $25,802
- Equity at exit
- $33,678
- IRR
- 22.7%
- Equity multiple
- 4.26×
- Total profit
- $68,390
- Equity at exit
- $51,902
Cash invested: $20,972 (down + closing). Projections, not guarantees.
Landlord ↔ Tenant lean methodology
- Overall (STATE)
- 90 Strongly Landlord-Friendly
- State Indiana
- 90 Strongly Landlord-Friendly · R+11
- County
- — inherits STATE
- City
- — inherits STATE
ZIP-level market 46998
- Active inventory
- 1
- Price-to-rent
- 6.3×
Monthly cashflow live
- Estimated rent
- $988 medium interval (Pro) →
- Mortgage (P&I)
- −$393
- Tax est. 1.5%
- −$94 /mo · $1,124/yr
- Insurance
- −$31
- HOA
- −$0
- Vacancy / Maint / Mgmt
- −$208
- Net cashflow
- $263
Break-even live
UW: 25.0% down · 7.5% · 30yr · 1.5% tax · 5.0% vac · 8.0% maint · 8.0% mgmt
Financing live
Cash to close
- Down payment
- $18,725
- Closing costs
- $2,247
- Reserves months
- —
- Total cash needed
- —
Loan-product check · same deal, 3 products live
Conventional
25% down · 7.5% · 30yr
- Down + closing
- —
- Monthly P&I
- —
- Monthly cashflow
- —
- DSCR
- —
- Eligible?
- —
Personal DTI + credit; lowest rate.
DSCR
20% down · 8.5% · 30yr
- Down + closing
- —
- Monthly P&I
- —
- Monthly cashflow
- —
- DSCR
- —
- Eligible?
- —
No personal income docs; deal must DSCR.
Hard money
10% down · 12.0% · 12mo
- Down + closing
- —
- Monthly P&I
- —
- Monthly cashflow
- —
- DSCR
- —
- Eligible?
- —
Short-term bridge; refi at stabilization.
Listing history 19 events
-
2026-06-19days on market $74,900 Active 39 DOM
-
2026-06-18days on market $74,900 Active 38 DOM
-
2026-06-17days on market $74,900 Active 37 DOM
-
2026-06-16days on market $74,900 Active 36 DOM
-
2026-06-15days on market $74,900 Active 35 DOM
-
2026-06-14days on market $74,900 Active 33 DOM
-
2026-06-13pricedays on market $74,900 Active 32 DOM
-
2026-06-10days on market $79,900 Active 30 DOM
-
2026-06-09days on market $79,900 Active 29 DOM
-
2026-06-08days on market $79,900 Active 28 DOM
-
2026-06-07days on market $79,900 Active 27 DOM
-
2026-06-05days on market $79,900 Active 24 DOM
-
2026-06-03days on market $79,900 Active 23 DOM
-
2026-06-02days on market $79,900 Active 22 DOM
-
2026-06-01days on market $79,900 Active 21 DOM
-
2026-05-31days on market $79,900 Active 20 DOM
-
2026-05-30days on market $79,900 Active 19 DOM
-
2026-05-12$79,900 Active 453-char remark
Show marketing remark (453 chars)
This 2 bedroom, 1 bath home in Cass County offers great potential for an investor or buyer ready to make it their own. Features include a spacious great room filled with natural light, a roomy kitchen, hardwood flooring, and a large fenced backyard perfect for outdoor fun and entertaining. Located in an area with no HOA found and minimal flood risk, this property offers added flexibility and peace of mind. With some TLC, this home could truly shine.
-
2026-05-11$79,900 Active 453-char remark
ⓘ Source: listings_history table (triggers on properties + properties_extension) + one-shot
backfill from property_details.listing_events for pre-trigger history.
Climate risk First Street
- Flood 1/10 Low FEMA zone X (unshaded) · 0% chance over 30 yrs
- Wildfire 1/10 Low
- Heat 3/10 Moderate 7 d/yr ≥100°F today · 17 d/yr by 30 yrs out
- Wind 2/10 Low 0% chance of damaging wind over 30 yrs
- Air quality 3/10 Moderate 2 unhealthy d/yr today · 5 by 30 yrs out
Nearby sold comps map
Loading sold comps map…
Walkable amenities ~0.75 mi
Loading nearby amenities…
Taxation est. · year 1
- Rental income
- $11,861
- − Mortgage interest
- −$4,196
- − Property taxes
- −$1,124
- − Insurance
- −$374
- − Repairs & maintenance
- −$949
- − Management
- −$949
- − Depreciation
- −$2,179
- Taxable income
- $2,090
- Est. tax owed @ 24.0%
- −$502
- After-tax cash flow
- $2,657/yr
For passive investors: Depreciation is non-cash, so a rental often shows a tax loss while cash-flowing — sheltering income. Rental losses are passive: they offset passive income freely, and up to $25,000/yr can offset ordinary (W-2) income if you actively participate and your MAGI is under $100k (phasing out to $0 by $150k); unused losses carry forward. On sale, claimed depreciation is recaptured at up to 25%, and gains may owe capital-gains tax (a 1031 exchange can defer both). Figures are a year-1 estimate at your 24.0% rate — not tax advice; consult a CPA.
Condition & rehab AI · 2 photos
This 2-bedroom home has good exterior and landscaping, but needs some exterior painting and landscaping maintenance to improve its curb appeal and rental value.
Repairs flagged
- Minor Landscaping — Some areas of the lawn appear uneven
- Minor Foundation — No visible cracks or issues
Value-add opportunities
- Resale Paint exterior — Fresh paint can enhance curb appeal
- Rental Landscaping — Well-maintained landscaping can attract tenants
Renovation cost estimate screening
| Repair item | Severity | Est. cost |
|---|---|---|
| Landscaping · Some areas of the lawn appear uneven | Minor | $500–3,000 |
| Foundation · No visible cracks or issues | Minor | $500–3,000 |
| Total estimated repair cost · 2 items | $1,000–6,000 |
Value-add ROI direction
- Resale Paint exterior — Fresh paint can enhance curb appeal ↑
- Rental Landscaping — Well-maintained landscaping can attract tenants ↑
ⓘ Cost ranges are severity-bucket heuristics (US national rule-of-thumb). Get contractor quotes + a written scope before underwriting a rehab budget.
Schools (NCES district)
- District
- Lewis Cass Schools
- NCES district ID
- 1810680
- Math proficiency
- 35% ▼ -7.00%
- Reading proficiency
- 37% ▼ -10.00%
- Median HH income
- $50,796
- Composite
- 31.25/100
- National rank
- #6029
- State rank
- #177 of 301 in IN
Livability — Young America
No livability data for this city. (Only ~50 U.S. cities are tracked.)
Census & demographics
- Census place
- Young America, IN
- Population (ZIP)
- 196
Population outlook (Cass County) Hauer SSP2
- Today (2025)
- 36,480 people
- By 2030
- 35,390 · -3.0%
- By 2040
- 33,077 · -9.3%
- By 2050
- 30,631 · -16.0%
- By 2075
- 25,426 · -30.3%
- By 2100
- 20,617 · -43.5%
Race, ethnicity, and origin ACS 2023
- Neighborhood character
- Predominantly White (69%)
- Race & ethnicity
- White 69% Hispanic / Latino 31% Two or more races 22%
- Hispanic origin (detail)
- Foreign-born
- 8% · Canada
- Languages at home
- 85% English-only · Spanish 15%
Political lean MEDSL · Cass
- 2024 margin
- Solid R (+46.2) · D 26.2% · R 72.4% · Other 1.4%
- 2008→2024 swing
- -37.7pp toward R · 2008: -8.5pp · 2024: -46.2pp
- All cycles
- 2024: R+46.2 2020: R+41.1 2016: R+42.0 2012: R+21.7 2008: R+8.5
Not yet ingested
- Civics
- —
Market trends
- HPI YoY
- —
- Current HPI
- —
- Rent YoY
- —
- Metro
- —
- State GDP YoY
- ▲ 2.90%
- F500 in state
- 18
Industry mix (Fortune 500 HQ in IN)
| Industry | F500 HQs | Revenue |
|---|---|---|
| Industrial Machinery | 2 | $37B |
|
||
| Healthcare | 1 | $177B |
|
||
| Pharmaceuticals | 1 | $45B |
|
||
| Metals / Steel | 1 | $18B |
|
||
| Agriculture | 1 | $17B |
|
||
| Packaging | 1 | $12B |
|
||
Price history
-6.3% since first listed4 events — show timeline
- 2026-06-12 Price Changed $74,900 IRMLS
- 2026-06-12 Price Changed $74,900 MIBOR as Distributed by MLS Grid
- 2026-05-12 Listed $79,900 IRMLS
- 2026-05-11 Listed $79,900 MIBOR as Distributed by MLS Grid
Cash-flow waterfall
monthlySold comps — $/sqft
last 12 mo · ≤1 miLoading sold comps…