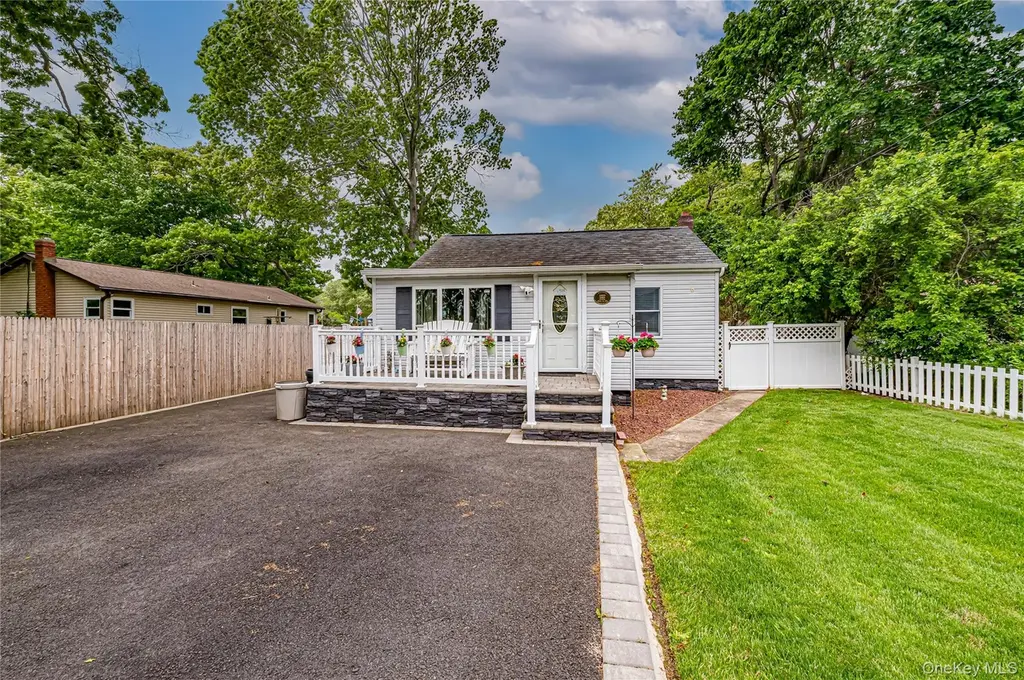
122 Church Dr · Mastic Beach, NY
Flood risk 3/10 · Minor
- FEMA flood zone
- X (unshaded)
- Chance of flooding over 30 yrs
- 0.12%
- Est. flood insurance / yr
- $473 – $860
Fire risk 2/10 · Minimal
- Est. fire insurance / yr
- $691 – $1,283
Heat risk 4/10 · Minor
- Hot days now (above 91°F)
- 7 days/yr
- Hot days in 30 yrs
- 19 days/yr
Wind risk 8/10 · Major
- Chance of severe wind over 30 yrs
- 80.0%
Air-quality risk 4/10 · Minor
- Unhealthy air days now
- 3 days/yr
- Unhealthy air days in 30 yrs
- 5 days/yr
Risk factors via First Street. Map © Google.
Why this score? — see what drove the D- grade
The composite is a weighted blend of 9 inputs, each scored 0–100. Each bar is that input's sub-score; the figure is the points it added to the 100-point composite (weight × sub-score).
- Appreciation +10.0/10.0
- Cash flow +9.0/30.0
- Schools +4.7/10.0
- ARV discount +3.6/15.0
- Livability +3.1/5.0
- DSCR +2.5/10.0
- Rent growth +2.5/5.0
- Condition / age +2.5/5.0
- 1% rule +1.8/10.0
$489,000
🖨 Deal sheet (PDF) 📄 Offer letter ✓ Due diligence
Listing remarks
Welcome to 122 Church Drive in the heart of Mastic Beach, a charming 2-bedroom, 1-bathroom home offering comfort, convenience, and important mechanical updates. This well-maintained property features oil heat with an oil burner that is approximately 3 years old, providing added peace of mind for the next owner. The roof is approximately 9 years old, and a split air-conditioning system keeps the home comfortable during the warmer months. The kitchen is equipped with a propane gas stove, offering efficient cooking and the responsiveness many home chefs prefer. Located in a residential neighborhood, this home is close to local parks, beaches, shopping, restaurants, and everyday conveniences. R
Key facts
- Oil heat
- Oil burner
- Propane gas stove
Tags
Property features AI
Exterior
- Parking: No carport; Other parking type
- Utilities: Cesspool sewer; No additional utilities listed
- Home design: Single-family residence; Property condition listed as actual
- Construction: Block foundation
- Exterior features: Vinyl siding; Not waterfront
Interior
- Kitchen: No appliances listed
- Bedrooms: Total of 5 rooms (bedrooms/other rooms included in total)
- Bathrooms: 1 full bathroom
- Heating & cooling: Baseboard heating; No central cooling
- Interior features: Unfinished basement; Other interior features
- Laundry & utility: No utilities/appliances listed
Neighborhood map
What this means for you Summary
Snapshot
- This is a 2-bed/1.0-bath single-family listed at $489k.
Deal economics
- At list price, monthly cash flow is $-387 ($-5k/yr) — negative.
- To cash-flow at today's rent, offer at most $421k (14.0% below list).
- To meet the 1% rule (rent ≥ 1% of price), the offer needs to be $332k (32.0% below list).
- Recommended offer: $332k (32.0% below list) — sets the bar for 1% rule.
Location & tenants
- Location reads 61/100 on livability (#936 in NY) — a middle-class / working-renter tenant base. Strengths: employment A+, housing A+; Watch: crime D, amenities F, commute F.
- William Floyd Union Free School District (suburban): math 48% / reading 57% proficiency, ranked #309 of 590 in NY (top 52%) — acceptable for families but not a draw, mixed tenant base, ~2y average lease.
- Zoned schools: Tangier Smith Elementary School (math 43% / reading 54%, grade D, #1,181 of 2,108 statewide, top 56%, 755 students, 61% FRL); William Paca Middle School (math 31% / reading 37%, grade F, #497 of 729 statewide, top 69%, 1,009 students, 59% FRL); William Floyd High School (math 65% / reading 87%, grade A-, #616 of 1,100 statewide, top 57%, 3,013 students, 54% FRL) — zoned schools average 58% FRL vs 43% district-wide (15 pts higher); higher-poverty schools than district average — tighter screening recommended.
- Market conditions: 135 active listings in the ZIP; 3 comparable units currently listed for rent nearby; rentals leasing fast (median 1d on market — plan ~1-2 weeks tenant-placement turnaround); 1,366 units permitted in Suffolk County in 2024 (216 in 5+ unit buildings).
Forward outlook
- In year one you build about $52k of equity ($3k loan paydown + $49k appreciation (10.0% local appreciation)).
- Suffolk County population projected to shrink 5% by 2050 — rents likely to lag national; underwrite the cash flow, not the appreciation.
- By year 2, paydown + projected appreciation supports a ~$84k cash-out refi (75% LTV) — recoverable capital for the next deal without selling this one.
Negotiation context
- Only 13 days on market — expect competitive offers; lowballing is unlikely to land.
- Current owner paid $248k; list at $489k implies a 97% gain — meaningful room to come down on a strong offer.
Risks & watch-outs
- Watch-outs: built in 1940 — expect roof / HVAC / electrical / plumbing capex.
- Climate carrying-cost: severe wind risk, 80% chance of damaging wind over 30y — expect insurance premiums to compound above CPI over the hold.
Questions for the listing agent
- What do current leases actually rent for vs. the listed asking? Can we see a recent rent roll and the last 12 months of T-12 income?
- Built in 1940 — when were the roof, HVAC, electrical panel, plumbing, and water heater last replaced?
- Is there a deadline driving the sale (1031 exchange, divorce, estate, relocation)? That informs how much negotiation room exists.
- Schools are D-rated, which usually means shorter tenancies and higher turnover. Who's the typical renter profile here, and what's been the actual vacancy rate?
- Crime grade is D in this area — have there been break-ins, vandalism, or insurance claims at this property in the last 3 years? What carrier currently insures it and at what premium?
- The area grade is low — what's the realistic commute time and amenity access for the typical tenant pool here? Any planned neighborhood developments (good or bad) we should know about?
- What's the average days-on-market for RENTAL listings here right now (not sales)? A rising rental-DOM trend means longer vacancies and softer asking-rent achievability than the comps imply.
- What's the recent tenant-quality profile in this submarket — average credit score on applications, eviction rate, late-payment / NSF rate, and stable-employment percentage? A property-management company in the area should have these aggregated.
- How much new for-sale + rental construction is in the pipeline within 1–3 miles? Heavy new supply typically softens prices + rents 12–24 months out; constrained supply supports both.
Investment metrics
- 1% rule
- 0.68% ✗
- Cap rate
- 5.34%
- Cash-on-cash
- -3.39%
- DSCR
- 0.85
- GRM
- 12.3
CMA / ARV
- ARV (on-the-fly)
- $450,049
- Comps found
- 12
Show comp detail 12 sales within ~0.75 mi
| Address | Dist | Beds/Ba | Sqft | Sold | Price | $/sf | Match |
|---|---|---|---|---|---|---|---|
| 16 Market St | 0.40mi | 2/1.0 | 1,120 (+5%) | 2mo | $470,000 | $420 | 72 |
| 303 Orchid Dr | 0.07mi | 3/1.0 (+1) | 1,200 (+12%) | 7mo | $478,000 | $398 | 65 |
| 25 Woodcut Dr | 0.33mi | 3/1.0 (+1) | 1,175 (+10%) | 1mo | $410,000 | $349 | 63 |
| 247 Hawthorne St | 0.56mi | 3/1.0 (+1) | 1,104 (+3%) | 6mo | $465,000 | $421 | 58 |
| 237 Cypress Dr | 0.45mi | 3/2.0 (+1) | 1,008 (-6%) | 3mo | $465,000 | $461 | 58 |
| 139 Washington Ave | 0.46mi | 3/1.0 (+1) | 1,008 (-6%) | 8mo | $470,000 | $466 | 58 |
| 137 Riverside Ave | 0.49mi | 3/1.0 (+1) | 1,161 (+9%) | 2mo | $465,000 | $401 | 56 |
| 289 Jefferson | 0.68mi | 3/1.0 (+1) | 1,014 (-5%) | 2mo | $445,000 | $439 | 53 |
| 307 Jefferson Dr | 0.62mi | 3/2.0 (+1) | 1,024 (-4%) | 2mo | $560,000 | $547 | 53 |
| 129 Lakeview Dr | 0.54mi | 3/1.0 (+1) | 954 (-11%) | 1mo | $515,000 | $540 | 51 |
| 181 Cypress Dr | 0.72mi | 2/1.0 | 1,200 (+12%) | 2mo | $276,000 | $230 | 44 |
| 150 Wavecrest Dr | 0.70mi | 3/1.0 (+1) | 1,176 (+10%) | 2mo | $420,000 | $357 | 44 |
Match score weights: distance 35% · size 25% · config 20% · recency 20%. Top-matched comps best support the ARV.
Projected returns pro-forma
10.0% appreciation · 3.0% rent growth · sell at horizon
- IRR
- 21.9%
- Equity multiple
- 2.76×
- Total profit
- $241,522
- Equity at exit
- $440,530
- IRR
- 19.7%
- Equity multiple
- 6.33×
- Total profit
- $730,260
- Equity at exit
- $950,019
Cash invested: $136,920 (down + closing). Projections, not guarantees.
Landlord ↔ Tenant lean methodology
- Overall (STATE)
- 15 Strongly Tenant-Friendly
- State New York
- 15 Strongly Tenant-Friendly · D+10
- County
- — inherits STATE
- City
- — inherits STATE
ZIP-level market 11951
- Home prices YoY
- 4.3%
- Active inventory
- 135
- Price-to-rent
- 12.3×
Monthly cashflow live
- Estimated rent
- $3,325 medium interval (Pro) →
- Mortgage (P&I)
- −$2,564
- Tax from tax record
- −$245 /mo · $2,941/yr
- Insurance
- −$204
- HOA
- −$0
- Vacancy / Maint / Mgmt
- −$698
- Net cashflow
- $-387
Break-even live
Sensitivity live
| Price | -10% $-110 | -5% $-248 | +0% $-387 | +5% $-525 | +10% $-663 |
|---|---|---|---|---|---|
| Rent | -10% $-649 | -5% $-518 | +0% $-387 | +5% $-255 | +10% $-124 |
| Rate | -1.0pp $-140 | -0.5pp $-262 | base $-387 | +0.5pp $-513 | +1.0pp $-642 |
UW: 25.0% down · 7.5% · 30yr · 1.5% tax · 5.0% vac · 8.0% maint · 8.0% mgmt
Financing live
Cash to close
- Down payment
- $122,250
- Closing costs
- $14,670
- Reserves months
- —
- Total cash needed
- —
Loan-product check · same deal, 3 products live
Conventional
25% down · 7.5% · 30yr
- Down + closing
- —
- Monthly P&I
- —
- Monthly cashflow
- —
- DSCR
- —
- Eligible?
- —
Personal DTI + credit; lowest rate.
DSCR
20% down · 8.5% · 30yr
- Down + closing
- —
- Monthly P&I
- —
- Monthly cashflow
- —
- DSCR
- —
- Eligible?
- —
No personal income docs; deal must DSCR.
Hard money
10% down · 12.0% · 12mo
- Down + closing
- —
- Monthly P&I
- —
- Monthly cashflow
- —
- DSCR
- —
- Eligible?
- —
Short-term bridge; refi at stabilization.
Rent comps 3 comps
| Address | Beds | Baths | Sqft | Rent | $/sqft | DOM | Units | Dist |
|---|---|---|---|---|---|---|---|---|
| 48 Eleanor Ave Mastic, NY | 3.0 | 1.0 | 975 | $3,500 | $3.59 | 26d | 1 | 0.73mi |
| 149 Washington Dr Mastic Beach, NY | 3.0 | 1.0 | 1152 | $3,400 | $2.95 | 0d | 1 | 0.87mi |
| 5 Cedar Rd E Mastic Beach, NY | 3.0 | 1.0 | 740 | $2,900 | $3.92 | 0d | 1 | 0.98mi |
Listing history 9 events
-
2026-06-21days on market $489,000 Active 13 DOM
-
2026-06-18days on market $489,000 Active 10 DOM
-
2026-06-17days on market $489,000 Active 9 DOM
-
2026-06-16days on market $489,000 Active 8 DOM
-
2026-06-15days on market $489,000 Active 7 DOM
-
2026-06-13days on market $489,000 Active 5 DOM
-
2026-06-13days on market $489,000 Active 4 DOM
-
2026-06-08remarks 699-char remark
-
2026-06-08$489,000 Active 1 DOM
ⓘ Source: listings_history table (triggers on properties + properties_extension) + one-shot
backfill from property_details.listing_events for pre-trigger history.
Tax reassessment forecast NY · Partial reset (capped growth)
- Current annual tax
- $2,941 · $245/mo
- Projected year-2 tax
- $5,602 · $467/mo
- Expected delta
- +$2,662/yr (+$222/mo · 90.5%)
ⓘ Screening estimate from a state-policy table — verify with the county assessor before closing.
Climate risk First Street
- Flood 3/10 Moderate FEMA zone X (unshaded) · 12% chance over 30 yrs
- Wildfire 2/10 Low
- Heat 4/10 Moderate 7 d/yr ≥91°F today · 19 d/yr by 30 yrs out
- Wind 8/10 Severe 80% chance of damaging wind over 30 yrs
- Air quality 4/10 Moderate 3 unhealthy d/yr today · 5 by 30 yrs out
Nearby sold comps map
Loading sold comps map…
Walkable amenities ~0.75 mi
Loading nearby amenities…
Taxation est. · year 1
- Rental income
- $39,897
- − Mortgage interest
- −$27,392
- − Property taxes
- −$2,941
- − Insurance
- −$2,445
- − Repairs & maintenance
- −$3,192
- − Management
- −$3,192
- − Depreciation
- −$14,225
- Taxable loss
- −$13,489
- Est. tax savings @ 24.0%
- +$3,237
- After-tax cash flow
- $-1,402/yr
For passive investors: Depreciation is non-cash, so a rental often shows a tax loss while cash-flowing — sheltering income. Rental losses are passive: they offset passive income freely, and up to $25,000/yr can offset ordinary (W-2) income if you actively participate and your MAGI is under $100k (phasing out to $0 by $150k); unused losses carry forward. On sale, claimed depreciation is recaptured at up to 25%, and gains may owe capital-gains tax (a 1031 exchange can defer both). Figures are a year-1 estimate at your 24.0% rate — not tax advice; consult a CPA.
Schools (NCES district)
- District
- William Floyd Union Free School District
- NCES district ID
- 3618690
- Math proficiency
- 48% ▲ 3.00%
- Reading proficiency
- 57% ▲ 11.00%
- Median HH income
- $70,564
- Composite
- 46.79/100
- National rank
- #2383
- State rank
- #309 of 590 in NY
Livability — Mastic Beach
- Score
- 61/100
- State rank
- #936
- US rank
- #18216
Category grades
Schools grade is shown separately in the Schools card above.
Census & demographics
- Census place
- Mastic Beach, NY
- City population
- 15,830
- Population (ZIP)
- 15,830
Population outlook (Suffolk County) Hauer SSP2
- Today (2025)
- 1,505,262 people
- By 2030
- 1,498,318 · -0.5%
- By 2040
- 1,471,101 · -2.3%
- By 2050
- 1,424,848 · -5.3%
- By 2075
- 1,337,157 · -11.2%
- By 2100
- 1,217,720 · -19.1%
Race, ethnicity, and origin ACS 2023
- Neighborhood character
- Predominantly White (68%)
- Race & ethnicity
- White 68% Hispanic / Latino 17% Two or more races 9% Black 6% Asian 2%
- Hispanic origin (detail)
- Mexican 1% Puerto Rican 6% Cuban 2%
- Common ancestry
- Lithuanian 3% Romanian 2% Italian 2%
- Foreign-born
- 7% · Canada, Vietnam
- Languages at home
- 84% English-only · Spanish 10% Other Indo-European 3% Chinese 1%
Political lean MEDSL · Suffolk
- 2024 margin
- Lean R (+10.0) · D 45.0% · R 55.0%
- 2008→2024 swing
- -16.0pp toward R · 2008: 6.0pp · 2024: -10.0pp
- All cycles
- 2024: R+10.0 2020: R+0.0 2016: R+8.2 2012: D+2.9 2008: D+6.0
Not yet ingested
- Civics
- —
Market trends
- HPI YoY
- ▲ 34.46%
- Current HPI
- 829.86
- Rent YoY
- —
- Metro
- —
- State GDP YoY
- ▲ 2.60%
- F500 in state
- 92
Industry mix (Fortune 500 HQ in NY)
| Industry | F500 HQs | Revenue |
|---|---|---|
| Financial Services | 10 | $950B |
|
||
| Consumer Goods | 9 | $162B |
|
||
| Insurance | 4 | $225B |
|
||
| Telecommunications | 2 | $144B |
|
||
| Pharmaceuticals | 2 | $112B |
|
||
| Media / Entertainment | 2 | $69B |
|
||
Price history
+652.3% since first listed3 events — show timeline
- 2026-06-06 Listed $489,000 OneKey® MLS as Distributed by MLS Grid
- 2005-09-14 Sold (Public Records) $248,000 Public Records
- 1991-07-09 Sold (Public Records) $65,000 Public Records
Property tax history
+9.0%/yrLatest (2025): $2,941 · +0.0% YoY. Source: county tax records.
Cash-flow waterfall
monthlySold comps — $/sqft
last 12 mo · ≤1 miLoading sold comps…