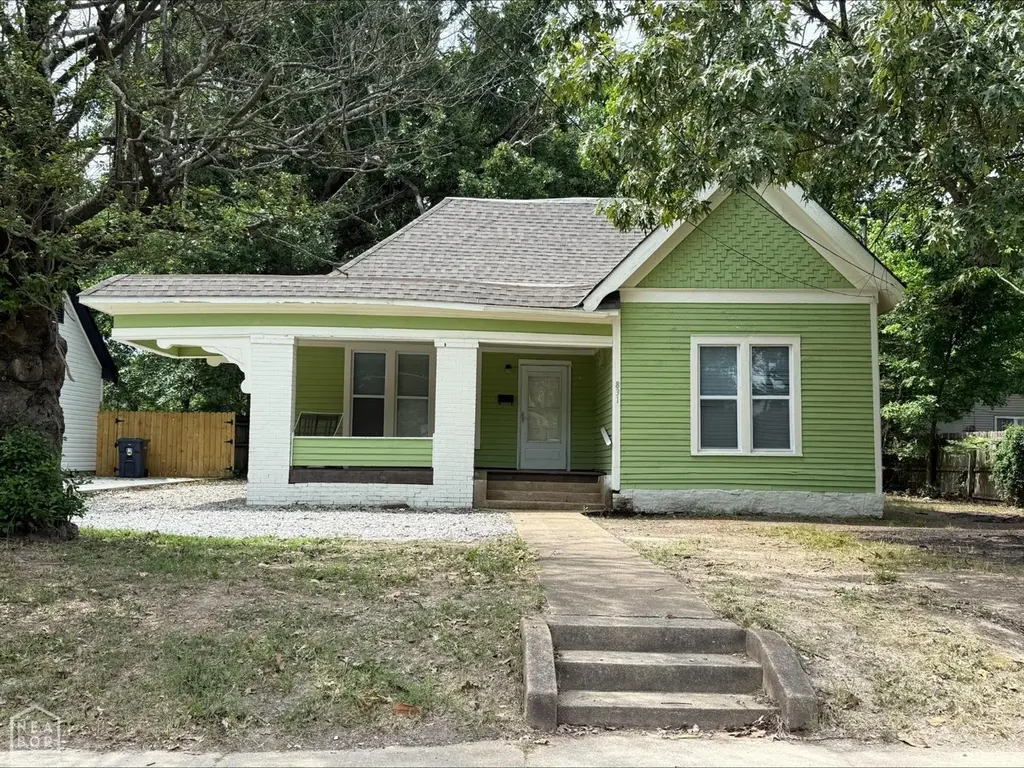
831 W Huntington Ave · Jonesboro, AR
Flood risk 1/10 · Minimal
- FEMA flood zone
- X
- Chance of flooding over 30 yrs
- 0.0%
- Est. flood insurance / yr
- $507 – $1,088
Fire risk 3/10 · Minor
- Est. fire insurance / yr
- $1,499 – $2,785
Heat risk 5/10 · Moderate
- Hot days now (above 109°F)
- 7 days/yr
- Hot days in 30 yrs
- 20 days/yr
Wind risk 3/10 · Minor
- Chance of severe wind over 30 yrs
- 7.0%
Air-quality risk 1/10 · Minimal
- Unhealthy air days now
- 0 days/yr
- Unhealthy air days in 30 yrs
- 0 days/yr
Risk factors via First Street. Map © Google.
Why this score? — see what drove the D grade
The composite is a weighted blend of 9 inputs, each scored 0–100. Each bar is that input's sub-score; the figure is the points it added to the 100-point composite (weight × sub-score).
- Cash flow +21.8/30.0
- DSCR +7.0/10.0
- 1% rule +4.4/10.0
- Rent growth +3.4/5.0
- Livability +3.2/5.0
- Condition / age +2.5/5.0
- Schools +2.3/10.0
- ARV discount +0.0/15.0
- Appreciation +0.0/10.0
$154,900
🖨 Deal sheet 📄 Offer letter ✓ Due diligence
Listing remarks
West End 4 bedroom 2 full bath house, recently remodeled and updated. Beautiful hardwood floors throughout, updated bathrooms, Kitchen with Stainless appliances, Roof new less than 2 years ago, lots of updates.
Key facts
- Stainless appliances
- Updated bathrooms
- Hardwood floors
Tags
Property features AI
Exterior
- Parking: Detached 1-car garage
- Utilities: Public water; Public sewer
- Home design: Single-family residence; Single-story
- Construction: Wood siding
- Exterior features: Front porch; Level lot
Interior
- Kitchen: Dishwasher; Microwave; Refrigerator
- Flooring: Ceramic tile; Hardwood
- Bathrooms: 2 full bathrooms
- Heating & cooling: Central heating; Central air conditioning; Ceiling fans
- Interior features: Dishwasher; Microwave; Refrigerator; Living room fireplace; Ceramic tile and hardwood floors
- Laundry & utility: Dedicated laundry room
Neighborhood map
What this means for you Summary
Snapshot
- This is a 4-bed/1.0-bath single-family listed at $155k.
Deal economics
- At list price, monthly cash flow is $241 ($3k/yr) — positive.
- The deal already cash-flows at list — no discount required.
- To meet the 1% rule (rent ≥ 1% of price), the offer needs to be $145k (6.2% below list).
- Recommended offer: $145k (6.2% below list) — sets the bar for 1% rule.
- Cap rate 8.2% vs local median 4.4% in Jonesboro — top-decile yield for the area; either an underpriced asset or a hidden risk that comps aren't pricing in. Stress-test before assuming the spread holds.
Location & tenants
- Location reads 65/100 on livability (#145 in AR) — a middle-class / working-renter tenant base. Strengths: cost of living A+, housing A+, health & safety A+; Watch: crime F, amenities F, commute F.
- Jonesboro School District (urban): math 28% / reading 28% proficiency, ranked #169 of 238 in AR (top 71%) — low school quality limits family demand, transient renter base, plan for 1-2y turnover; 67% free/reduced lunch — lower-income household profile, screen leases tightly.
- Zoned schools: Annie Camp Jr. High School (math 22% / reading 34%, grade F, #150 of 201 statewide, top 76%, 784 students, 100% FRL); The Academies At Jonesboro High School (math 16% / reading 27%, grade F, #225 of 292 statewide, top 78%, 1,386 students, 100% FRL) — zoned schools average 100% FRL vs 67% district-wide (33 pts higher); higher-poverty schools than district average — tighter screening recommended.
- Market conditions: Rents rising (+3.6%/yr); 295 active listings in the ZIP; 1 comparable units currently listed for rent nearby; 926 units permitted in Craighead County in 2024 (69 in 5+ unit buildings).
- This rent runs 38% of the median local income ($45k/yr) — at the standard rent-burdened threshold; future hikes will face affordability resistance.
Forward outlook
- Local home prices are declining (-3.0%/yr); year-one equity from $1k of loan paydown is wiped out by about $5k of value loss. Plan a longer hold.
- Craighead County population projected at +38% by 2050 — long-run rental-demand tailwind backs the buy-and-hold thesis.
Negotiation context
- It's been on market 30 days — a 2% lower offer ($153k) is reasonable based on typical stale-listing flexibility.
Risks & watch-outs
- Climate carrying-cost: extreme-heat days projected 7→20/yr by 2055 (HVAC capex compounding) — expect insurance premiums to compound above CPI over the hold.
Questions for the listing agent
- Is there a deadline driving the sale (1031 exchange, divorce, estate, relocation)? That informs how much negotiation room exists.
- Schools are D-rated, which usually means shorter tenancies and higher turnover. Who's the typical renter profile here, and what's been the actual vacancy rate?
- Crime grade is F in this area — have there been break-ins, vandalism, or insurance claims at this property in the last 3 years? What carrier currently insures it and at what premium?
- The area grade is low — what's the realistic commute time and amenity access for the typical tenant pool here? Any planned neighborhood developments (good or bad) we should know about?
- What's the average days-on-market for RENTAL listings here right now (not sales)? A rising rental-DOM trend means longer vacancies and softer asking-rent achievability than the comps imply.
- What's the recent tenant-quality profile in this submarket — average credit score on applications, eviction rate, late-payment / NSF rate, and stable-employment percentage? A property-management company in the area should have these aggregated.
- How much new for-sale + rental construction is in the pipeline within 1–3 miles? Heavy new supply typically softens prices + rents 12–24 months out; constrained supply supports both.
Investment metrics
- 1% rule
- 0.94% ✗
- Cap rate
- 8.16%
- Cash-on-cash
- 6.66%
- DSCR
- 1.30
- GRM
- 8.9
CMA / ARV
- ARV (on-the-fly)
- $132,788
- Comps found
- 12
Show comp detail 12 sales within ~0.75 mi
| Address | Dist | Beds/Ba | Sqft | Sold | Price | $/sf | Match |
|---|---|---|---|---|---|---|---|
| 1020 W Jefferson Ave | 0.27mi | 3/1.0 (-1) | 1,526 (+2%) | 1mo | $62,000 | $41 | 78 |
| 1000 W Huntington Ave | 0.11mi | 3/2.0 (-1) | 1,353 (-9%) | 5mo | $115,000 | $85 | 66 |
| 1107 W Washington Ave | 0.26mi | 3/2.0 (-1) | 1,428 (-4%) | 8mo | $238,000 | $167 | 65 |
| 637 Warner | 0.41mi | 3/1.0 (-1) | 1,344 (-10%) | 5mo | $120,000 | $89 | 55 |
| 720 W Matthews | 0.29mi | 3/1.5 (-1) | 1,670 (+12%) | 5mo | $188,500 | $113 | 55 |
| 820 W Oak Ave | 0.44mi | 3/1.0 (-1) | 1,376 (-8%) | 10mo | $115,078 | $84 | 53 |
| 1110 Wilmar Cir | 0.64mi | 4/2.0 | 1,583 (+6%) | 4mo | $174,900 | $110 | 52 |
| 1004 W Cherry Ave | 0.55mi | 3/2.0 (-1) | 1,469 (-2%) | 15mo | $129,900 | $88 | 51 |
| 907 Chestnut St | 0.50mi | 3/1.0 (-1) | 1,345 (-10%) | 13mo | $82,500 | $61 | 44 |
| 512 W Oak Ave | 0.53mi | 3/1.0 (-1) | 1,650 (+11%) | 13mo | $182,500 | $111 | 42 |
| 810 W Strawn Ave | 0.68mi | 3/2.0 (-1) | 1,578 (+6%) | 12mo | $60,000 | $38 | 40 |
| 635 Poplar | 0.67mi | 3/3.0 (-1) | 1,606 (+8%) | 6mo | $160,000 | $100 | 38 |
Match score weights: distance 35% · size 25% · config 20% · recency 20%. Top-matched comps best support the ARV.
Projected returns pro-forma
-3.0% appreciation · 3.64% rent growth · sell at horizon
- IRR
- -5.5%
- Equity multiple
- 0.79×
- Total profit
- $-8,916
- Equity at exit
- $23,096
- IRR
- 4.8%
- Equity multiple
- 1.36×
- Total profit
- $15,563
- Equity at exit
- $13,393
Cash invested: $43,372 (down + closing). Projections, not guarantees.
Landlord ↔ Tenant lean methodology
- Overall (STATE)
- 92 Strongly Landlord-Friendly
- State Arkansas
- 92 Strongly Landlord-Friendly · R+14
- County
- — inherits STATE
- City
- — inherits STATE
ZIP-level market 72401
- Home prices YoY
- -34.2%
- Rents YoY
- 3.6%
- Active inventory
- 295
- Price-to-rent
- 8.9×
Monthly cashflow live
- Estimated rent
- $1,453 medium interval (Pro) →
- Mortgage (P&I)
- −$812
- Tax from tax record
- −$31 /mo · $370/yr
- Insurance
- −$65
- HOA
- −$0
- Vacancy / Maint / Mgmt
- −$305
- Net cashflow
- $241
Break-even live
UW: 25.0% down · 7.5% · 30yr · 1.5% tax · 5.0% vac · 8.0% maint · 8.0% mgmt
Financing live
Cash to close
- Down payment
- $38,725
- Closing costs
- $4,647
- Reserves months
- —
- Total cash needed
- —
Loan-product check · same deal, 3 products live
Conventional
25% down · 7.5% · 30yr
- Down + closing
- —
- Monthly P&I
- —
- Monthly cashflow
- —
- DSCR
- —
- Eligible?
- —
Personal DTI + credit; lowest rate.
DSCR
20% down · 8.5% · 30yr
- Down + closing
- —
- Monthly P&I
- —
- Monthly cashflow
- —
- DSCR
- —
- Eligible?
- —
No personal income docs; deal must DSCR.
Hard money
10% down · 12.0% · 12mo
- Down + closing
- —
- Monthly P&I
- —
- Monthly cashflow
- —
- DSCR
- —
- Eligible?
- —
Short-term bridge; refi at stabilization.
Rent comps 1 comps
| Address | Beds | Baths | Sqft | Rent | $/sqft | DOM | Units | Dist |
|---|---|---|---|---|---|---|---|---|
| 1751 W Nettleton Ave Jonesboro, AR | 2.0–3.0 | 1.0–1.5 | 1000 | $995 | $0.99 | 43d | 1 | 1.05mi |
Listing history 22 events
-
2026-06-19days on market $154,900 Active 30 DOM
-
2026-06-18days on market $154,900 Active 29 DOM
-
2026-06-17days on market $154,900 Active 28 DOM
-
2026-06-16days on market $154,900 Active 27 DOM
-
2026-06-15days on market $154,900 Active 26 DOM
-
2026-06-14days on market $154,900 Active 24 DOM
-
2026-06-13days on market $154,900 Active 23 DOM
-
2026-06-10days on market $154,900 Active 21 DOM
-
2026-06-09days on market $154,900 Active 20 DOM
-
2026-06-09price $154,900 Active 19 DOM
-
2026-06-08days on market $159,000 Active 19 DOM
-
2026-06-07days on market $159,000 Active 18 DOM
-
2026-06-05days on market $159,000 Active 15 DOM
-
2026-06-02days on market $159,000 Active 13 DOM
-
2026-06-01days on market $159,000 Active 12 DOM
-
2026-05-31days on market $159,000 Active 11 DOM
-
2026-05-30days on market $159,000 Active 10 DOM
-
2026-05-20$159,000 Active
-
2023-03-15soldstatus $155,350
-
2009-05-12soldstatus $25,000
-
2006-06-30soldstatus $250,000
-
2003-04-24soldstatus $18,000
ⓘ Source: listings_history table (triggers on properties + properties_extension) + one-shot
backfill from property_details.listing_events for pre-trigger history.
Tax reassessment forecast AR · Resets to sale price
- Current annual tax
- $370 · $31/mo
- Projected year-2 tax
- $991 · $83/mo
- Expected delta
- +$621/yr (+$52/mo · 167.9%)
ⓘ Screening estimate from a state-policy table — verify with the county assessor before closing.
Climate risk First Street
- Flood 1/10 Low FEMA zone X · 0% chance over 30 yrs
- Wildfire 3/10 Moderate
- Heat 5/10 Major 7 d/yr ≥109°F today · 20 d/yr by 30 yrs out
- Wind 3/10 Moderate 7% chance of damaging wind over 30 yrs
- Air quality 1/10 Low 0 unhealthy d/yr today · 0 by 30 yrs out
Nearby sold comps map
Loading sold comps map…
Walkable amenities ~0.75 mi
Loading nearby amenities…
Taxation est. · year 1
- Rental income
- $17,442
- − Mortgage interest
- −$8,677
- − Property taxes
- −$370
- − Insurance
- −$774
- − Repairs & maintenance
- −$1,395
- − Management
- −$1,395
- − Depreciation
- −$4,506
- Taxable income
- $324
- Est. tax owed @ 24.0%
- −$78
- After-tax cash flow
- $2,809/yr
For passive investors: Depreciation is non-cash, so a rental often shows a tax loss while cash-flowing — sheltering income. Rental losses are passive: they offset passive income freely, and up to $25,000/yr can offset ordinary (W-2) income if you actively participate and your MAGI is under $100k (phasing out to $0 by $150k); unused losses carry forward. On sale, claimed depreciation is recaptured at up to 25%, and gains may owe capital-gains tax (a 1031 exchange can defer both). Figures are a year-1 estimate at your 24.0% rate — not tax advice; consult a CPA.
Schools (NCES district)
- District
- Jonesboro School District
- NCES district ID
- 0508280
- Math proficiency
- 28% ▼ -9.00%
- Reading proficiency
- 28% ▼ -8.00%
- Median HH income
- $34,347
- Composite
- 23.06/100
- National rank
- #7967
- State rank
- #169 of 238 in AR
Livability — Jonesboro
- Score
- 65/100
- State rank
- #145
- US rank
- #12692
Category grades
Schools grade is shown separately in the Schools card above.
Census & demographics
- Census place
- Jonesboro, AR
- County
- Craighead County · 97,185 people
- City population
- 91,245
- Metro
- Jonesboro, AR
- Population (ZIP)
- 42,602
- Household income
- $45,329
- Rent vs Own
- Severe rent burden
- 2606.0
Population outlook (Craighead County) Hauer SSP2
- Today (2025)
- 122,235 people
- By 2030
- 131,338 · +7.4%
- By 2040
- 149,862 · +22.6%
- By 2050
- 168,034 · +37.5%
- By 2075
- 208,094 · +70.2%
- By 2100
- 233,251 · +90.8%
Race, ethnicity, and origin ACS 2023
- Neighborhood character
- Diverse neighborhood (Simpson 0.56)
- Race & ethnicity
- White 60% Black 26% Hispanic / Latino 9% Two or more races 7%
- Hispanic origin (detail)
- Mexican 8%
- Common ancestry
- Slovak 2% Italian 1% Lithuanian 1%
- Foreign-born
- 4% · Canada
- Languages at home
- 92% English-only · Spanish 7%
Political lean MEDSL · Craighead
- 2024 margin
- Solid R (+37.4) · D 30.1% · R 67.5% · Other 2.4%
- 2008→2024 swing
- -12.9pp toward R · 2008: -24.5pp · 2024: -37.4pp
- All cycles
- 2024: R+37.4 2020: R+35.4 2016: R+35.2 2012: R+31.1 2008: R+24.5
Not yet ingested
- Civics
- —
Market trends
- HPI YoY
- ▼ -108.25%
- Current HPI
- 208.2079
- Rent YoY
- ▲ 3.64%
- Metro
- Jonesboro, AR
- State GDP YoY
- ▲ 3.80%
- F500 in state
- 10
Industry mix (Fortune 500 HQ in AR)
| Industry | F500 HQs | Revenue |
|---|---|---|
| Retail | 1 | $681B |
|
||
| Food / Agriculture | 1 | $53B |
|
||
| Retail / Energy | 1 | $22B |
|
||
| Transportation / Logistics | 1 | $12B |
|
||
| Energy | 1 | $4B |
|
||
Price history
+783.3% since first listed5 events — show timeline
- 2026-05-20 Listed $159,000 NEABOR MLS
- 2023-03-15 Sold (Public Records) $155,350 Public Records
- 2009-05-12 Sold (Public Records) $25,000 Public Records
- 2006-06-30 Sold (Public Records) $250,000 Public Records
- 2003-04-24 Sold (Public Records) $18,000 Public Records
Property tax history
+6.2%/yrLatest (2025): $370 · +7.7% YoY. Source: county tax records.
Cash-flow waterfall
monthlySold comps — $/sqft
last 12 mo · ≤1 miLoading sold comps…