 Multi-family
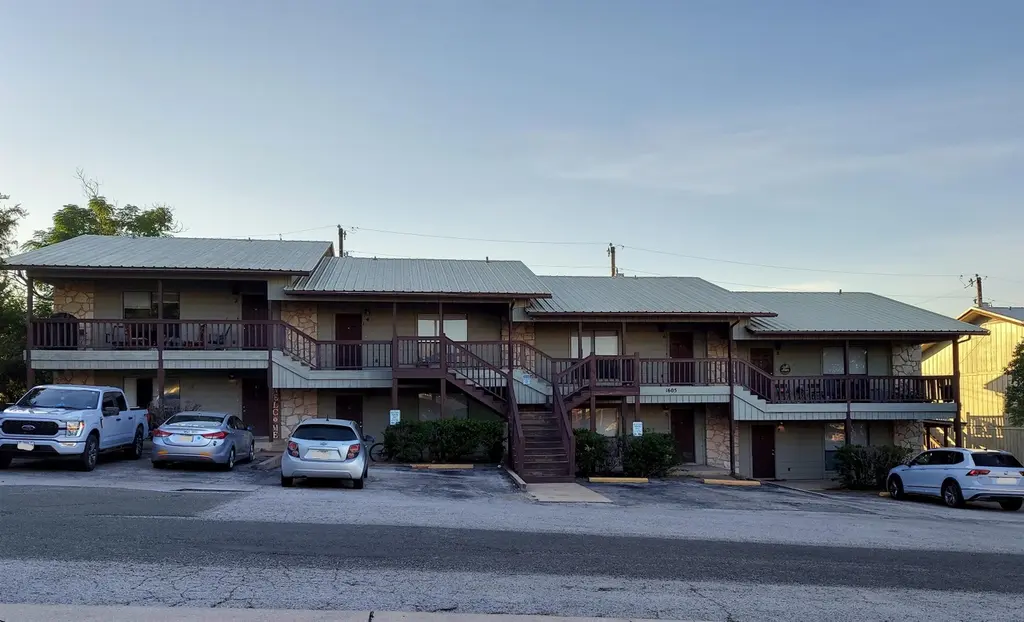
1605 Stony Ridge Rdg · Marble Falls, TX
Flood risk 1/10 · Minimal
- FEMA flood zone
- X (unshaded)
- Chance of flooding over 30 yrs
- 0.0%
- Est. flood insurance / yr
- $507 – $1,088
Fire risk 4/10 · Minor
- Est. fire insurance / yr
- $1,222 – $2,270
Heat risk 8/10 · Major
- Hot days now (above 107°F)
- 7 days/yr
- Hot days in 30 yrs
- 21 days/yr
Wind risk 6/10 · Moderate
- Chance of severe wind over 30 yrs
- 57.0%
Air-quality risk 1/10 · Minimal
- Unhealthy air days now
- 0 days/yr
- Unhealthy air days in 30 yrs
- 0 days/yr
Risk factors via First Street. Map © Google.
Why this score? — see what drove the D grade
The composite is a weighted blend of 9 inputs, each scored 0–100. Each bar is that input's sub-score; the figure is the points it added to the 100-point composite (weight × sub-score).
- Cash flow +15.0/30.0
- ARV discount +7.5/15.0
- 1% rule +5.0/10.0
- DSCR +5.0/10.0
- Livability +3.5/5.0
- Schools +3.0/10.0
- Condition / age +2.5/5.0
- Rent growth +2.3/5.0
- Appreciation +0.0/10.0
$1,075
🖨 Deal sheet 📄 Offer letter ✓ Due diligence
Multi-family units
County records classify this as Multi-Family (5+ Unit). Listing-text estimate: 1 unit. estimate disagrees with records
5+ unit building — per-unit beds/baths from public records are typically unavailable; the breakdown below (if shown) is an estimate from the listing text.
Listing remarks MLS
Spacious and well-maintained 2-bedroom, 1-bath apartment offering approximately 950 square feet of comfortable living space. Conveniently located within walking distance to Office Depot and Home Depot, this property provides easy access to shopping and everyday essentials. The unit features a fully equipped kitchen with refrigerator, stove, and dishwasher, plus the added convenience of an in-unit washer and dryer. Recent updates include fresh paint, and more, creating a clean and modern feel throughout. Joan Blankenship, LREB, is a partner in TJM Properties, LP, owner of this property.
Key facts
- Recent updates
- 0.3 acre lot
- Built 1984
Tags
Neighborhood map
What this means for you Summary
Snapshot
- This is a ?-bed/1.0-bath multifamily listed at $1k.
Deal economics
- At list price, monthly cash flow is $2k ($26k/yr) — positive.
- The deal already cash-flows at list — no discount required.
- Meets the 1% rule at list price ($3k rent vs $1k).
- Recommended offer: $1k (6.0% below list) — sets the bar for market timing.
- Cap rate 2436.3% vs local median 2.7% in Marble Falls — top-decile yield for the area; either an underpriced asset or a hidden risk that comps aren't pricing in. Stress-test before assuming the spread holds.
Location & tenants
- Location reads 70/100 on livability (#367 in TX) — a middle-class / working-renter tenant base. Strengths: cost of living A+, health & safety A+, housing A; Watch: crime C-, schools D, employment D.
- Marble Falls ISD (town): math 32% / reading 38% proficiency, ranked #511 of 826 in TX (top 62%) — families likely to look elsewhere, expect single-tenant / working-renter base with shorter leases.
- Market conditions: Rents soft (-0.6%/yr); 752 active listings in the ZIP; 891 units permitted in Burnet County in 2024 (76 in 5+ unit buildings).
- This rent runs 45% of the median local income ($74k/yr) — at the standard rent-burdened threshold; future hikes will face affordability resistance.
Forward outlook
- Local home prices are declining (-3.0%/yr); year-one equity from $7 of loan paydown is wiped out by about $32 of value loss. Plan a longer hold.
- Burnet County population projected at +22% by 2050 — long-run rental-demand tailwind backs the buy-and-hold thesis.
- At projected returns (-3.0% appreciation + 0.0% rent growth), your $301 cash investment doubles in ~1 year — after that, you're playing with house money.
Negotiation context
- It's been on market 87 days — a 6% lower offer ($1k) is reasonable based on typical stale-listing flexibility.
- 5 sale attempts since 5y ago with the ask held roughly flat each time — persistent listings suggest the price (not the market) is what's stuck; bring a comps-based counter.
Risks & watch-outs
- Climate carrying-cost: major wind risk, 57% chance of damaging wind over 30y; extreme-heat days projected 7→21/yr by 2055 (HVAC capex compounding) — expect insurance premiums to compound above CPI over the hold.
Questions for the listing agent
- It's been on market 87 days. Have you received any prior offers? Is the seller open to a 6% concession, seller financing, or rate buy-down credit?
- Why hasn't it sold? Are there any deal-killer items the seller is aware of (foundation, flood, title, zoning, code violations)?
- Is there a deadline driving the sale (1031 exchange, divorce, estate, relocation)? That informs how much negotiation room exists.
- Schools are D-rated, which usually means shorter tenancies and higher turnover. Who's the typical renter profile here, and what's been the actual vacancy rate?
- The area grade is low — what's the realistic commute time and amenity access for the typical tenant pool here? Any planned neighborhood developments (good or bad) we should know about?
- What's the average days-on-market for RENTAL listings here right now (not sales)? A rising rental-DOM trend means longer vacancies and softer asking-rent achievability than the comps imply.
- What's the recent tenant-quality profile in this submarket — average credit score on applications, eviction rate, late-payment / NSF rate, and stable-employment percentage? A property-management company in the area should have these aggregated.
- How much new apartment / multifamily construction is in the pipeline within 1–3 miles? Heavy new supply (>2% of stock underway) typically softens rents 12–24 months out; light construction supports rent growth.
Investment metrics
- 1% rule
- 257.21% ✓
- Cap rate
- 2436.34%
- Cash-on-cash
- 8678.75%
- DSCR
- 387.16
- GRM
- 0.0
CMA / ARV
No comps found within radius.
Projected returns pro-forma
-3.0% appreciation · 0.0% rent growth · sell at horizon
- IRR
- —
- Equity multiple
- 434.27×
- Total profit
- $130,414
- Equity at exit
- $160
- IRR
- —
- Equity multiple
- 867.94×
- Total profit
- $260,949
- Equity at exit
- $93
Cash invested: $301 (down + closing). Projections, not guarantees.
Landlord ↔ Tenant lean methodology
- Overall (STATE)
- 87 Strongly Landlord-Friendly
- State Texas
- 87 Strongly Landlord-Friendly · R+5
- County
- — inherits STATE
- City
- — inherits STATE
ZIP-level market 78654
- Home prices YoY
- -31.8%
- Rents YoY
- -0.6%
- Active inventory
- 752
- Price-to-rent
- 0.1×
Monthly cashflow live
- Estimated rent
- $2,765 medium interval (Pro) →
- Mortgage (P&I)
- −$6
- Tax est. 1.5%
- −$1 /mo · $16/yr
- Insurance
- −$0
- HOA
- −$0
- Vacancy / Maint / Mgmt
- −$581
- Net cashflow
- $2,177
Break-even live
2-unit breakdown (identical units grouped — click to expand)
| Units | Beds | Baths | Est. rent |
|---|---|---|---|
| 2× units | 2 | 1 | $2,764 |
| #1 | 2 | 1 | $1,382 |
| #2 | 2 | 1 | $1,382 |
| Total (2 units) | $2,765 | ||
UW: 25.0% down · 7.5% · 30yr · 1.5% tax · 5.0% vac · 8.0% maint · 8.0% mgmt
Financing live
Cash to close
- Down payment
- $269
- Closing costs
- $32
- Reserves months
- —
- Total cash needed
- —
Loan-product check · same deal, 3 products live
Conventional
25% down · 7.5% · 30yr
- Down + closing
- —
- Monthly P&I
- —
- Monthly cashflow
- —
- DSCR
- —
- Eligible?
- —
Personal DTI + credit; lowest rate.
DSCR
20% down · 8.5% · 30yr
- Down + closing
- —
- Monthly P&I
- —
- Monthly cashflow
- —
- DSCR
- —
- Eligible?
- —
No personal income docs; deal must DSCR.
Hard money
10% down · 12.0% · 12mo
- Down + closing
- —
- Monthly P&I
- —
- Monthly cashflow
- —
- DSCR
- —
- Eligible?
- —
Short-term bridge; refi at stabilization.
Listing history 27 events
-
2026-06-18days on market $1,075 Active 87 DOM
-
2026-06-17days on market $1,075 Active 86 DOM
-
2026-06-16days on market $1,075 Active 85 DOM
-
2026-06-15days on market $1,075 Active 84 DOM
-
2026-06-13days on market $1,075 Active 82 DOM
-
2026-06-13days on market $1,075 Active 81 DOM
-
2026-06-09days on market $1,075 Active 78 DOM
-
2026-06-08days on market $1,075 Active 77 DOM
-
2026-06-07days on market $1,075 Active 76 DOM
-
2026-06-05days on market $1,075 Active 73 DOM
-
2026-06-03days on market $1,075 Active 72 DOM
-
2026-06-01days on market $1,075 Active 70 DOM
-
2026-05-31days on market $1,075 Active 69 DOM
-
2026-03-23$1,075 Active 592-char remark
Show marketing remark (592 chars)
Spacious and well-maintained 2-bedroom, 1-bath apartment offering approximately 950 square feet of comfortable living space. Conveniently located within walking distance to Office Depot and Home Depot, this property provides easy access to shopping and everyday essentials. The unit features a fully equipped kitchen with refrigerator, stove, and dishwasher, plus the added convenience of an in-unit washer and dryer. Recent updates include fresh paint, and more, creating a clean and modern feel throughout. Joan Blankenship, LREB, is a partner in TJM Properties, LP, owner of this property.
-
2025-05-07soldstatus 324-char remark
Show marketing remark (324 chars)
Spacious two bedroom, one bath apartment within walking distance to Office Depot and Home Depot. 950 square feet. Refrigerator, stove, dishwasher, washer & dryer provided. Updated flooring, paint and more. Available for quick move in. Joan Blankenship, LREB, is a partner in TJM Properties, LP, owner of this property.
-
2025-04-18$1,075 324-char remark
Show marketing remark (324 chars)
Spacious two bedroom, one bath apartment within walking distance to Office Depot and Home Depot. 950 square feet. Refrigerator, stove, dishwasher, washer & dryer provided. Updated flooring, paint and more. Available for quick move in. Joan Blankenship, LREB, is a partner in TJM Properties, LP, owner of this property.
-
2025-02-03soldstatus Closed
-
2025-01-17status Pending
-
2024-11-08historical
-
2024-11-07soldstatus Closed
-
2024-10-18status Pending
-
2024-08-30price $1,075
-
2024-08-30price $1,075
-
2024-08-07$1,100 Active
-
2024-08-07$1,100 Active
-
2023-03-23soldstatus
-
2021-07-06$875
ⓘ Source: listings_history table (triggers on properties + properties_extension) + one-shot
backfill from property_details.listing_events for pre-trigger history.
Climate risk First Street
- Flood 1/10 Low FEMA zone X (unshaded) · 0% chance over 30 yrs
- Wildfire 4/10 Moderate
- Heat 8/10 Severe 7 d/yr ≥107°F today · 21 d/yr by 30 yrs out
- Wind 6/10 Major 57% chance of damaging wind over 30 yrs
- Air quality 1/10 Low 0 unhealthy d/yr today · 0 by 30 yrs out
Nearby sold comps map
Loading sold comps map…
Walkable amenities ~0.75 mi
Loading nearby amenities…
Taxation est. · year 1
- Rental income
- $33,180
- − Mortgage interest
- −$60
- − Property taxes
- −$16
- − Insurance
- −$5
- − Repairs & maintenance
- −$2,654
- − Management
- −$2,654
- − Depreciation
- −$31
- Taxable income
- $27,758
- Est. tax owed @ 24.0%
- −$6,662
- After-tax cash flow
- $19,461/yr
For passive investors: Depreciation is non-cash, so a rental often shows a tax loss while cash-flowing — sheltering income. Rental losses are passive: they offset passive income freely, and up to $25,000/yr can offset ordinary (W-2) income if you actively participate and your MAGI is under $100k (phasing out to $0 by $150k); unused losses carry forward. On sale, claimed depreciation is recaptured at up to 25%, and gains may owe capital-gains tax (a 1031 exchange can defer both). Figures are a year-1 estimate at your 24.0% rate — not tax advice; consult a CPA.
Schools (NCES district)
- District
- Marble Falls ISD
- NCES district ID
- 4829010
- Math proficiency
- 32% ▼ -8.00%
- Reading proficiency
- 38% ▼ -4.00%
- Median HH income
- $49,663
- Composite
- 30.3/100
- National rank
- #6278
- State rank
- #511 of 826 in TX
Livability — Marble Falls
- Score
- 70/100
- State rank
- #367
- US rank
- #7802
Category grades
Schools grade is shown separately in the Schools card above.
Census & demographics
- Census place
- Marble Falls, TX
- County
- Burnet County · 35,210 people
- City population
- 20,650
- Metro
- Austin-Round Rock-Georgetown, TX
- Population (ZIP)
- 20,650
- Household income
- $74,130
- Rent vs Own
- Severe rent burden
- 354.0
Population outlook (Burnet County) Hauer SSP2
- Today (2025)
- 50,492 people
- By 2030
- 52,995 · +5.0%
- By 2040
- 57,528 · +13.9%
- By 2050
- 61,444 · +21.7%
- By 2075
- 71,098 · +40.8%
- By 2100
- 74,634 · +47.8%
Race, ethnicity, and origin ACS 2023
- Neighborhood character
- Predominantly White (68%)
- Race & ethnicity
- White 68% Hispanic / Latino 28% Two or more races 8%
- Hispanic origin (detail)
- Mexican 24%
- Common ancestry
- Serbian 2% Italian 2% Slovak 2%
- Foreign-born
- 8% · Canada
- Languages at home
- 81% English-only · Spanish 18% Other Indo-European 1%
Political lean MEDSL · Burnet
- 2024 margin
- Solid R (+55.7) · D 21.7% · R 77.4%
- 2008→2024 swing
- -11.6pp toward R · 2008: -44.1pp · 2024: -55.7pp
- All cycles
- 2024: R+55.7 2020: R+53.1 2016: R+56.8 2012: R+54.6 2008: R+44.1
Not yet ingested
- Civics
- —
Market trends
- HPI YoY
- ▼ -118.02%
- Current HPI
- 252.9861
- Rent YoY
- ▼ -0.62%
- Metro
- Austin-Round Rock-Georgetown, TX
- State GDP YoY
- ▲ 3.95%
- F500 in state
- 110
Industry mix (Fortune 500 HQ in TX)
| Industry | F500 HQs | Revenue |
|---|---|---|
| Energy | 16 | $1,198B |
|
||
| Technology | 5 | $198B |
|
||
| Engineering / Construction | 4 | $72B |
|
||
| Energy Services | 3 | $60B |
|
||
| Utilities | 3 | $41B |
|
||
| Healthcare | 2 | $330B |
|
||
Price history
-2.3% since first listed14 events — show timeline
- 2026-03-23 Listed $1,075 HLMLS as distributed by MLS GRID
- 2025-05-07 Sold (MLS) — HLMLS as distributed by MLS GRID
- 2025-04-18 Listed $1,075 HLMLS as distributed by MLS GRID
- 2025-02-03 Sold (MLS) — HLMLS as distributed by MLS GRID
- 2025-01-17 Pending — HLMLS as distributed by MLS GRID
- 2024-11-08 Delisted — HLMLS as distributed by MLS GRID
- 2024-11-07 Sold (MLS) — HLMLS as distributed by MLS GRID
- 2024-10-18 Pending — HLMLS as distributed by MLS GRID
- 2024-08-30 Price Changed $1,075 HLMLS as distributed by MLS GRID
- 2024-08-30 Price Changed $1,075 HLMLS as distributed by MLS GRID
- 2024-08-07 Listed $1,100 HLMLS as distributed by MLS GRID
- 2024-08-07 Listed $1,100 HLMLS as distributed by MLS GRID
- 2023-03-23 Sold (MLS) — HLMLS as distributed by MLS GRID
- 2021-07-06 Listed $875 HLMLS as distributed by MLS GRID
Cash-flow waterfall
monthlySold comps — $/sqft
last 12 mo · ≤1 miLoading sold comps…