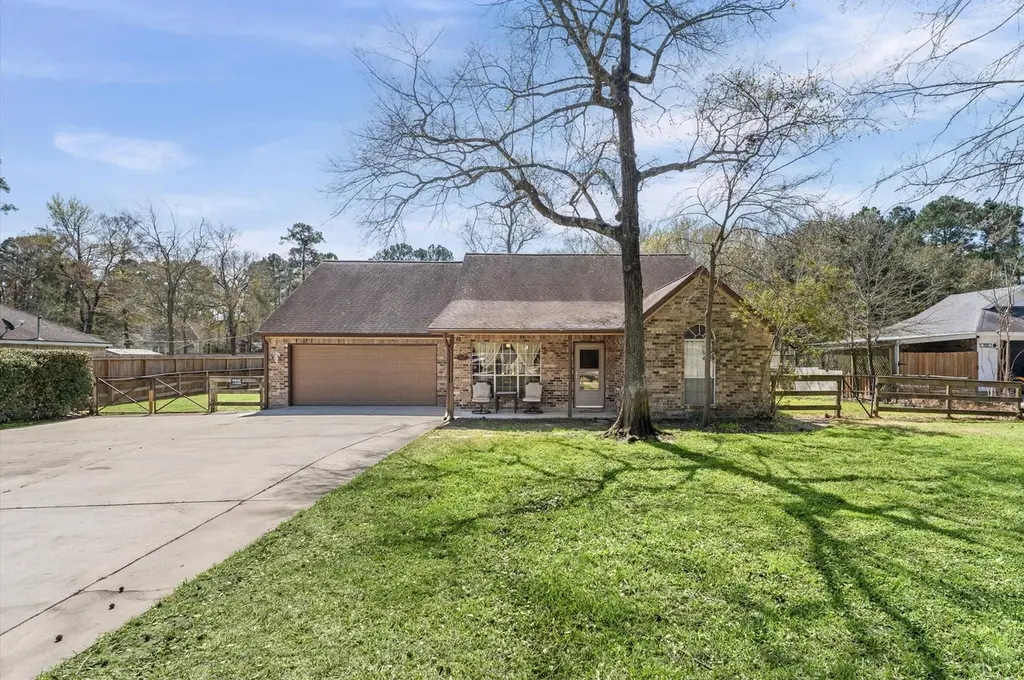
7307 Nickaburr Creek Dr · The Woodlands, TX
Flood risk 3/10 · Minor
- FEMA flood zone
- X (unshaded)
- Chance of flooding over 30 yrs
- 0.2%
- Est. flood insurance / yr
- $507 – $1,088
Fire risk 2/10 · Minimal
- Est. fire insurance / yr
- $1,222 – $2,270
Heat risk 8/10 · Major
- Hot days now (above 111°F)
- 7 days/yr
- Hot days in 30 yrs
- 24 days/yr
Wind risk 8/10 · Major
- Chance of severe wind over 30 yrs
- 99.0%
Air-quality risk 2/10 · Minimal
- Unhealthy air days now
- 2 days/yr
- Unhealthy air days in 30 yrs
- 2 days/yr
Risk factors via First Street. Map © Google.
Why this score? — see what drove the D grade
The composite is a weighted blend of 9 inputs, each scored 0–100. Each bar is that input's sub-score; the figure is the points it added to the 100-point composite (weight × sub-score).
- ARV discount +10.3/15.0
- Appreciation +10.0/10.0
- Cash flow +6.0/30.0
- Livability +4.5/5.0
- Schools +3.9/10.0
- Rent growth +2.6/5.0
- Condition / age +2.5/5.0
- 1% rule +1.6/10.0
- DSCR +0.4/10.0
$344,900
🖨 Deal sheet (PDF) 📄 Offer letter ✓ Due diligence
Listing remarks MLS
Custom-built and made for real life—this 3 bed / 2 bath / 2-car home shines with a bright great room, cozy fireplace, and soaring cathedral ceilings. The split floor plan gives everyone space and privacy, making it a great fit. Your primary suite features double closets, a garden tub, and a separate shower. Step outside to enjoy a large yard plus a 12x24 workshop with electricity—perfect for projects, hobbies, or extra storage. Bring the toys, too: there’s a triple concrete driveway with RV parking and a 29x11 covered back patio ready for BBQs and weekend hangouts. Located in Magnolia ISD!
Key facts
- Double closets
- Cathedral ceilings
- Split floor plan
Tags
Neighborhood map
What this means for you Summary
Snapshot
- This is a 3-bed/2.0-bath single-family listed at $345k.
Deal economics
- At list price, monthly cash flow is $-656 ($-8k/yr) — negative.
- To cash-flow at today's rent, offer at most $229k (33.6% below list).
- To meet the 1% rule (rent ≥ 1% of price), the offer needs to be $227k (34.1% below list).
- Recommended offer: $227k (34.1% below list) — sets the bar for 1% rule.
- Cap rate 4.0% vs local median 2.3% in The Woodlands — top-decile yield for the area; either an underpriced asset or a hidden risk that comps aren't pricing in. Stress-test before assuming the spread holds.
Location & tenants
- Location reads 91/100 on livability (#1 in TX, #47 nationally) — a professional / high-income tenant draw. Strengths: amenities A+, commute A+, employment A+; Watch: cost of living D-.
- Magnolia ISD (rural): math 42% / reading 45% proficiency, ranked #247 of 826 in TX (top 30%) — families likely to look elsewhere, expect single-tenant / working-renter base with shorter leases.
- Zoned schools: Bear Branch El (math 48% / reading 51%, grade D, #865 of 4,322 statewide, top 21%, 579 students, 28% FRL); Bear Branch J H (math 44% / reading 46%, grade D, #479 of 1,662 statewide, top 29%, 1,076 students, 37% FRL); Magnolia H S (math 47% / reading 62%, grade C-, #379 of 1,632 statewide, top 26%, 2,248 students, 31% FRL).
- Market conditions: Rents flat; 1622 active listings in the ZIP; 13 comparable units currently listed for rent nearby; rentals leasing fast (median 7d on market — plan ~1-2 weeks tenant-placement turnaround); high-income renter base; 13,259 units permitted in Montgomery County in 2024 (1,402 in 5+ unit buildings).
Forward outlook
- In year one you build about $37k of equity ($2k loan paydown + $34k appreciation (10.0% local appreciation)).
- Montgomery County population projected at +65% by 2050 — long-run rental-demand tailwind backs the buy-and-hold thesis.
- By year 2, paydown + projected appreciation supports a ~$59k cash-out refi (75% LTV) — recoverable capital for the next deal without selling this one.
Negotiation context
- It's been on market 106 days — a 9% lower offer ($314k) is reasonable based on typical stale-listing flexibility.
- 2 sale attempts since 23y ago with the ask held roughly flat each time — persistent listings suggest the price (not the market) is what's stuck; bring a comps-based counter.
Risks & watch-outs
- Climate carrying-cost: severe wind risk, 99% chance of damaging wind over 30y; extreme-heat days projected 7→24/yr by 2055 (HVAC capex compounding) — expect insurance premiums to compound above CPI over the hold.
Questions for the listing agent
- What do current leases actually rent for vs. the listed asking? Can we see a recent rent roll and the last 12 months of T-12 income?
- It's been on market 106 days. Have you received any prior offers? Is the seller open to a 34% concession, seller financing, or rate buy-down credit?
- What does the HOA fee cover, when was the last increase, and are there any pending special assessments or reserve-fund shortfalls?
- Why hasn't it sold? Are there any deal-killer items the seller is aware of (foundation, flood, title, zoning, code violations)?
- Is there a deadline driving the sale (1031 exchange, divorce, estate, relocation)? That informs how much negotiation room exists.
- Schools are A-rated — typically a magnet for longer-tenancy family renters. What's the average tenant stay here, and is there a school-zone premium baked into asking?
- The area grade is low — what's the realistic commute time and amenity access for the typical tenant pool here? Any planned neighborhood developments (good or bad) we should know about?
- What's the average days-on-market for RENTAL listings here right now (not sales)? A rising rental-DOM trend means longer vacancies and softer asking-rent achievability than the comps imply.
- What's the recent tenant-quality profile in this submarket — average credit score on applications, eviction rate, late-payment / NSF rate, and stable-employment percentage? A property-management company in the area should have these aggregated.
- How much new for-sale + rental construction is in the pipeline within 1–3 miles? Heavy new supply typically softens prices + rents 12–24 months out; constrained supply supports both.
Investment metrics
- 1% rule
- 0.66% ✗
- Cap rate
- 4.01%
- Cash-on-cash
- -8.15%
- DSCR
- 0.64
- GRM
- 12.6
CMA / ARV
- ARV (median comp)
- $368,201
- List price
- $344,900
- Delta
- -6.33%
- Verdict
- FAIR
- Comps
- 20 within 1.0 mi
Show comp detail 12 sales within ~0.75 mi
| Address | Dist | Beds/Ba | Sqft | Sold | Price | $/sf | Match |
|---|---|---|---|---|---|---|---|
| 7402 Nickaburr Creek Dr | 0.09mi | 3/2.0 | 1,824 (-2%) | 6mo | $339,999 | $186 | 87 |
| 7407 Nickaburr Creek Dr | 0.09mi | 4/2.5 (+1) | 1,874 (+1%) | 4mo | $399,000 | $213 | 84 |
| 7415 Charred Pine Dr | 0.15mi | 3/2.0 | 1,810 (-3%) | 7mo | $335,000 | $185 | 82 |
| 7219 Nickaburr Creek Dr | 0.06mi | 3/2.5 | 1,780 (-4%) | 8mo | $349,999 | $197 | 82 |
| 7115 Nickaburr Creek Dr | 0.15mi | 3/2.0 | 1,719 (-8%) | 6mo | $300,000 | $175 | 75 |
| 33127 Cottonwood Bnd | 0.44mi | 4/2.5 (+1) | 1,834 (-2%) | 1mo | $225,000 | $123 | 69 |
| 8739 Ute Creek Ln | 0.64mi | 3/2.0 | 1,846 (-1%) | 0mo | $310,000 | $168 | 68 |
| 7406 Revelwood Dr | 0.31mi | 3/2.0 | 1,650 (-11%) | 0mo | $339,900 | $206 | 66 |
| 8641 Cimarron Mesa Ln | 0.57mi | 4/2.0 (+1) | 1,962 (+5%) | 7mo | $290,000 | $148 | 54 |
| 8918 James Ct | 0.66mi | 3/2.0 | 1,974 (+6%) | 7mo | $534,499 | $271 | 53 |
| 3812 Cimarron Gap Ln | 0.69mi | 3/2.0 | 1,687 (-9%) | 9mo | $254,990 | $151 | 45 |
| 7226 Basque Country Dr | 0.71mi | 4/2.0 (+1) | 2,124 (+14%) | 8mo | $295,000 | $139 | 31 |
Match score weights: distance 35% · size 25% · config 20% · recency 20%. Top-matched comps best support the ARV.
Projected returns pro-forma
10.0% appreciation · 0.32% rent growth · sell at horizon
- IRR
- 17.9%
- Equity multiple
- 2.45×
- Total profit
- $140,164
- Equity at exit
- $310,713
- IRR
- 16.3%
- Equity multiple
- 5.50×
- Total profit
- $434,933
- Equity at exit
- $670,065
Cash invested: $96,572 (down + closing). Projections, not guarantees.
Landlord ↔ Tenant lean methodology
- Overall (STATE)
- 87 Strongly Landlord-Friendly
- State Texas
- 87 Strongly Landlord-Friendly · R+5
- County
- — inherits STATE
- City
- — inherits STATE
ZIP-level market 77354
- Home prices YoY
- 2.4%
- Rents YoY
- 0.3%
- Active inventory
- 1622
- Price-to-rent
- 12.6×
Monthly cashflow live
- Estimated rent
- $2,273 high interval (Pro) →
- Mortgage (P&I)
- −$1,809
- Tax from tax record
- −$479 /mo · $5,742/yr
- Insurance
- −$144
- HOA
- −$21
- Vacancy / Maint / Mgmt
- −$477
- Net cashflow
- $-656
Break-even live
Sensitivity live
| Price | -10% $-461 | -5% $-558 | +0% $-656 | +5% $-754 | +10% $-851 |
|---|---|---|---|---|---|
| Rent | -10% $-836 | -5% $-746 | +0% $-656 | +5% $-566 | +10% $-476 |
| Rate | -1.0pp $-482 | -0.5pp $-568 | base $-656 | +0.5pp $-745 | +1.0pp $-836 |
UW: 25.0% down · 7.5% · 30yr · 1.5% tax · 5.0% vac · 8.0% maint · 8.0% mgmt
Financing live
Cash to close
- Down payment
- $86,225
- Closing costs
- $10,347
- Reserves months
- —
- Total cash needed
- —
Loan-product check · same deal, 3 products live
Conventional
25% down · 7.5% · 30yr
- Down + closing
- —
- Monthly P&I
- —
- Monthly cashflow
- —
- DSCR
- —
- Eligible?
- —
Personal DTI + credit; lowest rate.
DSCR
20% down · 8.5% · 30yr
- Down + closing
- —
- Monthly P&I
- —
- Monthly cashflow
- —
- DSCR
- —
- Eligible?
- —
No personal income docs; deal must DSCR.
Hard money
10% down · 12.0% · 12mo
- Down + closing
- —
- Monthly P&I
- —
- Monthly cashflow
- —
- DSCR
- —
- Eligible?
- —
Short-term bridge; refi at stabilization.
Rent comps 13 comps
| Address | Beds | Baths | Sqft | Rent | $/sqft | DOM | Units | Dist |
|---|---|---|---|---|---|---|---|---|
| 33200 Forest West St Magnolia, TX | 1.0–3.0 | 1.5–2.5 | 1307 | $4,065 | $3.11 | 0d | 22 | 0.44mi |
| 7210 Alava Dr Magnolia, TX | 4.0 | 3.0 | 2031 | $2,235 | $1.10 | 45d | 1 | 0.76mi |
| 10333 Research Forest Dr Unit 3047 Magnolia, TX | 3.0 | 2.0 | 1377 | $2,383 | $1.73 | 13d | 1 | 0.80mi |
| 10333 Research Forest Dr Unit 3228 Magnolia, TX | 3.0 | 2.0 | 1377 | $2,332 | $1.69 | 0d | 1 | 0.91mi |
| 10333 Research Forest Dr Unit 10366 Magnolia, TX | 3.0 | 2.0 | 1377 | $2,372 | $1.72 | 12d | 1 | 0.91mi |
| 33123 Oak Heights Pl Magnolia, TX | 4.0 | 2.5 | 1896 | $2,270 | $1.20 | 7d | 1 | 0.99mi |
| 33139 Oak Heights Pl Magnolia, TX | 4.0 | 2.5 | 1896 | $2,270 | $1.20 | 7d | 1 | 0.99mi |
| 33130 Oak Heights Pl Magnolia, TX | 4.0 | 2.5 | 1896 | $2,270 | $1.20 | 7d | 1 | 1.00mi |
| 33154 Oak Heights Pl Magnolia, TX | 4.0 | 2.5 | 1896 | $2,345 | $1.24 | 19d | 1 | 1.00mi |
| 33154 Oak Heights Pl Magnolia, TX | 4.0 | 2.5 | 1896 | $2,345 | $1.24 | 23d | 1 | 1.00mi |
| 33154 Oak Heights Pl Magnolia, TX | 3.0–4.0 | 2.5 | 1896 | $2,195 | $1.16 | 0d | 6 | 1.00mi |
| 33150 Willow Heights Ln Magnolia, TX | 4.0 | 2.5 | 1896 | $2,270 | $1.20 | 7d | 1 | 1.03mi |
| 33146 Willow Heights Ln Magnolia, TX | 4.0 | 2.5 | 1896 | $2,270 | $1.20 | 7d | 1 | 1.03mi |
HOA detail
- Monthly dues
- $21 · $252/yr
- Likely covers
- electric
Listing history 17 events
-
2026-06-17days on market $344,900 Active 106 DOM
-
2026-06-16days on market $344,900 Active 105 DOM
-
2026-06-15days on market $344,900 Active 104 DOM
-
2026-06-13days on market $344,900 Active 102 DOM
-
2026-06-09days on market $344,900 Active 98 DOM
-
2026-06-08days on market $344,900 Active 97 DOM
-
2026-06-07days on market $344,900 Active 96 DOM
-
2026-06-04days on market $344,900 Active 93 DOM
-
2026-06-03days on market $344,900 Active 92 DOM
-
2026-06-02days on market $344,900 Active 91 DOM
-
2026-06-01days on market $344,900 Active 90 DOM
-
2026-05-31days on market $344,900 Active 89 DOM
-
2026-05-14price $344,900 615-char remark
Show marketing remark (615 chars)
Custom-built and made for real life—this 3 bed / 2 bath / 2-car home shines with a bright great room, cozy fireplace, and soaring cathedral ceilings. The split floor plan gives everyone space and privacy, making it a great fit. Your primary suite features double closets, a garden tub, and a separate shower. Step outside to enjoy a large yard plus a 12x24 workshop with electricity—perfect for projects, hobbies, or extra storage. Bring the toys, too: there’s a triple concrete driveway with RV parking and a 29x11 covered back patio ready for BBQs and weekend hangouts. Located in Magnolia ISD!
-
2026-05-14price $345,000 615-char remark
Show marketing remark (615 chars)
Custom-built and made for real life—this 3 bed / 2 bath / 2-car home shines with a bright great room, cozy fireplace, and soaring cathedral ceilings. The split floor plan gives everyone space and privacy, making it a great fit. Your primary suite features double closets, a garden tub, and a separate shower. Step outside to enjoy a large yard plus a 12x24 workshop with electricity—perfect for projects, hobbies, or extra storage. Bring the toys, too: there’s a triple concrete driveway with RV parking and a 29x11 covered back patio ready for BBQs and weekend hangouts. Located in Magnolia ISD!
-
2026-03-03$350,000 Active 615-char remark
Show marketing remark (615 chars)
Custom-built and made for real life—this 3 bed / 2 bath / 2-car home shines with a bright great room, cozy fireplace, and soaring cathedral ceilings. The split floor plan gives everyone space and privacy, making it a great fit. Your primary suite features double closets, a garden tub, and a separate shower. Step outside to enjoy a large yard plus a 12x24 workshop with electricity—perfect for projects, hobbies, or extra storage. Bring the toys, too: there’s a triple concrete driveway with RV parking and a 29x11 covered back patio ready for BBQs and weekend hangouts. Located in Magnolia ISD!
-
2003-11-01historical
-
2003-08-14$142,000
ⓘ Source: listings_history table (triggers on properties + properties_extension) + one-shot
backfill from property_details.listing_events for pre-trigger history.
Tax reassessment forecast TX · Resets to sale price
- Current annual tax
- $5,742 · $479/mo
- Projected year-2 tax
- $6,312 · $526/mo
- Expected delta
- +$569/yr (+$47/mo · 9.9%)
ⓘ Screening estimate from a state-policy table — verify with the county assessor before closing.
Climate risk First Street
- Flood 3/10 Moderate FEMA zone X (unshaded) · 20% chance over 30 yrs
- Wildfire 2/10 Low
- Heat 8/10 Severe 7 d/yr ≥111°F today · 24 d/yr by 30 yrs out
- Wind 8/10 Severe 99% chance of damaging wind over 30 yrs
- Air quality 2/10 Low 2 unhealthy d/yr today · 2 by 30 yrs out
Nearby sold comps map
Loading sold comps map…
Walkable amenities ~0.75 mi
Loading nearby amenities…
Taxation est. · year 1
- Rental income
- $27,279
- − Mortgage interest
- −$19,320
- − Property taxes
- −$5,742
- − Insurance
- −$1,724
- − Repairs & maintenance
- −$2,182
- − Management
- −$2,182
- − HOA
- −$252
- − Depreciation
- −$10,033
- Taxable loss
- −$14,158
- Est. tax savings @ 24.0%
- +$3,398
- After-tax cash flow
- $-4,475/yr
For passive investors: Depreciation is non-cash, so a rental often shows a tax loss while cash-flowing — sheltering income. Rental losses are passive: they offset passive income freely, and up to $25,000/yr can offset ordinary (W-2) income if you actively participate and your MAGI is under $100k (phasing out to $0 by $150k); unused losses carry forward. On sale, claimed depreciation is recaptured at up to 25%, and gains may owe capital-gains tax (a 1031 exchange can defer both). Figures are a year-1 estimate at your 24.0% rate — not tax advice; consult a CPA.
Schools (NCES district)
- District
- Magnolia ISD
- NCES district ID
- 4828740
- Math proficiency
- 42% ▼ -7.00%
- Reading proficiency
- 45% ▼ -4.00%
- Median HH income
- $71,692
- Composite
- 39.46/100
- National rank
- #3958
- State rank
- #247 of 826 in TX
Livability — The Woodlands
- Score
- 91/100
- State rank
- #1
- US rank
- #47
Category grades
Schools grade is shown separately in the Schools card above.
Census & demographics
- County
- Montgomery County · 663,713 people
- City population
- 106,505
- Metro
- Houston-The Woodlands-Sugar Land, TX
- Population (ZIP)
- 44,900
- Household income
- $112,504
- Rent vs Own
- Severe rent burden
- 586.0
Population outlook (Montgomery County) Hauer SSP2
- Today (2025)
- 713,896 people
- By 2030
- 805,263 · +12.8%
- By 2040
- 992,708 · +39.1%
- By 2050
- 1,179,590 · +65.2%
- By 2075
- 1,628,084 · +128.1%
- By 2100
- 1,937,880 · +171.5%
Race, ethnicity, and origin ACS 2023
- Neighborhood character
- Predominantly White (66%)
- Race & ethnicity
- White 66% Hispanic / Latino 25% Two or more races 18% Black 3% Asian 1%
- Hispanic origin (detail)
- Mexican 14% Puerto Rican 1%
- Common ancestry
- Lithuanian 4% Slovak 2% Italian 2%
- Foreign-born
- 11% · Canada, Vietnam
- Languages at home
- 83% English-only · Spanish 15% Other Indo-European 1% German/W. Germanic 1%
Political lean MEDSL · Montgomery
- 2024 margin
- Solid R (+45.5) · D 26.8% · R 72.3%
- 2008→2024 swing
- +7.2pp toward D · 2008: -52.7pp · 2024: -45.5pp
- All cycles
- 2024: R+45.5 2020: R+43.8 2016: R+51.4 2012: R+60.7 2008: R+52.7
Not yet ingested
- Civics
- —
Market trends
- HPI YoY
- ▲ 12.09%
- Current HPI
- 512.87
- Rent YoY
- ▲ 0.32%
- Metro
- Houston-The Woodlands-Sugar Land, TX
- State GDP YoY
- ▲ 3.95%
- F500 in state
- 110
Industry mix (Fortune 500 HQ in TX)
| Industry | F500 HQs | Revenue |
|---|---|---|
| Energy | 16 | $1,198B |
|
||
| Technology | 5 | $198B |
|
||
| Engineering / Construction | 4 | $72B |
|
||
| Energy Services | 3 | $60B |
|
||
| Utilities | 3 | $41B |
|
||
| Healthcare | 2 | $330B |
|
||
Price history
+142.9% since first listed5 events — show timeline
- 2026-05-14 Price Changed $344,900 HARMLS
- 2026-05-14 Price Changed $345,000 HARMLS
- 2026-03-03 Listed $350,000 HARMLS
- 2003-11-01 Listing Removed — HARMLS
- 2003-08-14 Listed $142,000 HARMLS
Property tax history
+3.8%/yrLatest (2025): $5,742 · +4.4% YoY. Source: county tax records.
Cash-flow waterfall
monthlySold comps — $/sqft
last 12 mo · ≤1 miLoading sold comps…