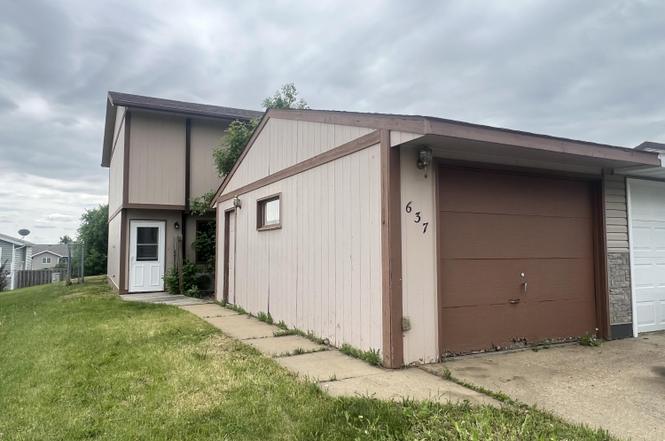
637 27th St W · Dickinson, ND
Flood risk 1/10 · Minimal
- FEMA flood zone
- X (unshaded)
- Chance of flooding over 30 yrs
- 0.0%
- Est. flood insurance / yr
- $507 – $1,088
Fire risk 3/10 · Minor
- Est. fire insurance / yr
- $1,289 – $2,393
Heat risk 2/10 · Minimal
- Hot days now (above 95°F)
- 7 days/yr
- Hot days in 30 yrs
- 13 days/yr
Wind risk 2/10 · Minimal
- Chance of severe wind over 30 yrs
- —
Air-quality risk 4/10 · Minor
- Unhealthy air days now
- 4 days/yr
- Unhealthy air days in 30 yrs
- 5 days/yr
Risk factors via First Street. Map © Google.
Why this score? — see what drove the C- grade
The composite is a weighted blend of 9 inputs, each scored 0–100. Each bar is that input's sub-score; the figure is the points it added to the 100-point composite (weight × sub-score).
- Cash flow +17.3/30.0
- ARV discount +11.6/15.0
- DSCR +5.4/10.0
- 1% rule +3.9/10.0
- Livability +3.8/5.0
- Schools +3.5/10.0
- Rent growth +3.0/5.0
- Condition / age +2.5/5.0
- Appreciation +0.0/10.0
$160,000
🖨 Deal sheet (PDF) 📄 Offer letter ✓ Due diligence
Listing remarks MLS
Fabulous and affordable! 3 bedrooms, 2 baths, and a fenced back yard. Near shopping and priced to sell for a quick sale. Call now, before it's sold!
Key facts
- Fenced yard
- Storage shed
- Main-floor laundry
Tags
Property features AI
Exterior
- Parking: 1-car garage with garage door opener
- Utilities: Public sewer
- Home design: Townhouse (residential); 2 stories
- Construction: No foundation details listed
- Exterior features: Lot size ~0.089 acres; Zoned RMD
Interior
- Kitchen: Range; Refrigerator
- Bedrooms: Total of 9 rooms (bedrooms included in room count)
- Bathrooms: 2 full bathrooms
- Heating & cooling: Baseboard heating; Has cooling
- Interior features: Eat-in kitchen; No basement
- Laundry & utility: Washer; Dryer
Neighborhood map
What this means for you Summary
Snapshot
- This is a 3-bed/2.0-bath townhouse listed at $160k.
Deal economics
- At list price, monthly cash flow is $118 ($1k/yr) — positive.
- The deal already cash-flows at list — no discount required.
- To meet the 1% rule (rent ≥ 1% of price), the offer needs to be $143k (10.7% below list).
- Recommended offer: $143k (10.7% below list) — sets the bar for 1% rule.
- Cap rate 7.2% vs local median 2.9% in Dickinson — top-decile yield for the area; either an underpriced asset or a hidden risk that comps aren't pricing in. Stress-test before assuming the spread holds.
Location & tenants
- Location reads 76/100 on livability (#12 in ND, #3,334 nationally) — a middle-class / working-renter tenant base. Strengths: cost of living A+, housing A+, health & safety A+; Watch: amenities F, commute F.
- Dickinson 1 (town): math 35% / reading 43% proficiency, ranked #29 of 53 in ND (top 55%) — families likely to look elsewhere, expect single-tenant / working-renter base with shorter leases.
- Zoned schools: Dickinson Middle School (math 36% / reading 50%, grade D-, #17 of 35 statewide, top 47%, 842 students, 28% FRL).
- Market conditions: Rents rising (+1.9%/yr); 236 active listings in the ZIP; solid renter incomes; 20 units permitted in Stark County in 2024 (0 in 5+ unit buildings).
Forward outlook
- Local home prices are declining (-3.0%/yr); year-one equity from $1k of loan paydown is wiped out by about $5k of value loss. Plan a longer hold.
- Stark County population projected at +120% by 2050 — long-run rental-demand tailwind backs the buy-and-hold thesis.
Negotiation context
- Only 1 days on market — expect competitive offers; lowballing is unlikely to land.
- 3 sale attempts since 14y ago with the ask held roughly flat each time — persistent listings suggest the price (not the market) is what's stuck; bring a comps-based counter.
Questions for the listing agent
- Is there a deadline driving the sale (1031 exchange, divorce, estate, relocation)? That informs how much negotiation room exists.
- Schools are B-rated — typically a magnet for longer-tenancy family renters. What's the average tenant stay here, and is there a school-zone premium baked into asking?
- What's the average days-on-market for RENTAL listings here right now (not sales)? A rising rental-DOM trend means longer vacancies and softer asking-rent achievability than the comps imply.
- What's the recent tenant-quality profile in this submarket — average credit score on applications, eviction rate, late-payment / NSF rate, and stable-employment percentage? A property-management company in the area should have these aggregated.
- How much new for-sale + rental construction is in the pipeline within 1–3 miles? Heavy new supply typically softens prices + rents 12–24 months out; constrained supply supports both.
Investment metrics
- 1% rule
- 0.89% ✗
- Cap rate
- 7.18%
- Cash-on-cash
- 3.16%
- DSCR
- 1.14
- GRM
- 9.3
CMA / ARV
- ARV (on-the-fly)
- $176,040
- Comps found
- 4
Show comp detail 4 sales within ~0.75 mi
| Address | Dist | Beds/Ba | Sqft | Sold | Price | $/sf | Match |
|---|---|---|---|---|---|---|---|
| 648 28th St W | 0.09mi | 3/1.5 | 1,080 (0%) | 16mo | $169,900 | $157 | 81 |
| 633 27th St W | 0.01mi | 3/1.5 | 1,080 (0%) | 24mo | $176,000 | $163 | 78 |
| 620 29th St W | 0.14mi | 2/1.5 (-1) | 1,152 (+7%) | 14mo | $159,900 | $139 | 63 |
| 1085 Donna Ln | 0.55mi | 2/1.0 (-1) | 1,027 (-5%) | 21mo | $198,000 | $193 | 39 |
Match score weights: distance 35% · size 25% · config 20% · recency 20%. Top-matched comps best support the ARV.
Projected returns pro-forma
-3.0% appreciation · 1.95% rent growth · sell at horizon
- IRR
- -12.4%
- Equity multiple
- 0.55×
- Total profit
- $-19,944
- Equity at exit
- $23,857
- IRR
- -4.9%
- Equity multiple
- 0.69×
- Total profit
- $-13,844
- Equity at exit
- $13,834
Cash invested: $44,800 (down + closing). Projections, not guarantees.
Landlord ↔ Tenant lean methodology
- Overall (STATE)
- 82 Strongly Landlord-Friendly
- State North Dakota
- 82 Strongly Landlord-Friendly · R+20
- County
- — inherits STATE
- City
- — inherits STATE
ZIP-level market 58601
- Rents YoY
- 1.9%
- Active inventory
- 236
- Price-to-rent
- 9.3×
Monthly cashflow live
- Estimated rent
- $1,429 medium interval (Pro) →
- Mortgage (P&I)
- −$839
- Tax from tax record
- −$105 /mo · $1,263/yr
- Insurance
- −$67
- HOA
- −$0
- Vacancy / Maint / Mgmt
- −$300
- Net cashflow
- $118
Break-even live
Sensitivity live
| Price | -10% $209 | -5% $163 | +0% $118 | +5% $73 | +10% $27 |
|---|---|---|---|---|---|
| Rent | -10% $5 | -5% $62 | +0% $118 | +5% $174 | +10% $231 |
| Rate | -1.0pp $199 | -0.5pp $159 | base $118 | +0.5pp $77 | +1.0pp $34 |
UW: 25.0% down · 7.5% · 30yr · 1.5% tax · 5.0% vac · 8.0% maint · 8.0% mgmt
Financing live
Cash to close
- Down payment
- $40,000
- Closing costs
- $4,800
- Reserves months
- —
- Total cash needed
- —
Loan-product check · same deal, 3 products live
Conventional
25% down · 7.5% · 30yr
- Down + closing
- —
- Monthly P&I
- —
- Monthly cashflow
- —
- DSCR
- —
- Eligible?
- —
Personal DTI + credit; lowest rate.
DSCR
20% down · 8.5% · 30yr
- Down + closing
- —
- Monthly P&I
- —
- Monthly cashflow
- —
- DSCR
- —
- Eligible?
- —
No personal income docs; deal must DSCR.
Hard money
10% down · 12.0% · 12mo
- Down + closing
- —
- Monthly P&I
- —
- Monthly cashflow
- —
- DSCR
- —
- Eligible?
- —
Short-term bridge; refi at stabilization.
Listing history 1 events
-
2026-06-21$160,000 Active 1 DOM
ⓘ Source: listings_history table (triggers on properties + properties_extension) + one-shot
backfill from property_details.listing_events for pre-trigger history.
Tax reassessment forecast ND · Resets to sale price
- Current annual tax
- $1,263 · $105/mo
- Projected year-2 tax
- $1,568 · $131/mo
- Expected delta
- +$305/yr (+$25/mo · 24.1%)
ⓘ Screening estimate from a state-policy table — verify with the county assessor before closing.
Climate risk First Street
- Flood 1/10 Low FEMA zone X (unshaded) · 0% chance over 30 yrs
- Wildfire 3/10 Moderate
- Heat 2/10 Low 7 d/yr ≥95°F today · 13 d/yr by 30 yrs out
- Wind 2/10 Low
- Air quality 4/10 Moderate 4 unhealthy d/yr today · 5 by 30 yrs out
Nearby sold comps map
Loading sold comps map…
Walkable amenities ~0.75 mi
Loading nearby amenities…
Taxation est. · year 1
- Rental income
- $17,149
- − Mortgage interest
- −$8,962
- − Property taxes
- −$1,263
- − Insurance
- −$800
- − Repairs & maintenance
- −$1,372
- − Management
- −$1,372
- − Depreciation
- −$4,655
- Taxable loss
- −$1,275
- Est. tax savings @ 24.0%
- +$306
- After-tax cash flow
- $1,722/yr
For passive investors: Depreciation is non-cash, so a rental often shows a tax loss while cash-flowing — sheltering income. Rental losses are passive: they offset passive income freely, and up to $25,000/yr can offset ordinary (W-2) income if you actively participate and your MAGI is under $100k (phasing out to $0 by $150k); unused losses carry forward. On sale, claimed depreciation is recaptured at up to 25%, and gains may owe capital-gains tax (a 1031 exchange can defer both). Figures are a year-1 estimate at your 24.0% rate — not tax advice; consult a CPA.
Schools (NCES district)
- District
- Dickinson 1
- NCES district ID
- 3800038
- Math proficiency
- 35% ▼ -12.00%
- Reading proficiency
- 43% ▼ -7.00%
- Median HH income
- $63,270
- Composite
- 34.9/100
- National rank
- #5080
- State rank
- #29 of 53 in ND
Livability — Dickinson
- Score
- 76/100
- State rank
- #12
- US rank
- #3334
Category grades
Schools grade is shown separately in the Schools card above.
Census & demographics
- Census place
- Dickinson, ND
- County
- Stark County · 29,916 people
- City population
- 29,916
- Metro
- Dickinson, ND
- Population (ZIP)
- 29,916
- Household income
- $85,821
- Rent vs Own
- Severe rent burden
- 813.0
Population outlook (Stark County) Hauer SSP2
- Today (2025)
- 50,426 people
- By 2030
- 60,812 · +20.6%
- By 2040
- 84,155 · +66.9%
- By 2050
- 110,718 · +119.6%
- By 2075
- 186,710 · +270.3%
- By 2100
- 264,902 · +425.3%
Race, ethnicity, and origin ACS 2023
- Neighborhood character
- Predominantly White (85%)
- Race & ethnicity
- White 85% Hispanic / Latino 7% Two or more races 5% Black 3% Asian 1%
- Hispanic origin (detail)
- Mexican 5%
- Common ancestry
- Portuguese 9% Scotch-Irish 2% Lithuanian 2%
- Foreign-born
- 4% · Canada, China
- Languages at home
- 92% English-only · Spanish 4% German/W. Germanic 1% Arabic 1%
Political lean MEDSL · Stark
- 2024 margin
- Solid R (+65.6) · D 16.5% · R 82.1% · Other 1.5%
- 2008→2024 swing
- -36.5pp toward R · 2008: -29.1pp · 2024: -65.6pp
- All cycles
- 2024: R+65.6 2020: R+63.9 2016: R+65.8 2012: R+49.4 2008: R+29.1
Not yet ingested
- Civics
- —
Market trends
- HPI YoY
- ▼ -133.57%
- Current HPI
- 188.1029
- Rent YoY
- ▲ 1.95%
- Metro
- Dickinson, ND
- State GDP YoY
- ▲ 2.09%
- F500 in state
- 2
Industry mix (Fortune 500 HQ in ND)
| Industry | F500 HQs | Revenue |
|---|---|---|
| Utilities / Construction | 1 | $6B |
|
||
Price history
+14.4% since first listed10 events — show timeline
- 2026-06-18 Listed $160,000 Badlands BOR MLS
- 2023-09-06 Delisted — Badlands BOR MLS
- 2023-09-06 Delisted — Badlands BOR MLS
- 2015-04-15 Sold (Public Records) — Public Records
- 2014-12-22 Sold (Public Records) — Public Records
- 2014-12-03 Listed $150,000 Badlands BOR MLS
- 2013-01-14 Sold (Public Records) — Public Records
- 2012-11-28 Listed $139,900 Badlands BOR MLS
- 2011-09-09 Sold (Public Records) — Public Records
- 2010-10-05 Sold (Public Records) — Public Records
Property tax history
+1.1%/yrLatest (2025): $1,263 · +1.7% YoY. Source: county tax records.
Cash-flow waterfall
monthlySold comps — $/sqft
last 12 mo · ≤1 miLoading sold comps…