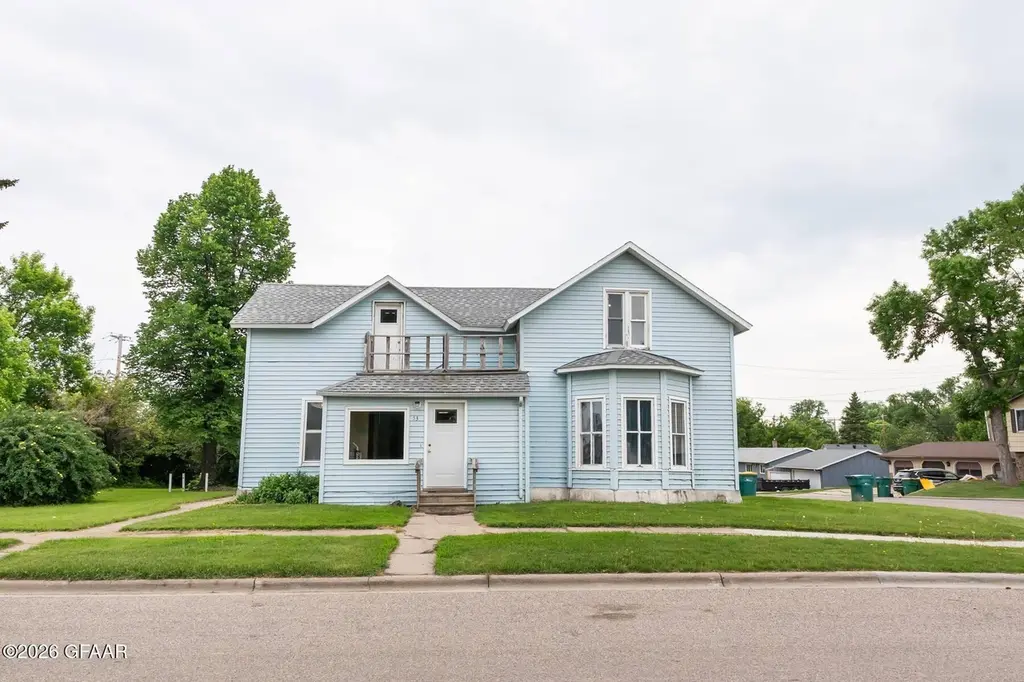
53 1st Ave NW · Mayville, ND
Flood risk 1/10 · Minimal
- FEMA flood zone
- X (unshaded)
- Chance of flooding over 30 yrs
- 0.0%
- Est. flood insurance / yr
- $473 – $860
Fire risk 3/10 · Minor
- Est. fire insurance / yr
- $1,289 – $2,393
Heat risk 2/10 · Minimal
- Hot days now (above 98°F)
- 7 days/yr
- Hot days in 30 yrs
- 12 days/yr
Wind risk 1/10 · Minimal
- Chance of severe wind over 30 yrs
- —
Air-quality risk 4/10 · Minor
- Unhealthy air days now
- 3 days/yr
- Unhealthy air days in 30 yrs
- 5 days/yr
Risk factors via First Street. Map © Google.
Why this score? — see what drove the D grade
The composite is a weighted blend of 9 inputs, each scored 0–100. Each bar is that input's sub-score; the figure is the points it added to the 100-point composite (weight × sub-score).
- Cash flow +15.2/30.0
- ARV discount +7.5/15.0
- DSCR +4.7/10.0
- 1% rule +4.2/10.0
- Livability +4.2/5.0
- Schools +4.0/10.0
- Rent growth +2.5/5.0
- Condition / age +2.2/5.0
- Appreciation +0.0/10.0
$148,000
🖨 Deal sheet (PDF) 📄 Offer letter ✓ Due diligence
Key facts
- Attached garage
- Downtown view
- Off-street parking
Tags
Property features AI
Exterior
- Parking: Attached garage (1 car); Concrete driveway/parking
- Utilities: City water (connected); City sewer (connected); Electric fuel
- Home design: Residential property; Two levels; Entry level on main floor
- Construction: Foundation area approximately 1,607; Above-grade finished area listed (total living area distributed across levels)
- Exterior features: Vinyl exterior; Lot approximately 55 x 75 feet
Interior
- Kitchen: Main-level kitchen
- Bedrooms: Five bedrooms total; Upper-level bedrooms include Bedroom 3 and Bedroom 4; Main-level bedrooms include Bedroom 2 and another bedroom
- Bathrooms: One full bathroom; Two three-quarter bathrooms
- Heating & cooling: Forced air heating; Central air conditioning
- Interior features: Partial basement; Bonus room; Dining room; Living rooms on main and upper levels
- Laundry & utility: Main-level laundry
Neighborhood map
What this means for you Summary
Snapshot
- This is a 5-bed/3.0-bath single-family listed at $148k. Condition is rated fair.
Deal economics
- At list price, monthly cash flow is $52 ($624/yr) — positive.
- The deal already cash-flows at list — no discount required.
- To meet the 1% rule (rent ≥ 1% of price), the offer needs to be $136k (8.1% below list).
- Recommended offer: $136k (8.1% below list) — sets the bar for 1% rule.
Location & tenants
- Location reads 83/100 on livability (#2 in ND, #959 nationally) — a professional / high-income tenant draw. Strengths: crime A+, cost of living A+, housing A+; Watch: amenities F, commute F.
- May-Port Cg 14 (rural): math 42% / reading 50% proficiency, ranked #19 of 53 in ND (top 36%) — families likely to look elsewhere, expect single-tenant / working-renter base with shorter leases; only 20% free/reduced lunch — higher-income household profile.
- Zoned schools: Peter Boe Jr Elementary School (math 52% / reading 57%, grade C, #39 of 236 statewide, top 21%, 262 students, 21% FRL); May-Port Cg Middle School (math 32% / reading 37%, grade F, #24 of 35 statewide, top 71%, 114 students, 18% FRL); May-Port Cg High School (math 24% / reading 64%, grade F, #33 of 144 statewide, top 32%, 132 students, 18% FRL) — zoned schools at 19% FRL track the district average.
- Market conditions: 21 active listings in the ZIP; 8 units permitted in Traill County in 2024 (0 in 5+ unit buildings).
Forward outlook
- Local home prices are declining (-3.0%/yr); year-one equity from $1k of loan paydown is wiped out by about $4k of value loss. Plan a longer hold.
- Traill County population projected at +3% by 2050 — modest demand growth; plan on rents tracking national, not racing it.
Negotiation context
- Only 9 days on market — expect competitive offers; lowballing is unlikely to land.
Risks & watch-outs
- Watch-outs: built in 1880 — expect roof / HVAC / electrical / plumbing capex.
Questions for the listing agent
- Have any recent inspections been done? Can we get a copy of the seller's disclosures and any deferred-maintenance estimates?
- Built in 1880 — when were the roof, HVAC, electrical panel, plumbing, and water heater last replaced?
- Is there a deadline driving the sale (1031 exchange, divorce, estate, relocation)? That informs how much negotiation room exists.
- Schools are B-rated — typically a magnet for longer-tenancy family renters. What's the average tenant stay here, and is there a school-zone premium baked into asking?
- The area grade is low — what's the realistic commute time and amenity access for the typical tenant pool here? Any planned neighborhood developments (good or bad) we should know about?
- What's the average days-on-market for RENTAL listings here right now (not sales)? A rising rental-DOM trend means longer vacancies and softer asking-rent achievability than the comps imply.
- What's the recent tenant-quality profile in this submarket — average credit score on applications, eviction rate, late-payment / NSF rate, and stable-employment percentage? A property-management company in the area should have these aggregated.
- How much new for-sale + rental construction is in the pipeline within 1–3 miles? Heavy new supply typically softens prices + rents 12–24 months out; constrained supply supports both.
Investment metrics
- 1% rule
- 0.92% ✗
- Cap rate
- 6.71%
- Cash-on-cash
- 1.51%
- DSCR
- 1.07
- GRM
- 9.1
CMA / ARV
No comps found within radius.
Projected returns pro-forma
-3.0% appreciation · 3.0% rent growth · sell at horizon
- IRR
- -13.9%
- Equity multiple
- 0.50×
- Total profit
- $-20,651
- Equity at exit
- $22,067
- IRR
- -5.0%
- Equity multiple
- 0.67×
- Total profit
- $-13,636
- Equity at exit
- $12,796
Cash invested: $41,440 (down + closing). Projections, not guarantees.
Landlord ↔ Tenant lean methodology
- Overall (STATE)
- 82 Strongly Landlord-Friendly
- State North Dakota
- 82 Strongly Landlord-Friendly · R+20
- County
- — inherits STATE
- City
- — inherits STATE
ZIP-level market 58257
- Home prices YoY
- -34.2%
- Active inventory
- 21
- Price-to-rent
- 9.1×
Monthly cashflow live
- Estimated rent
- $1,360 medium interval (Pro) →
- Mortgage (P&I)
- −$776
- Tax est. 1.5%
- −$185 /mo · $2,220/yr
- Insurance
- −$62
- HOA
- −$0
- Vacancy / Maint / Mgmt
- −$286
- Net cashflow
- $52
Break-even live
Sensitivity live
| Price | -10% $154 | -5% $103 | +0% $52 | +5% $1 | +10% $-50 |
|---|---|---|---|---|---|
| Rent | -10% $-55 | -5% $-2 | +0% $52 | +5% $106 | +10% $159 |
| Rate | -1.0pp $127 | -0.5pp $90 | base $52 | +0.5pp $14 | +1.0pp $-25 |
UW: 25.0% down · 7.5% · 30yr · 1.5% tax · 5.0% vac · 8.0% maint · 8.0% mgmt
Financing live
Cash to close
- Down payment
- $37,000
- Closing costs
- $4,440
- Reserves months
- —
- Total cash needed
- —
Loan-product check · same deal, 3 products live
Conventional
25% down · 7.5% · 30yr
- Down + closing
- —
- Monthly P&I
- —
- Monthly cashflow
- —
- DSCR
- —
- Eligible?
- —
Personal DTI + credit; lowest rate.
DSCR
20% down · 8.5% · 30yr
- Down + closing
- —
- Monthly P&I
- —
- Monthly cashflow
- —
- DSCR
- —
- Eligible?
- —
No personal income docs; deal must DSCR.
Hard money
10% down · 12.0% · 12mo
- Down + closing
- —
- Monthly P&I
- —
- Monthly cashflow
- —
- DSCR
- —
- Eligible?
- —
Short-term bridge; refi at stabilization.
Listing history 7 events
-
2026-06-21days on market $148,000 Active 9 DOM
-
2026-06-21days on market $148,000 Active 8 DOM
-
2026-06-18days on market $148,000 Active 6 DOM
-
2026-06-17days on market $148,000 Active 5 DOM
-
2026-06-16days on market $148,000 Active 4 DOM
-
2026-06-15days on market $148,000 Active 3 DOM
-
2026-06-12$148,000 Active 1 DOM
ⓘ Source: listings_history table (triggers on properties + properties_extension) + one-shot
backfill from property_details.listing_events for pre-trigger history.
Climate risk First Street
- Flood 1/10 Low FEMA zone X (unshaded) · 0% chance over 30 yrs
- Wildfire 3/10 Moderate
- Heat 2/10 Low 7 d/yr ≥98°F today · 12 d/yr by 30 yrs out
- Wind 1/10 Low
- Air quality 4/10 Moderate 3 unhealthy d/yr today · 5 by 30 yrs out
Nearby sold comps map
Loading sold comps map…
Walkable amenities ~0.75 mi
Loading nearby amenities…
Taxation est. · year 1
- Rental income
- $16,326
- − Mortgage interest
- −$8,290
- − Property taxes
- −$2,220
- − Insurance
- −$740
- − Repairs & maintenance
- −$1,306
- − Management
- −$1,306
- − Depreciation
- −$4,305
- Taxable loss
- −$1,842
- Est. tax savings @ 24.0%
- +$442
- After-tax cash flow
- $1,066/yr
For passive investors: Depreciation is non-cash, so a rental often shows a tax loss while cash-flowing — sheltering income. Rental losses are passive: they offset passive income freely, and up to $25,000/yr can offset ordinary (W-2) income if you actively participate and your MAGI is under $100k (phasing out to $0 by $150k); unused losses carry forward. On sale, claimed depreciation is recaptured at up to 25%, and gains may owe capital-gains tax (a 1031 exchange can defer both). Figures are a year-1 estimate at your 24.0% rate — not tax advice; consult a CPA.
Condition & rehab AI · 13 photos
The home requires moderate renovations to the kitchen and bathrooms, and exterior painting to improve its overall condition and value.
Repairs flagged
- Moderate kitchen cabinets — dated and in need of replacement
- Moderate bathroom fixtures — dated and in need of replacement
- Moderate exterior siding — moderate wear
Value-add opportunities
- Both kitchen renovation — modernizing the kitchen would increase both resale and rental value
- Both bathroom renovation — modernizing the bathrooms would increase both resale and rental value
- Both exterior painting — painting the exterior would improve curb appeal and increase both resale and rental value
Renovation cost estimate screening
| Repair item | Severity | Est. cost |
|---|---|---|
| kitchen cabinets · dated and in need of replacement | Moderate | $3,000–15,000 |
| bathroom fixtures · dated and in need of replacement | Moderate | $3,000–15,000 |
| exterior siding · moderate wear | Moderate | $3,000–15,000 |
| Total estimated repair cost · 3 items | $9,000–45,000 |
Value-add ROI direction
- Both kitchen renovation — modernizing the kitchen would increase both resale and rental value ↑
- Both bathroom renovation — modernizing the bathrooms would increase both resale and rental value ↑
- Both exterior painting — painting the exterior would improve curb appeal and increase both resale and rental value ↑
ⓘ Cost ranges are severity-bucket heuristics (US national rule-of-thumb). Get contractor quotes + a written scope before underwriting a rehab budget.
Schools (NCES district)
- District
- May-Port Cg 14
- NCES district ID
- 3800041
- Math proficiency
- 42% ▼ -8.00%
- Reading proficiency
- 50% ▼ -7.00%
- Median HH income
- $50,978
- Composite
- 39.53/100
- National rank
- #3944
- State rank
- #19 of 53 in ND
Livability — Mayville
- Score
- 83/100
- State rank
- #2
- US rank
- #959
Category grades
Schools grade is shown separately in the Schools card above.
Census & demographics
- Census place
- Mayville, ND
- Population (ZIP)
- 2,275
Population outlook (Traill County) Hauer SSP2
- Today (2025)
- 8,107 people
- By 2030
- 8,099 · -0.1%
- By 2040
- 8,151 · +0.5%
- By 2050
- 8,384 · +3.4%
- By 2075
- 9,868 · +21.7%
- By 2100
- 12,181 · +50.3%
Race, ethnicity, and origin ACS 2023
- Neighborhood character
- Predominantly White (86%)
- Race & ethnicity
- White 86% Hispanic / Latino 8% Two or more races 6% Black 3%
- Hispanic origin (detail)
- Mexican 5%
- Common ancestry
- Portuguese 34% Lithuanian 3% Romanian 2%
- Foreign-born
- 5% · Canada
- Languages at home
- 94% English-only · Spanish 5% Other Indo-European 1% German/W. Germanic 0%
Political lean MEDSL · Traill
- 2024 margin
- Solid R (+31.6) · D 33.3% · R 65.0% · Other 1.7%
- 2008→2024 swing
- -38.8pp toward R · 2008: 7.2pp · 2024: -31.6pp
- All cycles
- 2024: R+31.6 2020: R+24.9 2016: R+26.5 2012: R+4.7 2008: D+7.2
Not yet ingested
- Civics
- —
Market trends
- HPI YoY
- ▼ -67.93%
- Current HPI
- 130.6558
- Rent YoY
- —
- Metro
- —
- State GDP YoY
- ▲ 2.09%
- F500 in state
- 2
Industry mix (Fortune 500 HQ in ND)
| Industry | F500 HQs | Revenue |
|---|---|---|
| Utilities / Construction | 1 | $6B |
|
||
Price history
1 event — show timeline
- 2026-06-11 Listed $148,000 NORTHSTARMLS as Distributed by MLS Grid
Cash-flow waterfall
monthlySold comps — $/sqft
last 12 mo · ≤1 miLoading sold comps…