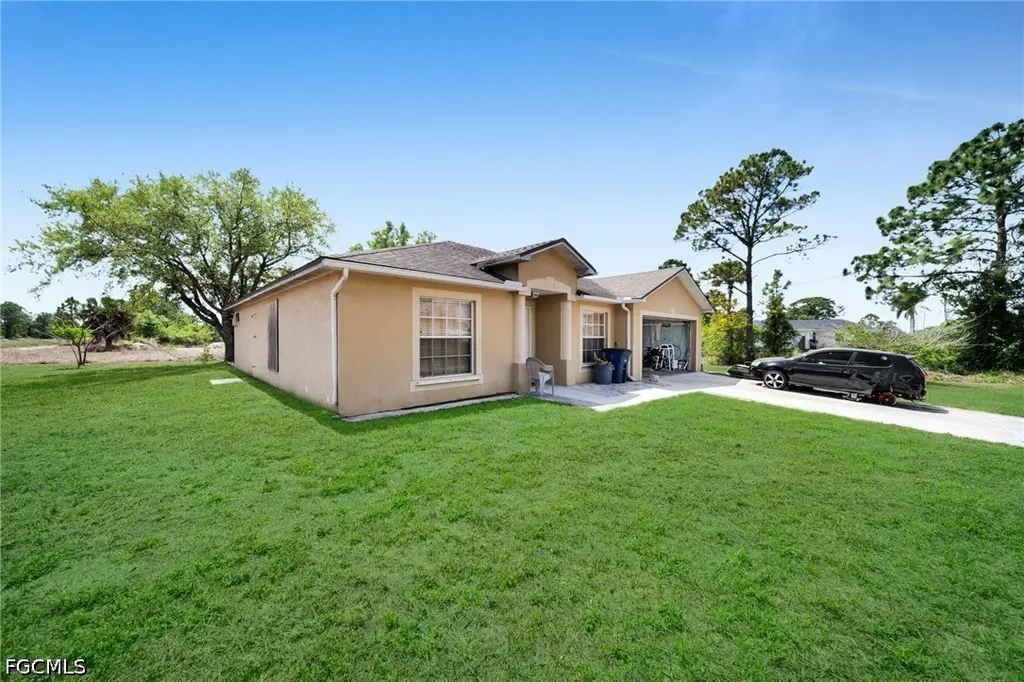
2501 36th St SW · Lehigh Acres, FL
Flood risk 1/10 · Minimal
- FEMA flood zone
- X (unshaded)
- Chance of flooding over 30 yrs
- 0.0%
- Est. flood insurance / yr
- $507 – $1,088
Fire risk 3/10 · Minor
- Est. fire insurance / yr
- $947 – $1,759
Heat risk 10/10 · Severe
- Hot days now (above 107°F)
- 7 days/yr
- Hot days in 30 yrs
- 28 days/yr
Wind risk 10/10 · Severe
- Chance of severe wind over 30 yrs
- 99.0%
Air-quality risk 2/10 · Minimal
- Unhealthy air days now
- 1 days/yr
- Unhealthy air days in 30 yrs
- 1 days/yr
Risk factors via First Street. Map © Google.
Why this score? — see what drove the C+ grade
The composite is a weighted blend of 9 inputs, each scored 0–100. Each bar is that input's sub-score; the figure is the points it added to the 100-point composite (weight × sub-score).
- Cash flow +16.3/30.0
- ARV discount +13.8/15.0
- Appreciation +10.0/10.0
- DSCR +5.0/10.0
- 1% rule +4.6/10.0
- Schools +4.1/10.0
- Livability +3.0/5.0
- Condition / age +2.5/5.0
- Rent growth +2.1/5.0
$220,000
🖨 Deal sheet (PDF) 📄 Offer letter ✓ Due diligence
Listing remarks
MOVE-IN READY | NO HOA | MOTIVATED SELLERS Sellers open to closing cost contributions with a strong offer! Major opportunity for investors or first-time buyers looking to renovate. This property offers strong potential as a fix-and-flip, rental, or primary residence with customization. Roof replaced in 2018 after Irma. Situated on nearly half an acre at the end of a quiet road, offering added privacy. Canal-front location provides additional value and potential for outdoor enjoyment. Property is being sold as-is.
Key facts
- Quiet road
- Canal front location
- Move in ready
Tags
Property features AI
Finance
- Financial info: Pets allowed
- HOA & community: No association fee
Exterior
- Parking: Attached 2-car garage; Driveway parking; Paved parking
- Utilities: Well water; Septic tank sewer; Cable not available
- Home design: Single-story home; Resale property; Faces east
- Construction: Block and concrete construction; Shingle roof
- Exterior features: Oversized lot; West exposure; No additional exterior features listed
Interior
- Flooring: Tile flooring
- Bathrooms: 2 full bathrooms
- Heating & cooling: Central heating (electric); Central air conditioning (electric)
- Interior features: Unfurnished; Bedroom on main level; Family/Dining room; Living/Dining room; Family room
Neighborhood map
What this means for you Summary
Snapshot
- This is a 3-bed/2.0-bath single-family listed at $220k.
Deal economics
- At list price, monthly cash flow is $119 ($1k/yr) — positive.
- The deal already cash-flows at list — no discount required.
- To meet the 1% rule (rent ≥ 1% of price), the offer needs to be $211k (4.1% below list).
- Recommended offer: $211k (4.1% below list) — sets the bar for 1% rule.
- Cap rate 6.9% vs local median 4.7% in Lehigh Acres — top-decile yield for the area; either an underpriced asset or a hidden risk that comps aren't pricing in. Stress-test before assuming the spread holds.
Location & tenants
- Location reads 59/100 on livability (#826 in FL) — a working-class tenant base; expect higher turnover. Strengths: cost of living A+, housing A+; Watch: crime C-, employment D+, amenities F.
- Lee (suburban): math 47% / reading 50% proficiency, ranked #42 of 73 in FL (top 58%) — families likely to look elsewhere, expect single-tenant / working-renter base with shorter leases.
- Zoned schools: Veterans Park Academy For The Arts (math 41% / reading 45%, grade F, #1,366 of 2,144 statewide, top 64%, 2,133 students, 36% FRL); Oak Hammock Middle School (math 43% / reading 41%, grade D-, #340 of 571 statewide, top 61%, 1,563 students, 56% FRL); Lehigh Senior High School (math 23% / reading 45%, grade F, #394 of 667 statewide, top 60%, 2,476 students, 57% FRL).
- Market conditions: Rents soft (-1.5%/yr); 788 active listings in the ZIP; 40 comparable units currently listed for rent nearby; rentals at typical pace (median 26d on market — plan ~3-4 weeks tenant-placement turnaround); 15,411 units permitted in Lee County in 2024 (4,686 in 5+ unit buildings).
- This rent runs 35% of the median local income ($73k/yr) — at the standard rent-burdened threshold; future hikes will face affordability resistance.
Forward outlook
- In year one you build about $24k of equity ($2k loan paydown + $22k appreciation (10.0% local appreciation)).
- Lee County population projected at +44% by 2050 — long-run rental-demand tailwind backs the buy-and-hold thesis.
- At projected returns (10.0% appreciation + 0.0% rent growth), your $62k cash investment doubles in ~3 years — after that, you're playing with house money.
- By year 2, paydown + projected appreciation supports a ~$38k cash-out refi (75% LTV) — recoverable capital for the next deal without selling this one.
Negotiation context
- Only 7 days on market — expect competitive offers; lowballing is unlikely to land.
Risks & watch-outs
- Climate carrying-cost: severe wind risk, 99% chance of damaging wind over 30y; extreme-heat days projected 7→28/yr by 2055 (HVAC capex compounding) — expect insurance premiums to compound above CPI over the hold.
Questions for the listing agent
- Is there a deadline driving the sale (1031 exchange, divorce, estate, relocation)? That informs how much negotiation room exists.
- Schools are D-rated, which usually means shorter tenancies and higher turnover. Who's the typical renter profile here, and what's been the actual vacancy rate?
- What's the average days-on-market for RENTAL listings here right now (not sales)? A rising rental-DOM trend means longer vacancies and softer asking-rent achievability than the comps imply.
- What's the recent tenant-quality profile in this submarket — average credit score on applications, eviction rate, late-payment / NSF rate, and stable-employment percentage? A property-management company in the area should have these aggregated.
- How much new for-sale + rental construction is in the pipeline within 1–3 miles? Heavy new supply typically softens prices + rents 12–24 months out; constrained supply supports both.
Investment metrics
- 1% rule
- 0.96% ✗
- Cap rate
- 6.94%
- Cash-on-cash
- 2.32%
- DSCR
- 1.10
- GRM
- 8.7
CMA / ARV
- ARV (on-the-fly)
- $255,831
- Comps found
- 12
Show comp detail 12 sales within ~0.75 mi
| Address | Dist | Beds/Ba | Sqft | Sold | Price | $/sf | Match |
|---|---|---|---|---|---|---|---|
| 2600 38th St SW | 0.19mi | 3/2.0 | 1,629 (+1%) | 0mo | $350,000 | $215 | 89 |
| 339 Pyramid Ave | 0.34mi | 3/2.0 | 1,637 (+2%) | 3mo | $320,000 | $195 | 79 |
| 341 Pyramid Ave | 0.35mi | 3/2.0 | 1,637 (+2%) | 4mo | $315,000 | $192 | 78 |
| 2515 29th St SW | 0.49mi | 3/2.0 | 1,630 (+1%) | 1mo | $315,000 | $193 | 74 |
| 117 Paxton St | 0.20mi | 3/2.0 | 1,421 (-12%) | 2mo | $275,000 | $194 | 70 |
| 20529 Hazelnut Ct S | 0.49mi | 2/2.0 (-1) | 1,564 (-3%) | 1mo | $202,000 | $129 | 67 |
| 20531 Hazelnut Ct S | 0.50mi | 2/2.0 (-1) | 1,564 (-3%) | 1mo | $202,000 | $129 | 66 |
| 20589 Hazelnut Ct S | 0.60mi | 2/2.0 (-1) | 1,564 (-3%) | 4mo | $212,000 | $136 | 59 |
| 20611 Hazelnut Ct | 0.64mi | 2/2.0 (-1) | 1,564 (-3%) | 7mo | $212,000 | $136 | 55 |
| 157 Partridge St | 0.60mi | 3/2.0 | 1,495 (-7%) | 7mo | $238,000 | $159 | 54 |
| 4602 Beth Ave S | 0.63mi | 4/2.0 (+1) | 1,757 (+9%) | 4mo | $274,500 | $156 | 47 |
| 242 Pullman St | 0.75mi | 3/2.0 | 1,407 (-13%) | 2mo | $185,000 | $131 | 42 |
Match score weights: distance 35% · size 25% · config 20% · recency 20%. Top-matched comps best support the ARV.
Projected returns pro-forma
10.0% appreciation · 0.0% rent growth · sell at horizon
- IRR
- 24.9%
- Equity multiple
- 2.97×
- Total profit
- $121,281
- Equity at exit
- $198,193
- IRR
- 21.2%
- Equity multiple
- 6.52×
- Total profit
- $340,199
- Equity at exit
- $427,412
Cash invested: $61,600 (down + closing). Projections, not guarantees.
Landlord ↔ Tenant lean methodology
- Overall (STATE)
- 87 Strongly Landlord-Friendly
- State Florida
- 87 Strongly Landlord-Friendly · R+3
- County
- — inherits STATE
- City
- — inherits STATE
ZIP-level market 33976
- Home prices YoY
- 6.8%
- Rents YoY
- -1.5%
- Active inventory
- 788
- Price-to-rent
- 8.7×
Monthly cashflow live
- Estimated rent
- $2,111 high interval (Pro) →
- Mortgage (P&I)
- −$1,154
- Tax from tax record
- −$303 /mo · $3,632/yr
- Insurance
- −$92
- HOA
- −$0
- Vacancy / Maint / Mgmt
- −$443
- Net cashflow
- $119
Break-even live
Sensitivity live
| Price | -10% $244 | -5% $182 | +0% $119 | +5% $57 | +10% $-5 |
|---|---|---|---|---|---|
| Rent | -10% $-47 | -5% $36 | +0% $119 | +5% $203 | +10% $286 |
| Rate | -1.0pp $230 | -0.5pp $175 | base $119 | +0.5pp $62 | +1.0pp $4 |
UW: 25.0% down · 7.5% · 30yr · 1.5% tax · 5.0% vac · 8.0% maint · 8.0% mgmt
Financing live
Cash to close
- Down payment
- $55,000
- Closing costs
- $6,600
- Reserves months
- —
- Total cash needed
- —
Loan-product check · same deal, 3 products live
Conventional
25% down · 7.5% · 30yr
- Down + closing
- —
- Monthly P&I
- —
- Monthly cashflow
- —
- DSCR
- —
- Eligible?
- —
Personal DTI + credit; lowest rate.
DSCR
20% down · 8.5% · 30yr
- Down + closing
- —
- Monthly P&I
- —
- Monthly cashflow
- —
- DSCR
- —
- Eligible?
- —
No personal income docs; deal must DSCR.
Hard money
10% down · 12.0% · 12mo
- Down + closing
- —
- Monthly P&I
- —
- Monthly cashflow
- —
- DSCR
- —
- Eligible?
- —
Short-term bridge; refi at stabilization.
Rent comps 40 comps
| Address | Beds | Baths | Sqft | Rent | $/sqft | DOM | Units | Dist |
|---|---|---|---|---|---|---|---|---|
| 813 Alabama Rd S Lehigh Acres, FL | 3.0 | 2.0 | 1200 | $1,495 | $1.25 | 25d | 1 | 0.34mi |
| 325 Paulcrest Ave Lehigh Acres, FL | 4.0 | 2.0 | 1619 | $2,300 | $1.42 | 25d | 1 | 0.44mi |
| 749 Alabama Rd S Unit 749 Lehigh Acres, FL | 3.0 | 2.0 | 1275 | $1,800 | $1.41 | 3d | 1 | 0.44mi |
| 20483 Copperhead Dr Unit 20483 Lehigh Acres, FL | 3.0 | 3.0 | 1849 | $2,300 | $1.24 | 12d | 1 | 0.45mi |
| 2612 31st St Lehigh Acres, FL | 4.0 | 2.0 | 1389 | $1,799 | $1.30 | 17d | 1 | 0.48mi |
| 2612 31st St Lehigh Acres, FL | 4.0 | 2.0 | 1365 | $1,799 | $1.32 | 15d | 1 | 0.48mi |
| 20517 Hazelnut Ct S Lehigh Acres, FL | 2.0 | 2.0 | 1564 | $2,050 | $1.31 | 25d | 1 | 0.48mi |
| 177 Pennfield St Lehigh Acres, FL | 3.0 | 2.0 | 1250 | $1,850 | $1.48 | 25d | 1 | 0.51mi |
| 20559 Hazelnut Ct S Lehigh Acres, FL | 2.0 | 2.0 | 1564 | $1,750 | $1.12 | 25d | 1 | 0.57mi |
| 20555 Copperhead Dr Lehigh Acres, FL | 4.0 | 3.0 | 2032 | $2,490 | $1.23 | 5d | 1 | 0.57mi |
| 20550 Copperhead Dr Lehigh Acres, FL | 4.0 | 3.0 | 2002 | $3,500 | $1.75 | 25d | 1 | 0.57mi |
| 397 Pennfield Ave Lehigh Acres, FL | 4.0 | 2.0 | 1780 | $2,100 | $1.18 | 25d | 1 | 0.61mi |
| 234 Pullman St Lehigh Acres, FL | 3.0 | 2.0 | 1392 | $1,800 | $1.29 | 25d | 1 | 0.69mi |
| 664 Alabama Rd S Lehigh Acres, FL | 3.0 | 2.0 | 1181 | $1,200 | $1.02 | 25d | 1 | 0.70mi |
| 662 Alabama Rd S Lehigh Acres, FL | 3.0 | 2.0 | 1181 | $1,200 | $1.02 | 25d | 1 | 0.70mi |
| 227 Pennfield St Lehigh Acres, FL | 4.0 | 2.0 | 1732 | $2,275 | $1.31 | 25d | 1 | 0.71mi |
| 4701 Connie Ave S Lehigh Acres, FL | 3.0 | 2.0 | 1314 | $1,900 | $1.45 | 16d | 1 | 0.71mi |
| 2710 28th St SW Lehigh Acres, FL | 4.0 | 2.0 | 1742 | $2,450 | $1.41 | 25d | 1 | 0.71mi |
| 3001 37th St SW Lehigh Acres, FL | 3.0 | 2.5 | 1235 | $1,705 | $1.38 | 25d | 1 | 0.72mi |
| 18451 Copperhead Dr #522 Lehigh Acres, FL | 2.0 | 2.0 | 1120 | $1,895 | $1.69 | 25d | 1 | 0.74mi |
| 20673 Hazelnut Ct Lehigh Acres, FL | 2.0 | 2.0 | 1564 | $2,099 | $1.34 | 25d | 1 | 0.75mi |
| 2708 27th St SW Lehigh Acres, FL | 4.0 | 2.0 | 1698 | $2,280 | $1.34 | 5d | 1 | 0.75mi |
| 98 Milwaukee Blvd Lehigh Acres, FL | 2.0 | 2.0 | 1221 | $1,325 | $1.09 | 25d | 1 | 0.76mi |
| 98 Milwaukee Blvd Lehigh Acres, FL | 2.0 | 2.0 | 1221 | $1,325 | $1.09 | 5d | 1 | 0.76mi |
| 2513 48th St SW Lehigh Acres, FL | 3.0 | 2.0 | 1423 | $1,750 | $1.23 | 17d | 1 | 0.77mi |
| 20699 Hazelnut Ct Lehigh Acres, FL | 2.0 | 2.0 | 1564 | $2,351 | $1.50 | 25d | 1 | 0.79mi |
| 208 Pembroke St Lehigh Acres, FL | 3.0 | 2.0 | 1545 | $2,100 | $1.36 | 25d | 1 | 0.84mi |
| 2916 42nd St SW Lehigh Acres, FL | 3.0 | 2.0 | 1399 | $1,930 | $1.38 | 3d | 1 | 0.85mi |
| 2916 42nd St SW Lehigh Acres, FL | 3.0 | 2.0 | 1399 | $1,960 | $1.40 | 5d | 1 | 0.85mi |
| 2602 24th St SW Lehigh Acres, FL | 3.0 | 2.0 | 1358 | $1,800 | $1.33 | 5d | 1 | 0.85mi |
| 115 Milwaukee Blvd Lehigh Acres, FL | 3.0 | 2.0 | 1209 | $1,600 | $1.32 | 25d | 1 | 0.86mi |
| 507 Peerless Cir Lehigh Acres, FL | 3.0 | 2.0 | 1408 | $2,000 | $1.42 | 5d | 1 | 0.86mi |
| 507 Peerless Cir Lehigh Acres, FL | 3.0 | 2.0 | 1408 | $2,100 | $1.49 | 25d | 1 | 0.86mi |
| 18461 Copperhead Dr #431 Lehigh Acres, FL | 3.0 | 2.0 | 1301 | $3,995 | $3.07 | 25d | 1 | 0.89mi |
| 18461 Copperhead Dr #421 Lehigh Acres, FL | 3.0 | 2.0 | 1301 | $1,895 | $1.46 | 25d | 1 | 0.89mi |
| 18461 Copperhead Dr #436 Lehigh Acres, FL | 2.0 | 2.0 | 1154 | $3,495 | $3.03 | 25d | 1 | 0.89mi |
| 9099 Leatherwood Loop Lehigh Acres, FL | 2.0 | 2.0 | 1564 | $2,400 | $1.53 | 25d | 1 | 0.90mi |
| 137 Milwaukee Blvd Lehigh Acres, FL | 3.0 | 2.0 | 1170 | $1,600 | $1.37 | 25d | 1 | 0.90mi |
| 2811 25th St SW Unit NA Lehigh Acres, FL | 3.0 | 2.0 | 1430 | $1,990 | $1.39 | 25d | 1 | 0.93mi |
| 3012 40th St SW Lehigh Acres, FL | 3.0 | 2.0 | 1427 | $1,950 | $1.37 | 25d | 1 | 0.93mi |
Listing history 2 events
-
2026-04-14status Pending
-
2026-04-07$220,000 Active
ⓘ Source: listings_history table (triggers on properties + properties_extension) + one-shot
backfill from property_details.listing_events for pre-trigger history.
Tax reassessment forecast FL · Resets to sale price
- Current annual tax
- $3,632 · $303/mo
- Projected year-2 tax
- $3,632 · $303/mo
- Expected delta
- $0/yr ($0/mo · -0.0%)
ⓘ Screening estimate from a state-policy table — verify with the county assessor before closing.
Climate risk First Street
- Flood 1/10 Low FEMA zone X (unshaded) · 0% chance over 30 yrs
- Wildfire 3/10 Moderate
- Heat 10/10 Extreme 7 d/yr ≥107°F today · 28 d/yr by 30 yrs out
- Wind 10/10 Extreme 99% chance of damaging wind over 30 yrs
- Air quality 2/10 Low 1 unhealthy d/yr today · 1 by 30 yrs out
Nearby sold comps map
Loading sold comps map…
Walkable amenities ~0.75 mi
Loading nearby amenities…
Taxation est. · year 1
- Rental income
- $25,326
- − Mortgage interest
- −$12,323
- − Property taxes
- −$3,632
- − Insurance
- −$1,100
- − Repairs & maintenance
- −$2,026
- − Management
- −$2,026
- − Depreciation
- −$6,400
- Taxable loss
- −$2,181
- Est. tax savings @ 24.0%
- +$523
- After-tax cash flow
- $1,955/yr
For passive investors: Depreciation is non-cash, so a rental often shows a tax loss while cash-flowing — sheltering income. Rental losses are passive: they offset passive income freely, and up to $25,000/yr can offset ordinary (W-2) income if you actively participate and your MAGI is under $100k (phasing out to $0 by $150k); unused losses carry forward. On sale, claimed depreciation is recaptured at up to 25%, and gains may owe capital-gains tax (a 1031 exchange can defer both). Figures are a year-1 estimate at your 24.0% rate — not tax advice; consult a CPA.
Schools (NCES district)
- District
- Lee
- NCES district ID
- 1201080
- Math proficiency
- 47% ▼ -11.00%
- Reading proficiency
- 50% ▼ -4.00%
- Median HH income
- $49,518
- Composite
- 41.49/100
- National rank
- #3458
- State rank
- #42 of 73 in FL
Livability — Lehigh Acres
- Score
- 59/100
- State rank
- #826
- US rank
- #20055
Category grades
Schools grade is shown separately in the Schools card above.
Census & demographics
- Census place
- Lehigh Acres, FL
- County
- Lee County · 788,662 people
- City population
- 130,638
- Metro
- Cape Coral-Fort Myers, FL
- Population (ZIP)
- 20,277
- Household income
- $72,679
- Rent vs Own
- Severe rent burden
- 574.0
Population outlook (Lee County) Hauer SSP2
- Today (2025)
- 871,946 people
- By 2030
- 955,468 · +9.6%
- By 2040
- 1,113,587 · +27.7%
- By 2050
- 1,256,891 · +44.1%
- By 2075
- 1,560,270 · +78.9%
- By 2100
- 1,726,848 · +98.0%
Race, ethnicity, and origin ACS 2023
- Neighborhood character
- Diverse neighborhood (Simpson 0.65)
- Race & ethnicity
- Hispanic / Latino 50% Two or more races 30% White 24% Black 20% Asian 3%
- Hispanic origin (detail)
- Mexican 8% Puerto Rican 8% Cuban 18% Dominican 4%
- Common ancestry
- Hispanic 8% Slovak 1% Lithuanian 1%
- Foreign-born
- 35% · Canada, Jamaica, Vietnam
- Languages at home
- 46% English-only · Spanish 43% French/Haitian/Cajun 8% Vietnamese 1%
Political lean MEDSL · Lee
- 2024 margin
- Strong R (+28.4) · D 35.5% · R 63.9%
- 2008→2024 swing
- -18.0pp toward R · 2008: -10.4pp · 2024: -28.4pp
- All cycles
- 2024: R+28.4 2020: R+19.2 2016: R+20.4 2012: R+16.6 2008: R+10.4
Not yet ingested
- Civics
- —
Market trends
- HPI YoY
- ▲ 21.77%
- Current HPI
- 340.4255
- Rent YoY
- ▼ -1.54%
- Metro
- Cape Coral-Fort Myers, FL
- State GDP YoY
- ▲ 3.28%
- F500 in state
- 36
Industry mix (Fortune 500 HQ in FL)
| Industry | F500 HQs | Revenue |
|---|---|---|
| Industrial Technology | 2 | $29B |
|
||
| Insurance | 2 | $17B |
|
||
| Retail | 1 | $60B |
|
||
| Technology Distribution | 1 | $58B |
|
||
| Homebuilding | 1 | $35B |
|
||
| Technology Manufacturing | 1 | $35B |
|
||
Price history
2 events — show timeline
- 2026-04-14 Pending — FORTMLS
- 2026-04-07 Listed $220,000 FORTMLS
Property tax history
+14.9%/yrLatest (2025): $3,632 · +1.9% YoY. Source: county tax records.
Cash-flow waterfall
monthlySold comps — $/sqft
last 12 mo · ≤1 miLoading sold comps…