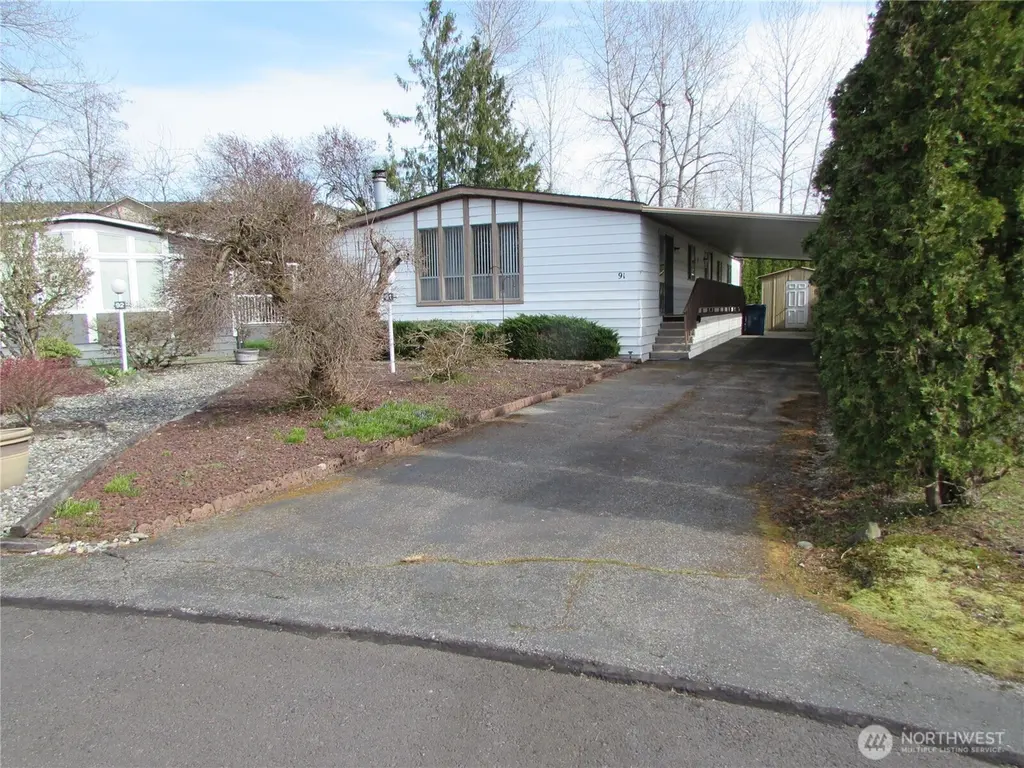
5900 64th St NE Unit Sp 91 · Marysville, WA
Flood risk No data
- FEMA flood zone
- —
- Chance of flooding over 30 yrs
- —
- Est. flood insurance / yr
- —
Fire risk No data
- Est. fire insurance / yr
- —
Heat risk No data
- Hot days now (above threshold)
- —
- Hot days in 30 yrs
- —
Wind risk No data
- Chance of severe wind over 30 yrs
- —
Air-quality risk No data
- Unhealthy air days now
- —
- Unhealthy air days in 30 yrs
- —
Risk factors via First Street. Map © Google.
Why this score? — see what drove the B+ grade
The composite is a weighted blend of 9 inputs, each scored 0–100. Each bar is that input's sub-score; the figure is the points it added to the 100-point composite (weight × sub-score).
- Cash flow +30.0/30.0
- ARV discount +14.3/15.0
- 1% rule +10.0/10.0
- DSCR +10.0/10.0
- Livability +4.2/5.0
- Schools +4.1/10.0
- Rent growth +2.9/5.0
- Condition / age +2.5/5.0
- Appreciation +0.0/10.0
$97,500
🖨 Deal sheet 📄 Offer letter ✓ Due diligence
Listing remarks
Large, well maintained (1,782 Sq Ft), 3 bedroom & 2 Bath, quality features sprinkled thru out this well-built Glen River Home. Biggest home avail. in Park, located in Desirable Glenwood Estates Senior Park in South Marysville. Park is across from YMCA (w/ pool), Walmart/ Golf and Jenning Park is w/ in blocks of Home. Extr. of home features Semi-private (Cul de sac) setting with large, covered deck & Parking. Large, open tree lined common areas around home are maintained by Park, shed w/ power and visiting deer family on occasion. Interior features include Family room w/ built-in wall fireplace next to open kitchen w/ eating bar, separate dining room and Living room. Primar
Key facts
- Covered deck
- Recent upgrades
- Move in ready
Tags
Neighborhood map
What this means for you Summary
Snapshot
- This is a 3-bed/2.0-bath manufactured listed at $98k.
Deal economics
- At list price, monthly cash flow is $2k ($23k/yr) — positive.
- The deal already cash-flows at list — no discount required.
- Meets the 1% rule at list price ($3k rent vs $98k).
- Recommended offer: $92k (6.0% below list) — sets the bar for market timing.
- Cap rate 29.8% vs local median 3.0% in Marysville — top-decile yield for the area; either an underpriced asset or a hidden risk that comps aren't pricing in. Stress-test before assuming the spread holds.
Location & tenants
- Location reads 84/100 on livability (#43 in WA, #768 nationally) — a professional / high-income tenant draw. Strengths: commute A+, employment A+, housing A+; Watch: cost of living F.
- Marysville School District (suburban): math 36% / reading 51% proficiency, ranked #177 of 291 in WA (top 61%) — families likely to look elsewhere, expect single-tenant / working-renter base with shorter leases.
- Market conditions: Rents rising (+1.7%/yr); 430 active listings in the ZIP; 9 comparable units currently listed for rent nearby; rentals at typical pace (median 22d on market — plan ~3-4 weeks tenant-placement turnaround); 44% of comp listings sitting > 30 days — soft ceiling on asking rent; solid renter incomes; 3,982 units permitted in Snohomish County in 2024 (1,492 in 5+ unit buildings).
- This rent runs 36% of the median local income ($108k/yr) — at the standard rent-burdened threshold; future hikes will face affordability resistance.
Forward outlook
- Local home prices are declining (-3.0%/yr); year-one equity from $674 of loan paydown is wiped out by about $3k of value loss. Plan a longer hold.
- Snohomish County population projected at +30% by 2050 — long-run rental-demand tailwind backs the buy-and-hold thesis.
- At projected returns (-3.0% appreciation + 1.7% rent growth), your $27k cash investment doubles in ~2 years — after that, you're playing with house money.
Negotiation context
- It's been on market 78 days — a 6% lower offer ($92k) is reasonable based on typical stale-listing flexibility.
Questions for the listing agent
- It's been on market 78 days. Have you received any prior offers? Is the seller open to a 6% concession, seller financing, or rate buy-down credit?
- Built in 1979 — when were the roof, HVAC, electrical panel, plumbing, and water heater last replaced?
- Why hasn't it sold? Are there any deal-killer items the seller is aware of (foundation, flood, title, zoning, code violations)?
- Is there a deadline driving the sale (1031 exchange, divorce, estate, relocation)? That informs how much negotiation room exists.
- Schools are B-rated — typically a magnet for longer-tenancy family renters. What's the average tenant stay here, and is there a school-zone premium baked into asking?
- What's the average days-on-market for RENTAL listings here right now (not sales)? A rising rental-DOM trend means longer vacancies and softer asking-rent achievability than the comps imply.
- What's the recent tenant-quality profile in this submarket — average credit score on applications, eviction rate, late-payment / NSF rate, and stable-employment percentage? A property-management company in the area should have these aggregated.
- How much new for-sale + rental construction is in the pipeline within 1–3 miles? Heavy new supply typically softens prices + rents 12–24 months out; constrained supply supports both.
Investment metrics
- 1% rule
- 3.35% ✓
- Cap rate
- 29.77%
- Cash-on-cash
- 83.85%
- DSCR
- 4.73
- GRM
- 2.5
CMA / ARV
- ARV (median comp)
- $115,000
- List price
- $97,500
- Delta
- -15.22%
- Verdict
- UNDERPRICED
- Comps
- 7 within 1.0 mi
Show comp detail 2 sales within ~0.75 mi
| Address | Dist | Beds/Ba | Sqft | Sold | Price | $/sf | Match |
|---|---|---|---|---|---|---|---|
| 5900 64th St NE #215 | 0.00mi | 3/2.0 | 1,728 (-3%) | 17mo | $100,000 | $58 | 81 |
| 5900 64th St NE #219 | 0.00mi | 3/2.0 | 1,600 (-10%) | 16mo | $120,000 | $75 | 69 |
Match score weights: distance 35% · size 25% · config 20% · recency 20%. Top-matched comps best support the ARV.
Projected returns pro-forma
-3.0% appreciation · 1.66% rent growth · sell at horizon
- IRR
- 82.7%
- Equity multiple
- 4.71×
- Total profit
- $101,391
- Equity at exit
- $14,538
- IRR
- 85.7%
- Equity multiple
- 9.34×
- Total profit
- $227,561
- Equity at exit
- $8,430
Cash invested: $27,300 (down + closing). Projections, not guarantees.
Landlord ↔ Tenant lean methodology
- Overall (STATE)
- 28 Tenant-Leaning
- State Washington
- 28 Tenant-Leaning · D+8
- County
- — inherits STATE
- City
- — inherits STATE
ZIP-level market 98270
- Rents YoY
- 1.7%
- Active inventory
- 430
- Price-to-rent
- 2.5×
Monthly cashflow live
- Estimated rent
- $3,267 high interval (Pro) →
- Mortgage (P&I)
- −$511
- Tax est. 1.5%
- −$122 /mo · $1,462/yr
- Insurance
- −$41
- HOA
- −$0
- Vacancy / Maint / Mgmt
- −$686
- Net cashflow
- $1,907
Break-even live
UW: 25.0% down · 7.5% · 30yr · 1.5% tax · 5.0% vac · 8.0% maint · 8.0% mgmt
Financing live
Cash to close
- Down payment
- $24,375
- Closing costs
- $2,925
- Reserves months
- —
- Total cash needed
- —
Loan-product check · same deal, 3 products live
Conventional
25% down · 7.5% · 30yr
- Down + closing
- —
- Monthly P&I
- —
- Monthly cashflow
- —
- DSCR
- —
- Eligible?
- —
Personal DTI + credit; lowest rate.
DSCR
20% down · 8.5% · 30yr
- Down + closing
- —
- Monthly P&I
- —
- Monthly cashflow
- —
- DSCR
- —
- Eligible?
- —
No personal income docs; deal must DSCR.
Hard money
10% down · 12.0% · 12mo
- Down + closing
- —
- Monthly P&I
- —
- Monthly cashflow
- —
- DSCR
- —
- Eligible?
- —
Short-term bridge; refi at stabilization.
Rent comps 9 comps
| Address | Beds | Baths | Sqft | Rent | $/sqft | DOM | Units | Dist |
|---|---|---|---|---|---|---|---|---|
| 5127 61st St NE Marysville, WA | 2.0 | 2.0 | 1232 | $2,795 | $2.27 | 18d | 1 | 0.49mi |
| 6514 69th St NE Marysville, WA | 3.0 | 2.0 | 1317 | $3,700 | $2.81 | 43d | 1 | 0.62mi |
| 4716 Grove St Marysville, WA | 4.0 | 3.5 | 2000 | $3,095 | $1.55 | 43d | 1 | 1.00mi |
| 4814 72nd Dr NE Marysville, WA | 4.0 | 2.5 | 1882 | $3,065 | $1.63 | 16d | 1 | 1.10mi |
| 7625 51st Ave NE Unit A Marysville, WA | 2.0 | 2.5 | 1286 | $2,195 | $1.71 | 22d | 1 | 1.12mi |
| 6412 77th Dr NE Marysville, WA | 4.0 | 2.5 | 2609 | $3,490 | $1.34 | 1d | 1 | 1.19mi |
| 7901 55th Pl NE Marysville, WA | 3.0 | 2.5 | 1933 | $3,700 | $1.91 | 2d | 1 | 1.29mi |
| 7924 67th St NE Marysville, WA | 3.0 | 2.5 | 1282 | $2,800 | $2.18 | 43d | 1 | 1.35mi |
| 4453 74th Dr NE Marysville, WA | 3.0 | 2.5 | 1495 | $2,950 | $1.97 | 43d | 1 | 1.35mi |
Listing history 15 events
-
2026-06-18days on market $97,500 Active 78 DOM
-
2026-06-17days on market $97,500 Active 77 DOM
-
2026-06-16days on market $97,500 Active 76 DOM
-
2026-06-15days on market $97,500 Active 75 DOM
-
2026-06-13days on market $97,500 Active 73 DOM
-
2026-06-09days on market $97,500 Active 69 DOM
-
2026-06-08days on market $97,500 Active 68 DOM
-
2026-06-07days on market $97,500 Active 67 DOM
-
2026-06-04days on market $97,500 Active 64 DOM
-
2026-06-03days on market $97,500 Active 63 DOM
-
2026-06-02days on market $97,500 Active 62 DOM
-
2026-06-01days on market $97,500 Active 61 DOM
-
2026-05-31days on market $97,500 Active 60 DOM
-
2026-04-25price $97,500
-
2026-04-01$117,500 Active
ⓘ Source: listings_history table (triggers on properties + properties_extension) + one-shot
backfill from property_details.listing_events for pre-trigger history.
Nearby sold comps map
Loading sold comps map…
Walkable amenities ~0.75 mi
Loading nearby amenities…
Taxation est. · year 1
- Rental income
- $39,209
- − Mortgage interest
- −$5,462
- − Property taxes
- −$1,462
- − Insurance
- −$488
- − Repairs & maintenance
- −$3,137
- − Management
- −$3,137
- − Depreciation
- −$2,836
- Taxable income
- $22,688
- Est. tax owed @ 24.0%
- −$5,445
- After-tax cash flow
- $17,445/yr
For passive investors: Depreciation is non-cash, so a rental often shows a tax loss while cash-flowing — sheltering income. Rental losses are passive: they offset passive income freely, and up to $25,000/yr can offset ordinary (W-2) income if you actively participate and your MAGI is under $100k (phasing out to $0 by $150k); unused losses carry forward. On sale, claimed depreciation is recaptured at up to 25%, and gains may owe capital-gains tax (a 1031 exchange can defer both). Figures are a year-1 estimate at your 24.0% rate — not tax advice; consult a CPA.
Schools (NCES district)
- District
- Marysville School District
- NCES district ID
- 5304860
- Math proficiency
- 36% ▼ -1.00%
- Reading proficiency
- 51% ▲ 2.00%
- Median HH income
- $67,461
- Composite
- 41.31/100
- National rank
- #7367
- State rank
- #177 of 291 in WA
Livability — Marysville
- Score
- 84/100
- State rank
- #43
- US rank
- #768
Category grades
Schools grade is shown separately in the Schools card above.
Census & demographics
- Census place
- Marysville, WA
- County
- Snohomish County · 786,756 people
- City population
- 85,887
- Metro
- Seattle-Tacoma-Bellevue, WA
- Population (ZIP)
- 55,049
- Household income
- $108,147
- Rent vs Own
- Severe rent burden
- 1150.0
Population outlook (Snohomish County) Hauer SSP2
- Today (2025)
- 899,800 people
- By 2030
- 960,975 · +6.8%
- By 2040
- 1,074,447 · +19.4%
- By 2050
- 1,171,954 · +30.2%
- By 2075
- 1,384,849 · +53.9%
- By 2100
- 1,497,296 · +66.4%
Race, ethnicity, and origin ACS 2023
- Neighborhood character
- Diverse neighborhood (Simpson 0.55)
- Race & ethnicity
- White 64% Hispanic / Latino 17% Two or more races 14% Asian 8% Black 3% Native American 2%
- Hispanic origin (detail)
- Mexican 13%
- Common ancestry
- Portuguese 5% Italian 3% Lithuanian 2%
- Foreign-born
- 14% · Canada, China, Vietnam
- Languages at home
- 79% English-only · Spanish 9% Russian/Polish/Slavic 4% Tagalog/Filipino 2%
Political lean MEDSL · Snohomish
- 2024 margin
- D (+19.0) · D 57.8% · R 38.9% · Other 3.3%
- 2008→2024 swing
- +0.1pp no change · 2008: 18.9pp · 2024: 19.0pp
- All cycles
- 2024: D+19.0 2020: D+20.6 2016: D+16.6 2012: D+16.2 2008: D+18.9
Not yet ingested
- Civics
- —
Market trends
- HPI YoY
- ▼ -673.52%
- Current HPI
- 321.1535
- Rent YoY
- ▲ 1.66%
- Metro
- Seattle-Tacoma-Bellevue, WA
- State GDP YoY
- ▲ 4.65%
- F500 in state
- 22
Industry mix (Fortune 500 HQ in WA)
| Industry | F500 HQs | Revenue |
|---|---|---|
| Retail | 2 | $269B |
|
||
| Technology / Retail | 1 | $638B |
|
||
| Technology | 1 | $245B |
|
||
| Telecommunications | 1 | $38B |
|
||
| Food / Beverage | 1 | $36B |
|
||
| Automotive / Trucks | 1 | $34B |
|
||
Price history
-17.0% since first listed2 events — show timeline
- 2026-04-25 Price Changed $97,500 NWMLS as Distributed by MLS Grid
- 2026-04-01 Listed $117,500 NWMLS as Distributed by MLS Grid
Cash-flow waterfall
monthlySold comps — $/sqft
last 12 mo · ≤1 miLoading sold comps…