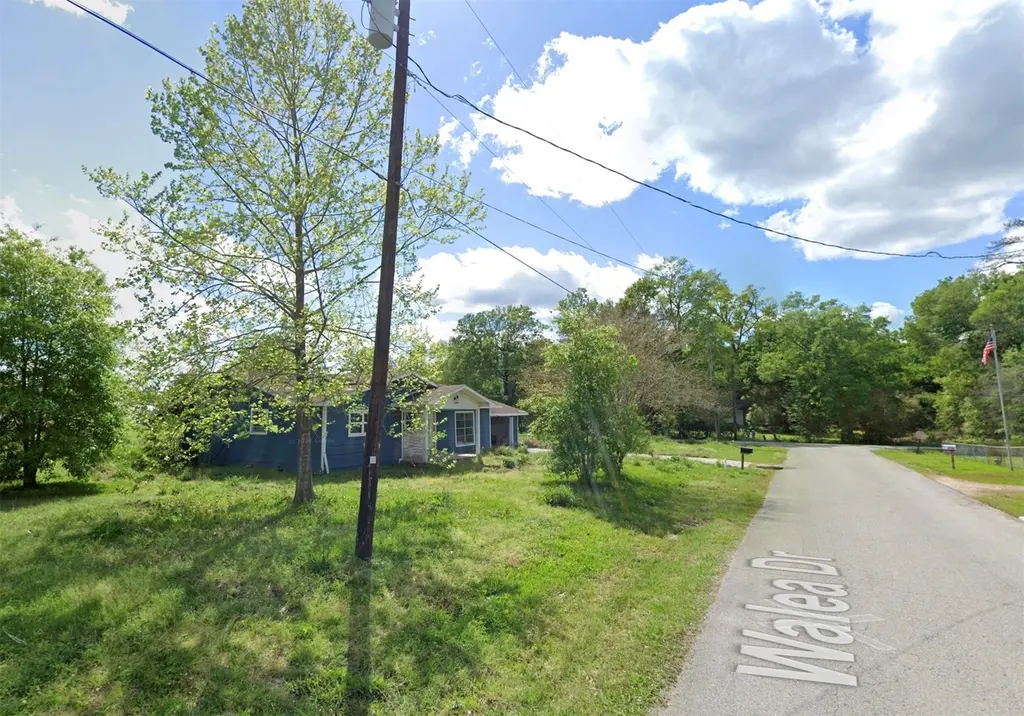
4777 Walea Dr · Orange, TX
Flood risk 6/10 · Moderate
- FEMA flood zone
- X (unshaded)
- Chance of flooding over 30 yrs
- 0.67%
- Est. flood insurance / yr
- $507 – $1,088
Fire risk 3/10 · Minor
- Est. fire insurance / yr
- $1,222 – $2,270
Heat risk 9/10 · Severe
- Hot days now (above 108°F)
- 7 days/yr
- Hot days in 30 yrs
- 22 days/yr
Wind risk 9/10 · Severe
- Chance of severe wind over 30 yrs
- 99.0%
Air-quality risk 2/10 · Minimal
- Unhealthy air days now
- 1 days/yr
- Unhealthy air days in 30 yrs
- 1 days/yr
Risk factors via First Street. Map © Google.
Why this score? — see what drove the C- grade
The composite is a weighted blend of 9 inputs, each scored 0–100. Each bar is that input's sub-score; the figure is the points it added to the 100-point composite (weight × sub-score).
- Cash flow +15.9/30.0
- ARV discount +15.0/15.0
- DSCR +4.9/10.0
- 1% rule +4.7/10.0
- Schools +4.1/10.0
- Livability +3.6/5.0
- Rent growth +2.5/5.0
- Condition / age +2.5/5.0
- Appreciation +0.0/10.0
$169,000
🖨 Deal sheet 📄 Offer letter ✓ Due diligence
Listing remarks MLS
This single-family home is located at 4777 Walea Dr, Orange, TX. 4777 Walea Dr is in Orange, TX and in ZIP code 77632. This property has 4 bedrooms, 2 bathrooms and approximately 1,554 sqft of floor space. This property has a lot size of 0.59 acres and was built in 1962.
Key facts
- 0.59 acre lot
- Garage
- Built 1962
Neighborhood map
What this means for you Summary
Snapshot
- This is a 4-bed/2.0-bath single-family listed at $169k.
Deal economics
- At list price, monthly cash flow is $81 ($977/yr) — positive.
- The deal already cash-flows at list — no discount required.
- To meet the 1% rule (rent ≥ 1% of price), the offer needs to be $163k (3.5% below list).
- Recommended offer: $149k (12.0% below list) — sets the bar for market timing.
- Cap rate 6.9% vs local median 3.9% in Orange — top-decile yield for the area; either an underpriced asset or a hidden risk that comps aren't pricing in. Stress-test before assuming the spread holds.
Location & tenants
- Location reads 71/100 on livability (#286 in TX) — a middle-class / working-renter tenant base. Strengths: cost of living A+, housing A+, health & safety A+; Watch: crime D+, employment D+, schools D-.
- Orangefield ISD (rural): math 44% / reading 48% proficiency, ranked #217 of 826 in TX (top 26%) — families likely to look elsewhere, expect single-tenant / working-renter base with shorter leases.
- Market conditions: 294 active listings in the ZIP; 235 units permitted in Orange County in 2024 (50 in 5+ unit buildings).
Forward outlook
- Local home prices are declining (-3.0%/yr); year-one equity from $1k of loan paydown is wiped out by about $5k of value loss. Plan a longer hold.
- Orange County population projected at +6% by 2050 — modest demand growth; plan on rents tracking national, not racing it.
Negotiation context
- It's been on market 131 days — a 12% lower offer ($149k) is reasonable based on typical stale-listing flexibility.
- 6 sale attempts since 7y ago with the ask held roughly flat each time — persistent listings suggest the price (not the market) is what's stuck; bring a comps-based counter.
Risks & watch-outs
- Climate carrying-cost: major flood risk; severe wind risk, 99% chance of damaging wind over 30y; extreme-heat days projected 7→22/yr by 2055 (HVAC capex compounding) — expect insurance premiums to compound above CPI over the hold.
Questions for the listing agent
- It's been on market 131 days. Have you received any prior offers? Is the seller open to a 12% concession, seller financing, or rate buy-down credit?
- Built in 1962 — when were the roof, HVAC, electrical panel, plumbing, and water heater last replaced?
- Why hasn't it sold? Are there any deal-killer items the seller is aware of (foundation, flood, title, zoning, code violations)?
- Is there a deadline driving the sale (1031 exchange, divorce, estate, relocation)? That informs how much negotiation room exists.
- Schools are D-rated, which usually means shorter tenancies and higher turnover. Who's the typical renter profile here, and what's been the actual vacancy rate?
- Crime grade is D in this area — have there been break-ins, vandalism, or insurance claims at this property in the last 3 years? What carrier currently insures it and at what premium?
- What's the average days-on-market for RENTAL listings here right now (not sales)? A rising rental-DOM trend means longer vacancies and softer asking-rent achievability than the comps imply.
- What's the recent tenant-quality profile in this submarket — average credit score on applications, eviction rate, late-payment / NSF rate, and stable-employment percentage? A property-management company in the area should have these aggregated.
- How much new for-sale + rental construction is in the pipeline within 1–3 miles? Heavy new supply typically softens prices + rents 12–24 months out; constrained supply supports both.
Investment metrics
- 1% rule
- 0.97% ✗
- Cap rate
- 6.87%
- Cash-on-cash
- 2.06%
- DSCR
- 1.09
- GRM
- 8.6
CMA / ARV
- ARV (median comp)
- $250,000
- List price
- $169,000
- Delta
- -32.40%
- Verdict
- UNDERPRICED
- Comps
- 3 within 1.0 mi
Show comp detail 1 sale within ~0.75 mi
| Address | Dist | Beds/Ba | Sqft | Sold | Price | $/sf | Match |
|---|---|---|---|---|---|---|---|
| 379 Rose Ln | 0.12mi | 3/2.0 (-1) | 1,584 (+2%) | 5mo | $250,000 | $158 | 82 |
Match score weights: distance 35% · size 25% · config 20% · recency 20%. Top-matched comps best support the ARV.
Projected returns pro-forma
-3.0% appreciation · 3.0% rent growth · sell at horizon
- IRR
- -13.0%
- Equity multiple
- 0.53×
- Total profit
- $-22,152
- Equity at exit
- $25,198
- IRR
- -4.0%
- Equity multiple
- 0.74×
- Total profit
- $-12,415
- Equity at exit
- $14,612
Cash invested: $47,320 (down + closing). Projections, not guarantees.
Landlord ↔ Tenant lean methodology
- Overall (STATE)
- 87 Strongly Landlord-Friendly
- State Texas
- 87 Strongly Landlord-Friendly · R+5
- County
- — inherits STATE
- City
- — inherits STATE
ZIP-level market 77632
- Home prices YoY
- -31.6%
- Active inventory
- 294
- Price-to-rent
- 8.6×
Monthly cashflow live
- Estimated rent
- $1,631 medium interval (Pro) →
- Mortgage (P&I)
- −$886
- Tax from tax record
- −$251 /mo · $3,007/yr
- Insurance
- −$70
- HOA
- −$0
- Vacancy / Maint / Mgmt
- −$343
- Net cashflow
- $81
Break-even live
UW: 25.0% down · 7.5% · 30yr · 1.5% tax · 5.0% vac · 8.0% maint · 8.0% mgmt
Financing live
Cash to close
- Down payment
- $42,250
- Closing costs
- $5,070
- Reserves months
- —
- Total cash needed
- —
Loan-product check · same deal, 3 products live
Conventional
25% down · 7.5% · 30yr
- Down + closing
- —
- Monthly P&I
- —
- Monthly cashflow
- —
- DSCR
- —
- Eligible?
- —
Personal DTI + credit; lowest rate.
DSCR
20% down · 8.5% · 30yr
- Down + closing
- —
- Monthly P&I
- —
- Monthly cashflow
- —
- DSCR
- —
- Eligible?
- —
No personal income docs; deal must DSCR.
Hard money
10% down · 12.0% · 12mo
- Down + closing
- —
- Monthly P&I
- —
- Monthly cashflow
- —
- DSCR
- —
- Eligible?
- —
Short-term bridge; refi at stabilization.
Listing history 31 events
-
2026-06-18days on market $169,000 Active 131 DOM
-
2026-06-17days on market $169,000 Active 130 DOM
-
2026-06-16days on market $169,000 Active 129 DOM
-
2026-06-15days on market $169,000 Active 128 DOM
-
2026-06-14days on market $169,000 Active 126 DOM
-
2026-06-13days on market $169,000 Active 125 DOM
-
2026-06-10days on market $169,000 Active 123 DOM
-
2026-06-09days on market $169,000 Active 122 DOM
-
2026-06-08days on market $169,000 Active 121 DOM
-
2026-06-07days on market $169,000 Active 120 DOM
-
2026-06-03days on market $169,000 Active 116 DOM
-
2026-06-02days on market $169,000 Active 115 DOM
-
2026-06-01days on market $169,000 Active 114 DOM
-
2026-05-31days on market $169,000 Active 113 DOM
-
2026-05-30days on market $169,000 Active 112 DOM
-
2026-02-12historical $4,500
-
2026-02-07$169,000 Active 273-char remark
Show marketing remark (273 chars)
This single-family home is located at 4777 Walea Dr, Orange, TX. 4777 Walea Dr is in Orange, TX and in ZIP code 77632. This property has 4 bedrooms, 2 bathrooms and approximately 1,554 sqft of floor space. This property has a lot size of 0.59 acres and was built in 1962.
-
2025-12-31historical
-
2025-11-27$4,500
-
2025-11-20historical $4,500
-
2025-07-08$4,500
-
2025-06-26historical $4,500
-
2025-05-18price $200,000
-
2024-10-11$4,500
-
2024-06-24$169,000 Active
-
2021-08-09soldstatus
-
2020-01-31historical
-
2019-12-12soldstatus
-
2019-10-16$115,000
-
2018-06-15soldstatus
-
2014-08-29soldstatus
ⓘ Source: listings_history table (triggers on properties + properties_extension) + one-shot
backfill from property_details.listing_events for pre-trigger history.
Tax reassessment forecast TX · Resets to sale price
- Current annual tax
- $3,007 · $251/mo
- Projected year-2 tax
- $3,093 · $258/mo
- Expected delta
- +$85/yr (+$7/mo · 2.8%)
ⓘ Screening estimate from a state-policy table — verify with the county assessor before closing.
Climate risk First Street
- Flood 6/10 Major FEMA zone X (unshaded) · 67% chance over 30 yrs
- Wildfire 3/10 Moderate
- Heat 9/10 Extreme 7 d/yr ≥108°F today · 22 d/yr by 30 yrs out
- Wind 9/10 Extreme 99% chance of damaging wind over 30 yrs
- Air quality 2/10 Low 1 unhealthy d/yr today · 1 by 30 yrs out
Nearby sold comps map
Loading sold comps map…
Walkable amenities ~0.75 mi
Loading nearby amenities…
Taxation est. · year 1
- Rental income
- $19,575
- − Mortgage interest
- −$9,467
- − Property taxes
- −$3,007
- − Insurance
- −$845
- − Repairs & maintenance
- −$1,566
- − Management
- −$1,566
- − Depreciation
- −$4,916
- Taxable loss
- −$1,792
- Est. tax savings @ 24.0%
- +$430
- After-tax cash flow
- $1,407/yr
For passive investors: Depreciation is non-cash, so a rental often shows a tax loss while cash-flowing — sheltering income. Rental losses are passive: they offset passive income freely, and up to $25,000/yr can offset ordinary (W-2) income if you actively participate and your MAGI is under $100k (phasing out to $0 by $150k); unused losses carry forward. On sale, claimed depreciation is recaptured at up to 25%, and gains may owe capital-gains tax (a 1031 exchange can defer both). Figures are a year-1 estimate at your 24.0% rate — not tax advice; consult a CPA.
Schools (NCES district)
- District
- Orangefield ISD
- NCES district ID
- 4833780
- Math proficiency
- 44% ▬ 0.00%
- Reading proficiency
- 48% ▬ 0.00%
- Median HH income
- $63,682
- Composite
- 40.77/100
- National rank
- #3647
- State rank
- #217 of 826 in TX
Livability — Orange
- Score
- 71/100
- State rank
- #286
- US rank
- #6456
Category grades
Schools grade is shown separately in the Schools card above.
Census & demographics
- County
- Orange County · 87,112 people
- City population
- 22,976
- Metro
- Beaumont-Port Arthur, TX
- Population (ZIP)
- 22,976
- Household income
- $74,418
- Rent vs Own
- Severe rent burden
- 431.0
Population outlook (Orange County) Hauer SSP2
- Today (2025)
- 88,065 people
- By 2030
- 89,591 · +1.7%
- By 2040
- 91,982 · +4.4%
- By 2050
- 93,023 · +5.6%
- By 2075
- 94,871 · +7.7%
- By 2100
- 88,155 · +0.1%
Race, ethnicity, and origin ACS 2023
- Neighborhood character
- Predominantly White (85%)
- Race & ethnicity
- White 85% Hispanic / Latino 8% Two or more races 6% Black 4%
- Hispanic origin (detail)
- Mexican 6%
- Common ancestry
- Lithuanian 8% Slovak 2% Italian 2%
- Foreign-born
- 2% · Canada
- Languages at home
- 95% English-only · Spanish 4%
Political lean MEDSL · Orange
- 2024 margin
- Solid R (+66.8) · D 16.4% · R 83.1%
- 2008→2024 swing
- -19.6pp toward R · 2008: -47.1pp · 2024: -66.8pp
- All cycles
- 2024: R+66.8 2020: R+63.4 2016: R+61.9 2012: R+54.3 2008: R+47.1
Not yet ingested
- Civics
- —
Market trends
- HPI YoY
- ▼ -68.96%
- Current HPI
- 149.354
- Rent YoY
- —
- Metro
- Beaumont-Port Arthur, TX
- State GDP YoY
- ▲ 3.95%
- F500 in state
- 110
Industry mix (Fortune 500 HQ in TX)
| Industry | F500 HQs | Revenue |
|---|---|---|
| Energy | 16 | $1,198B |
|
||
| Technology | 5 | $198B |
|
||
| Engineering / Construction | 4 | $72B |
|
||
| Energy Services | 3 | $60B |
|
||
| Utilities | 3 | $41B |
|
||
| Healthcare | 2 | $330B |
|
||
Price history
-96.1% since first listed16 events — show timeline
- 2026-02-12 Rental Removed $4,500 HARMLS
- 2026-02-07 Listed $169,000 HARMLS
- 2025-12-31 Listing Removed — HARMLS
- 2025-11-27 Listed for Rent $4,500 HARMLS
- 2025-11-20 Rental Removed $4,500 HARMLS
- 2025-07-08 Listed for Rent $4,500 HARMLS
- 2025-06-26 Rental Removed $4,500 HARMLS
- 2025-05-18 Price Changed $200,000 HARMLS
- 2024-10-11 Listed for Rent $4,500 HARMLS
- 2024-06-24 Listed $169,000 HARMLS
- 2021-08-09 Sold (Public Records) — Public Records
- 2020-01-31 Listing Removed — HARMLS
- 2019-12-12 Sold (Public Records) — Public Records
- 2019-10-16 Listed $115,000 HARMLS
- 2018-06-15 Sold (Public Records) — Public Records
- 2014-08-29 Sold (Public Records) — Public Records
Property tax history
+6.9%/yrLatest (2025): $3,007 · -2.6% YoY. Source: county tax records.
Cash-flow waterfall
monthlySold comps — $/sqft
last 12 mo · ≤1 miLoading sold comps…