7346 Shirley Dr · Easton, MD
Flood risk 1/10 · Minimal
- FEMA flood zone
- X (unshaded)
- Chance of flooding over 30 yrs
- 0.0%
- Est. flood insurance / yr
- $473 – $860
Fire risk 3/10 · Minor
- Est. fire insurance / yr
- $755 – $1,403
Heat risk 9/10 · Severe
- Hot days now (above 104°F)
- 7 days/yr
- Hot days in 30 yrs
- 16 days/yr
Wind risk 6/10 · Moderate
- Chance of severe wind over 30 yrs
- 58.0%
Air-quality risk 3/10 · Minor
- Unhealthy air days now
- 3 days/yr
- Unhealthy air days in 30 yrs
- 4 days/yr
Risk factors via First Street. Map © Google.
Why this score? — see what drove the B- grade
The composite is a weighted blend of 9 inputs, each scored 0–100. Each bar is that input's sub-score; the figure is the points it added to the 100-point composite (weight × sub-score).
- Cash flow +25.6/30.0
- ARV discount +15.0/15.0
- DSCR +8.5/10.0
- 1% rule +5.8/10.0
- Livability +3.6/5.0
- Rent growth +2.5/5.0
- Condition / age +2.5/5.0
- Schools +2.3/10.0
- Appreciation +0.0/10.0
$279,000
🖨 Deal sheet 📄 Offer letter ✓ Due diligence
Listing remarks
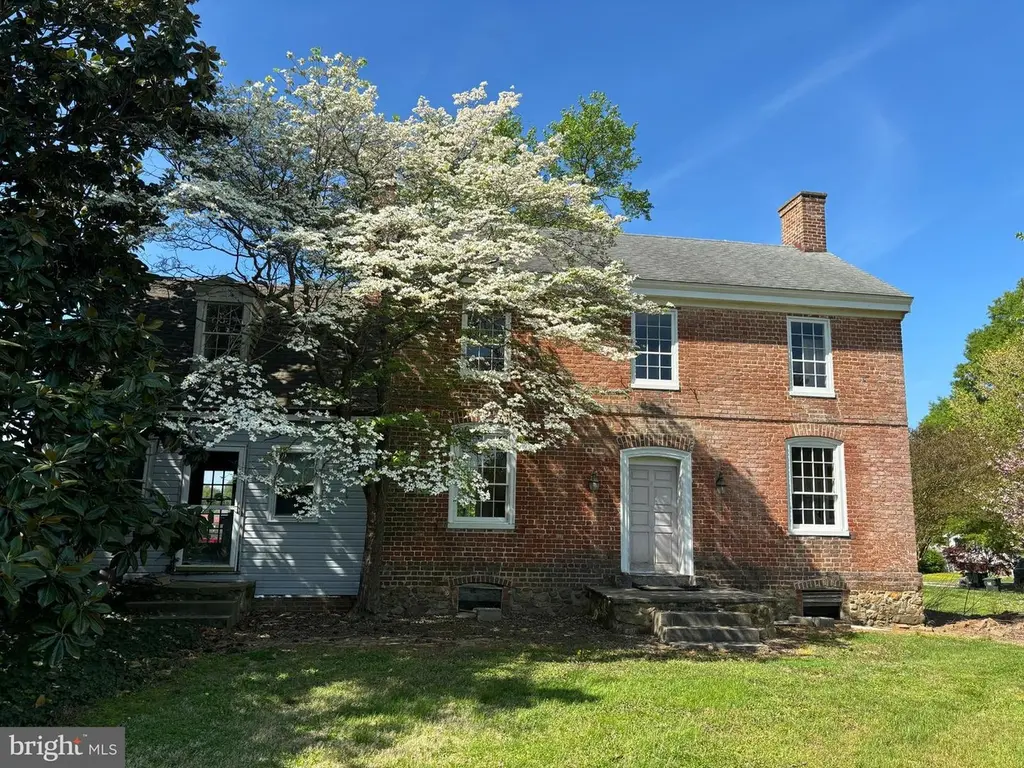
Important Georgian residence built in 1763 by Quaker Emanuel Jenkinson. House contains much original raised paneling, built-in cupboard, paneled doors, wide-board flooring etc. The house sits on a 1660s land-grant called "Edmondson's Freshes". Today the neighborhood is known as "Stoney Ridge" Seller has the brass front door lock and other useful 18th C, hardware. No restriction against moving the house to a waterfront building site . . . Listing agent is owner. The house was largely re-wired in the 1980s. In 2009 the windows were rebuilt using mahogany, with salvaged wavy glass, The roof is of unknown age, but is over eighteen years. Seller purchased the property in 20
Key facts
- Georgian residence
- Built-in cupboard
- Wide-board flooring
Tags
Property features AI
Finance
- HOA & community: Ground rent paid annually
Exterior
- Parking: Off-street parking; On-street parking
- Utilities: Public water; Public sewer
- Home design: Detached house; Located in city limits
- Construction: Brick construction; Stone foundation; Built (year estimated)
- Exterior features: Above grade and below grade structures
Interior
- Kitchen: Country-style kitchen
- Bedrooms: Three bedrooms on the upper level
- Flooring: Wood floors
- Bathrooms: One full bathroom; One half bathroom
- Heating & cooling: Radiator heat
- Interior features: Attic; Crown moldings; Formal separate dining room; Country-style kitchen; Wainscoting; Wood floors; Two fireplaces; Partial basement
- Laundry & utility: Laundry room
Neighborhood map
What this means for you Summary
Snapshot
- This is a 3-bed/1.5-bath single-family listed at $279k.
Deal economics
- At list price, monthly cash flow is $657 ($8k/yr) — positive.
- The deal already cash-flows at list — no discount required.
- Meets the 1% rule at list price ($3k rent vs $279k).
- Recommended offer: $271k (3.0% below list) — sets the bar for market timing.
- Cap rate 9.1% vs local median 3.8% in Easton — top-decile yield for the area; either an underpriced asset or a hidden risk that comps aren't pricing in. Stress-test before assuming the spread holds.
Location & tenants
- Location reads 71/100 on livability (#154 in MD) — a middle-class / working-renter tenant base. Strengths: health & safety A+, housing A-, employment B+; Watch: amenities C-, schools D, crime D.
- Talbot County Public Schools (town): math 15% / reading 35% proficiency, ranked #12 of 24 in MD (top 50%) — low school quality limits family demand, transient renter base, plan for 1-2y turnover.
- Market conditions: 207 active listings in the ZIP; 3 comparable units currently listed for rent nearby; rentals lingering (median 44d on market — plan ~5-8 weeks vacancy on turnover, expect pricing pressure); 100% of comp listings sitting > 30 days — soft ceiling on asking rent; solid renter incomes; 158 units permitted in Talbot County in 2024 (0 in 5+ unit buildings).
- This rent runs 43% of the median local income ($84k/yr) — at the standard rent-burdened threshold; future hikes will face affordability resistance.
Forward outlook
- Local home prices are declining (-3.0%/yr); year-one equity from $2k of loan paydown is wiped out by about $8k of value loss. Plan a longer hold.
- Talbot County population projected at -10% by 2050 — secular population decline; favor cash flow + early exit over multi-decade hold.
Negotiation context
- It's been on market 46 days — a 3% lower offer ($271k) is reasonable based on typical stale-listing flexibility.
- 2 sale attempts since 33y ago with the ask held roughly flat each time — persistent listings suggest the price (not the market) is what's stuck; bring a comps-based counter.
- Current owner paid $140k; list at $279k implies a 99% gain — meaningful room to come down on a strong offer.
Risks & watch-outs
- Watch-outs: built in 1763 — expect roof / HVAC / electrical / plumbing capex.
- Climate carrying-cost: major wind risk, 58% chance of damaging wind over 30y; extreme-heat days projected 7→16/yr by 2055 (HVAC capex compounding) — expect insurance premiums to compound above CPI over the hold.
Questions for the listing agent
- It's been on market 46 days. Have you received any prior offers? Is the seller open to a 3% concession, seller financing, or rate buy-down credit?
- Built in 1763 — when were the roof, HVAC, electrical panel, plumbing, and water heater last replaced?
- Is there a deadline driving the sale (1031 exchange, divorce, estate, relocation)? That informs how much negotiation room exists.
- Schools are D-rated, which usually means shorter tenancies and higher turnover. Who's the typical renter profile here, and what's been the actual vacancy rate?
- Crime grade is D in this area — have there been break-ins, vandalism, or insurance claims at this property in the last 3 years? What carrier currently insures it and at what premium?
- What's the average days-on-market for RENTAL listings here right now (not sales)? A rising rental-DOM trend means longer vacancies and softer asking-rent achievability than the comps imply.
- What's the recent tenant-quality profile in this submarket — average credit score on applications, eviction rate, late-payment / NSF rate, and stable-employment percentage? A property-management company in the area should have these aggregated.
- How much new for-sale + rental construction is in the pipeline within 1–3 miles? Heavy new supply typically softens prices + rents 12–24 months out; constrained supply supports both.
Investment metrics
- 1% rule
- 1.08% ✓
- Cap rate
- 9.12%
- Cash-on-cash
- 10.09%
- DSCR
- 1.45
- GRM
- 7.7
CMA / ARV
- ARV (median comp)
- $356,438
- List price
- $279,000
- Delta
- -21.73%
- Verdict
- UNDERPRICED
- Comps
- 20 within 1.0 mi
Show comp detail 12 sales within ~0.75 mi
| Address | Dist | Beds/Ba | Sqft | Sold | Price | $/sf | Match |
|---|---|---|---|---|---|---|---|
| 29580 Kent Ave | 0.36mi | 2/2.0 (-1) | 1,878 (+1%) | 1mo | $462,000 | $246 | 74 |
| 7144 Fir St | 0.40mi | 3/2.5 | 1,825 (-2%) | 4mo | $420,000 | $230 | 71 |
| 29411 Palm Ct | 0.44mi | 3/2.5 | 1,825 (-2%) | 2mo | $385,000 | $211 | 70 |
| 7390 Patrick Rd | 0.18mi | 3/2.0 | 1,668 (-10%) | 3mo | $359,999 | $216 | 70 |
| 29653 Lyons Dr | 0.46mi | 2/2.0 (-1) | 1,878 (+1%) | 3mo | $410,000 | $218 | 68 |
| 29184 Corbin Pkwy | 0.32mi | 3/2.5 | 2,066 (+11%) | 5mo | $430,000 | $208 | 59 |
| 29748 Hillary Ave | 0.65mi | 2/2.0 (-1) | 1,805 (-3%) | 0mo | $480,000 | $266 | 57 |
| 29179 Pin Oak Way | 0.67mi | 4/2.0 (+1) | 1,860 (0%) | 7mo | $417,500 | $224 | 56 |
| 29202 Holly Rd | 0.57mi | 3/2.0 | 2,018 (+8%) | 4mo | $393,000 | $195 | 54 |
| 29805 Dustin Ave | 0.73mi | 2/2.0 (-1) | 1,878 (+1%) | 5mo | $499,000 | $266 | 54 |
| 7477 Casey Ave | 0.74mi | 2/2.0 (-1) | 1,805 (-3%) | 1mo | $465,000 | $258 | 53 |
| 29285 Pin Oak Way | 0.68mi | 4/2.5 (+1) | 1,836 (-1%) | 8mo | $375,000 | $204 | 50 |
Match score weights: distance 35% · size 25% · config 20% · recency 20%. Top-matched comps best support the ARV.
Projected returns pro-forma
-3.0% appreciation · 3.0% rent growth · sell at horizon
- IRR
- -1.2%
- Equity multiple
- 0.96×
- Total profit
- $-3,445
- Equity at exit
- $41,600
- IRR
- 8.5%
- Equity multiple
- 1.65×
- Total profit
- $50,541
- Equity at exit
- $24,123
Cash invested: $78,120 (down + closing). Projections, not guarantees.
Landlord ↔ Tenant lean methodology
- Overall (STATE)
- 27 Tenant-Leaning
- State Maryland
- 27 Tenant-Leaning · D+14
- County
- — inherits STATE
- City
- — inherits STATE
ZIP-level market 21601
- Home prices YoY
- -31.0%
- Active inventory
- 207
- Price-to-rent
- 7.7×
Monthly cashflow live
- Estimated rent
- $3,002 medium interval (Pro) →
- Mortgage (P&I)
- −$1,463
- Tax from tax record
- −$135 /mo · $1,621/yr
- Insurance
- −$116
- HOA
- −$0
- Vacancy / Maint / Mgmt
- −$630
- Net cashflow
- $657
Break-even live
UW: 25.0% down · 7.5% · 30yr · 1.5% tax · 5.0% vac · 8.0% maint · 8.0% mgmt
Financing live
Cash to close
- Down payment
- $69,750
- Closing costs
- $8,370
- Reserves months
- —
- Total cash needed
- —
Loan-product check · same deal, 3 products live
Conventional
25% down · 7.5% · 30yr
- Down + closing
- —
- Monthly P&I
- —
- Monthly cashflow
- —
- DSCR
- —
- Eligible?
- —
Personal DTI + credit; lowest rate.
DSCR
20% down · 8.5% · 30yr
- Down + closing
- —
- Monthly P&I
- —
- Monthly cashflow
- —
- DSCR
- —
- Eligible?
- —
No personal income docs; deal must DSCR.
Hard money
10% down · 12.0% · 12mo
- Down + closing
- —
- Monthly P&I
- —
- Monthly cashflow
- —
- DSCR
- —
- Eligible?
- —
Short-term bridge; refi at stabilization.
Rent comps 3 comps
| Address | Beds | Baths | Sqft | Rent | $/sqft | DOM | Units | Dist |
|---|---|---|---|---|---|---|---|---|
| 29181 Pin Oak Way Easton, MD | 3.0 | 2.0 | 1358 | $2,600 | $1.91 | 43d | 1 | 0.71mi |
| 532 Trippe Ave Easton, MD | 3.0 | 2.0 | 1995 | $3,900 | $1.95 | 43d | 1 | 1.19mi |
| 126 Tred Avon Ave Unit NA Easton, MD | 4.0 | 2.0 | 1514 | $3,000 | $1.98 | 43d | 1 | 1.42mi |
Listing history 21 events
-
2026-06-19days on market $279,000 Active 46 DOM
-
2026-06-18days on market $279,000 Active 45 DOM
-
2026-06-17days on market $279,000 Active 44 DOM
-
2026-06-16days on market $279,000 Active 43 DOM
-
2026-06-15days on market $279,000 Active 42 DOM
-
2026-06-14days on market $279,000 Active 40 DOM
-
2026-06-12days on market $279,000 Active 39 DOM
-
2026-06-09days on market $279,000 Active 36 DOM
-
2026-06-08days on market $279,000 Active 35 DOM
-
2026-06-07days on market $279,000 Active 34 DOM
-
2026-06-03days on market $279,000 Active 30 DOM
-
2026-06-02days on market $279,000 Active 29 DOM
-
2026-06-01days on market $279,000 Active 28 DOM
-
2026-05-31days on market $279,000 Active 27 DOM
-
2026-05-30days on market $279,000 Active 26 DOM
-
2026-05-04$279,000 Active 1698-char remark
-
2008-01-28soldstatus $140,000
-
2007-10-14soldstatus $160,197
-
1997-01-01historical
-
1993-12-06
-
1989-11-17soldstatus $43,000
ⓘ Source: listings_history table (triggers on properties + properties_extension) + one-shot
backfill from property_details.listing_events for pre-trigger history.
Tax reassessment forecast MD · Partial reset (capped growth)
- Current annual tax
- $1,621 · $135/mo
- Projected year-2 tax
- $2,331 · $194/mo
- Expected delta
- +$710/yr (+$59/mo · 43.8%)
ⓘ Screening estimate from a state-policy table — verify with the county assessor before closing.
Climate risk First Street
- Flood 1/10 Low FEMA zone X (unshaded) · 0% chance over 30 yrs
- Wildfire 3/10 Moderate
- Heat 9/10 Extreme 7 d/yr ≥104°F today · 16 d/yr by 30 yrs out
- Wind 6/10 Major 58% chance of damaging wind over 30 yrs
- Air quality 3/10 Moderate 3 unhealthy d/yr today · 4 by 30 yrs out
Nearby sold comps map
Loading sold comps map…
Walkable amenities ~0.75 mi
Loading nearby amenities…
Taxation est. · year 1
- Rental income
- $36,023
- − Mortgage interest
- −$15,628
- − Property taxes
- −$1,621
- − Insurance
- −$1,395
- − Repairs & maintenance
- −$2,882
- − Management
- −$2,882
- − Depreciation
- −$8,116
- Taxable income
- $3,499
- Est. tax owed @ 24.0%
- −$840
- After-tax cash flow
- $7,045/yr
For passive investors: Depreciation is non-cash, so a rental often shows a tax loss while cash-flowing — sheltering income. Rental losses are passive: they offset passive income freely, and up to $25,000/yr can offset ordinary (W-2) income if you actively participate and your MAGI is under $100k (phasing out to $0 by $150k); unused losses carry forward. On sale, claimed depreciation is recaptured at up to 25%, and gains may owe capital-gains tax (a 1031 exchange can defer both). Figures are a year-1 estimate at your 24.0% rate — not tax advice; consult a CPA.
Schools (NCES district)
- District
- Talbot County Public Schools
- NCES district ID
- 2400630
- Math proficiency
- 15% ▼ -19.00%
- Reading proficiency
- 35% ▼ -10.00%
- Median HH income
- $61,786
- Composite
- 23.11/100
- National rank
- #7961
- State rank
- #12 of 24 in MD
Livability — Easton
- Score
- 71/100
- State rank
- #154
- US rank
- #6882
Category grades
Schools grade is shown separately in the Schools card above.
Census & demographics
- Census place
- Easton, MD
- County
- Talbot County · 24,671 people
- City population
- 24,671
- Metro
- Easton, MD
- Population (ZIP)
- 24,671
- Household income
- $83,680
- Rent vs Own
- Severe rent burden
- 771.0
Population outlook (Talbot County) Hauer SSP2
- Today (2025)
- 36,811 people
- By 2030
- 36,305 · -1.4%
- By 2040
- 34,818 · -5.4%
- By 2050
- 32,982 · -10.4%
- By 2075
- 29,631 · -19.5%
- By 2100
- 25,767 · -30.0%
Race, ethnicity, and origin ACS 2023
- Neighborhood character
- Predominantly White (71%)
- Race & ethnicity
- White 71% Black 14% Hispanic / Latino 10% Two or more races 6% Asian 1%
- Hispanic origin (detail)
- Mexican 2%
- Common ancestry
- Lithuanian 4% Romanian 3% Slovak 2%
- Foreign-born
- 9% · Canada, Guatemala
- Languages at home
- 89% English-only · Spanish 8% Other Indo-European 2%
Political lean MEDSL · Talbot
- 2024 margin
- Toss-up / Even · D 49.0% · R 49.1% · Other 1.9%
- 2008→2024 swing
- +9.6pp toward D · 2008: -9.6pp · 2024: -0.0pp
- All cycles
- 2024: R+0.0 2020: D+0.5 2016: R+11.9 2012: R+13.2 2008: R+9.6
Not yet ingested
- Civics
- —
Market trends
- HPI YoY
- ▼ -103.01%
- Current HPI
- 229.2902
- Rent YoY
- —
- Metro
- Easton, MD
- State GDP YoY
- ▲ 2.97%
- F500 in state
- 12
Industry mix (Fortune 500 HQ in MD)
| Industry | F500 HQs | Revenue |
|---|---|---|
| Aerospace / Defense | 1 | $71B |
|
||
| Utilities | 1 | $25B |
|
||
| Hotels | 1 | $24B |
|
||
| Consumer Goods | 1 | $7B |
|
||
| Real Estate | 1 | $6B |
|
||
| Chemicals | 1 | $2B |
|
||
Price history
+548.8% since first listed6 events — show timeline
- 2026-05-04 Listed $279,000 BRIGHT MLS
- 2008-01-28 Sold (Public Records) $140,000 Public Records
- 2007-10-14 Sold (Public Records) $160,197 Public Records
- 1997-01-01 Delisted — MRIS
- 1993-12-06 Listed — MRIS
- 1989-11-17 Sold (Public Records) $43,000 Public Records
Property tax history
-0.8%/yrLatest (2025): $1,621 · +7.1% YoY. Source: county tax records.
Cash-flow waterfall
monthlySold comps — $/sqft
last 12 mo · ≤1 miLoading sold comps…