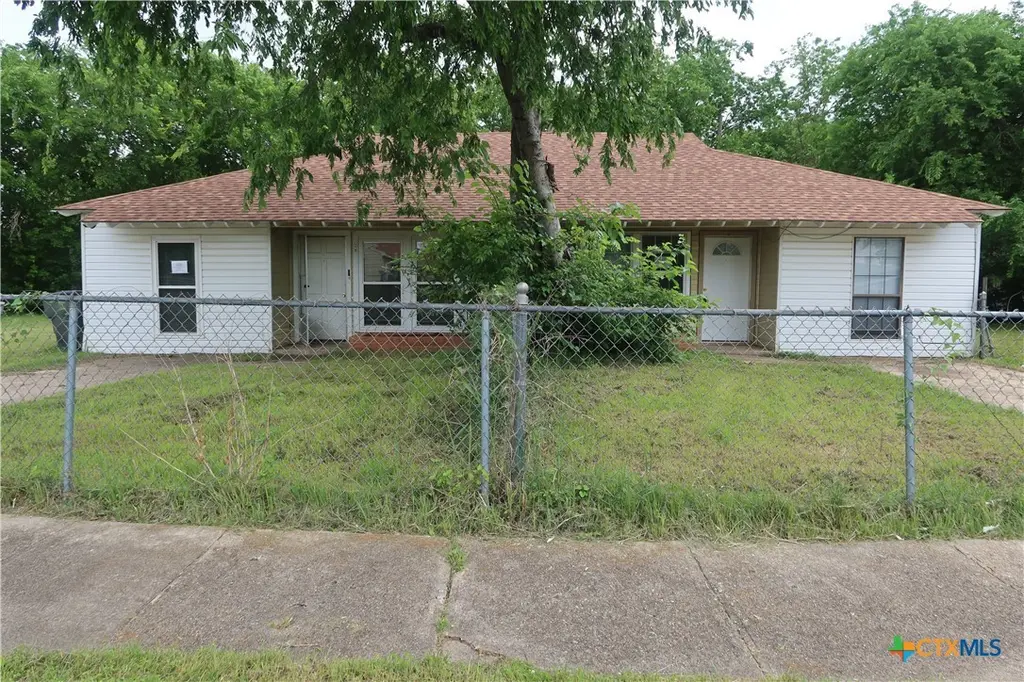
1806 Fairview Dr · Killeen, TX
Flood risk 1/10 · Minimal
- FEMA flood zone
- X (unshaded)
- Chance of flooding over 30 yrs
- 0.0%
- Est. flood insurance / yr
- $507 – $1,088
Fire risk 4/10 · Minor
- Est. fire insurance / yr
- $1,222 – $2,270
Heat risk 7/10 · Major
- Hot days now (above 107°F)
- 7 days/yr
- Hot days in 30 yrs
- 24 days/yr
Wind risk 6/10 · Moderate
- Chance of severe wind over 30 yrs
- 56.0%
Air-quality risk 1/10 · Minimal
- Unhealthy air days now
- 0 days/yr
- Unhealthy air days in 30 yrs
- 0 days/yr
Risk factors via First Street. Map © Google.
Why this score? — see what drove the D grade
The composite is a weighted blend of 9 inputs, each scored 0–100. Each bar is that input's sub-score; the figure is the points it added to the 100-point composite (weight × sub-score).
- ARV discount +15.0/15.0
- Cash flow +7.3/30.0
- Appreciation +6.1/10.0
- Livability +3.2/5.0
- 1% rule +3.0/10.0
- Schools +3.0/10.0
- Condition / age +2.5/5.0
- Rent growth +2.0/5.0
- DSCR +1.5/10.0
$140,000
🖨 Deal sheet (PDF) 📄 Offer letter ✓ Due diligence
Listing remarks
Excellent investment opportunity! Duplex that features 2 bedrooms, 1 full bath, 1 living room and dining area in each unit. Both units are vacant. Call to schedule an appointment today!
Key facts
- Built 1958
- Listed 45 days
Property features AI
Exterior
- Parking: Driveway parking for each unit
- Utilities: Electricity available; Natural gas available; Public trash collection; Public water (not connected at lot); Public sewer (not connected at lot)
- Home design: Single-story building; HardiPlank exterior
- Construction: Built (year from assessor); Composition/shingle roof; HardiPlank type siding
- Exterior features: Chain link fencing; City lot; quarter- to half-acre lot; Asphalt road access
Interior
- Kitchen: Microwave; Range
- Bedrooms: Two 2-bedroom units (each unit has 2 bedrooms)
- Flooring: Carpet; Laminate
- Bathrooms: Each unit has 1 bathroom
- Heating & cooling: Central air (two units)
- Interior features: Carpet and laminate flooring
- Laundry & utility: Washer hookup in unit
Neighborhood map
What this means for you Summary
Snapshot
- This is a 4-bed/2.0-bath townhouse listed at $140k.
Deal economics
- At list price, monthly cash flow is $-185 ($-2k/yr) — negative.
- To cash-flow at today's rent, offer at most $107k (23.3% below list).
- To meet the 1% rule (rent ≥ 1% of price), the offer needs to be $111k (20.4% below list).
- Recommended offer: $107k (23.3% below list) — sets the bar for cash-flow.
- Cap rate 4.7% vs local median 3.9% in Killeen — meaningfully above typical; check what's discounted (condition, days-on-market, listing class) to confirm the premium yield is real.
Location & tenants
- Location reads 63/100 on livability (#853 in TX) — a middle-class / working-renter tenant base. Strengths: cost of living A+, housing A+; Watch: amenities D, employment D, crime D-.
- Killeen ISD (urban): math 31% / reading 38% proficiency, ranked #524 of 826 in TX (top 63%) — families likely to look elsewhere, expect single-tenant / working-renter base with shorter leases.
- Zoned schools: Killeen H S (math 29% / reading 40%, grade F, #963 of 1,632 statewide, top 61%, 2,076 students, 69% FRL) — zoned schools average 69% FRL vs 47% district-wide (22 pts higher); higher-poverty schools than district average — tighter screening recommended.
- Market conditions: Rents soft (-2.0%/yr); 126 active listings in the ZIP; 14 comparable units currently listed for rent nearby; rentals lingering (median 47d on market — plan ~5-8 weeks vacancy on turnover, expect pricing pressure); 79% of comp listings sitting > 30 days — soft ceiling on asking rent; lower-income renter base — watch delinquency; 3,222 units permitted in Bell County in 2024 (246 in 5+ unit buildings).
- This rent runs 36% of the median local income ($37k/yr) — at the standard rent-burdened threshold; future hikes will face affordability resistance.
Forward outlook
- In year one you build about $4k of equity ($968 loan paydown + $3k appreciation (2.3% local appreciation)).
- Bell County population projected at +21% by 2050 — long-run rental-demand tailwind backs the buy-and-hold thesis.
- By year 8, paydown + projected appreciation supports a ~$31k cash-out refi (75% LTV) — recoverable capital for the next deal without selling this one.
Negotiation context
- It's been on market 45 days — a 3% lower offer ($136k) is reasonable based on typical stale-listing flexibility.
- 2 sale attempts with the ask held roughly flat each time — persistent listings suggest the price (not the market) is what's stuck; bring a comps-based counter.
Risks & watch-outs
- Watch-outs: built in 1958 — expect roof / HVAC / electrical / plumbing capex.
- Climate carrying-cost: major wind risk, 56% chance of damaging wind over 30y; extreme-heat days projected 7→24/yr by 2055 (HVAC capex compounding) — expect insurance premiums to compound above CPI over the hold.
Questions for the listing agent
- What do current leases actually rent for vs. the listed asking? Can we see a recent rent roll and the last 12 months of T-12 income?
- It's been on market 45 days. Have you received any prior offers? Is the seller open to a 23% concession, seller financing, or rate buy-down credit?
- Built in 1958 — when were the roof, HVAC, electrical panel, plumbing, and water heater last replaced?
- Is there a deadline driving the sale (1031 exchange, divorce, estate, relocation)? That informs how much negotiation room exists.
- Schools are D-rated, which usually means shorter tenancies and higher turnover. Who's the typical renter profile here, and what's been the actual vacancy rate?
- Crime grade is D in this area — have there been break-ins, vandalism, or insurance claims at this property in the last 3 years? What carrier currently insures it and at what premium?
- The area grade is low — what's the realistic commute time and amenity access for the typical tenant pool here? Any planned neighborhood developments (good or bad) we should know about?
- What's the average days-on-market for RENTAL listings here right now (not sales)? A rising rental-DOM trend means longer vacancies and softer asking-rent achievability than the comps imply.
- What's the recent tenant-quality profile in this submarket — average credit score on applications, eviction rate, late-payment / NSF rate, and stable-employment percentage? A property-management company in the area should have these aggregated.
- How much new for-sale + rental construction is in the pipeline within 1–3 miles? Heavy new supply typically softens prices + rents 12–24 months out; constrained supply supports both.
Investment metrics
- 1% rule
- 0.80% ✗
- Cap rate
- 4.71%
- Cash-on-cash
- -5.66%
- DSCR
- 0.75
- GRM
- 10.5
CMA / ARV
- ARV (median comp)
- $178,700
- List price
- $140,000
- Delta
- -21.66%
- Verdict
- UNDERPRICED
- Comps
- 2 within 2.0 mi
Show comp detail 1 sale within ~0.75 mi
| Address | Dist | Beds/Ba | Sqft | Sold | Price | $/sf | Match |
|---|---|---|---|---|---|---|---|
| 1008 York Ave | 0.63mi | 4/3.0 | 1,970 (-1%) | 5mo | $274,900 | $140 | 60 |
Match score weights: distance 35% · size 25% · config 20% · recency 20%. Top-matched comps best support the ARV.
Projected returns pro-forma
2.26% appreciation · 0.0% rent growth · sell at horizon
- IRR
- -1.6%
- Equity multiple
- 0.91×
- Total profit
- $-3,500
- Equity at exit
- $57,210
- IRR
- 1.4%
- Equity multiple
- 1.19×
- Total profit
- $7,259
- Equity at exit
- $83,940
Cash invested: $39,200 (down + closing). Projections, not guarantees.
Landlord ↔ Tenant lean methodology
- Overall (STATE)
- 87 Strongly Landlord-Friendly
- State Texas
- 87 Strongly Landlord-Friendly · R+5
- County
- — inherits STATE
- City
- — inherits STATE
ZIP-level market 76541
- Home prices YoY
- 1.4%
- Rents YoY
- -2.0%
- Active inventory
- 126
- Price-to-rent
- 10.5×
Monthly cashflow live
- Estimated rent
- $1,114 high interval (Pro) →
- Mortgage (P&I)
- −$734
- Tax from tax record
- −$273 /mo · $3,273/yr
- Insurance
- −$58
- HOA
- −$0
- Lot rent
- −$0
- Vacancy / Maint / Mgmt
- −$234
- Net cashflow
- $-185
Break-even live
Sensitivity live
| Price | -10% $-106 | -5% $-145 | +0% $-185 | +5% $-225 | +10% $-264 |
|---|---|---|---|---|---|
| Rent | -10% $-273 | -5% $-229 | +0% $-185 | +5% $-141 | +10% $-97 |
| Rate | -1.0pp $-114 | -0.5pp $-149 | base $-185 | +0.5pp $-221 | +1.0pp $-258 |
UW: 25.0% down · 7.5% · 30yr · 1.5% tax · 5.0% vac · 8.0% maint · 8.0% mgmt
Financing live
Cash to close
- Down payment
- $35,000
- Closing costs
- $4,200
- Reserves months
- —
- Total cash needed
- —
Loan-product check · same deal, 3 products live
Conventional
25% down · 7.5% · 30yr
- Down + closing
- —
- Monthly P&I
- —
- Monthly cashflow
- —
- DSCR
- —
- Eligible?
- —
Personal DTI + credit; lowest rate.
DSCR
20% down · 8.5% · 30yr
- Down + closing
- —
- Monthly P&I
- —
- Monthly cashflow
- —
- DSCR
- —
- Eligible?
- —
No personal income docs; deal must DSCR.
Hard money
10% down · 12.0% · 12mo
- Down + closing
- —
- Monthly P&I
- —
- Monthly cashflow
- —
- DSCR
- —
- Eligible?
- —
Short-term bridge; refi at stabilization.
Rent comps 14 comps
| Address | Beds | Baths | Sqft | Rent | $/sqft | DOM | Units | Dist |
|---|---|---|---|---|---|---|---|---|
| 1717 Walton Walker Dr Unit 1717 Killeen, TX | 3.0 | 1.5 | 1300 | $895 | $0.69 | 46d | 1 | 0.08mi |
| 805 W Kern Rd Unit 807 Killeen, TX | 3.0 | 1.0 | 1692 | $775 | $0.46 | 46d | 1 | 0.19mi |
| 1111 N College St Unit B Killeen, TX | 3.0 | 2.0 | 1235 | $995 | $0.81 | 16d | 1 | 0.54mi |
| 811 York Ave Unit A Killeen, TX | 3.0 | 2.0 | 2304 | $1,125 | $0.49 | 46d | 1 | 0.63mi |
| 1200 N 8th St Apt A Killeen, TX | 3.0 | 2.0 | 2420 | $1,500 | $0.62 | 47d | 1 | 0.84mi |
| 302 Washington St Killeen, TX | 3.0 | 2.0 | 2075 | $1,495 | $0.72 | 46d | 1 | 0.89mi |
| 1309 Carol Way Killeen, TX | 4.0 | 2.5 | 1600 | $1,350 | $0.84 | 46d | 1 | 1.23mi |
| 905 Parmer Ave Unit A Killeen, TX | 3.0 | 1.0 | 1672 | $750 | $0.45 | 46d | 1 | 1.24mi |
| 501 N 18th St Unit B Killeen, TX | 3.0 | 1.5 | 1286 | $1,250 | $0.97 | 26d | 1 | 1.25mi |
| 512 Raymond St Killeen, TX | 3.0 | 2.5 | 1336 | $1,300 | $0.97 | 46d | 1 | 1.35mi |
| 512 Raymond St Unit B Killeen, TX | 3.0 | 2.5 | 1336 | $1,300 | $0.97 | 26d | 1 | 1.36mi |
| 605 Stringer St Unit A Killeen, TX | 3.0 | 2.5 | 1334 | $1,500 | $1.12 | 46d | 1 | 1.38mi |
| 1208 Alexander St Killeen, TX | 4.0 | 3.0 | 1500 | $1,600 | $1.07 | 46d | 1 | 1.39mi |
| 1201 Greenwood Ave Killeen, TX | 4.0 | 2.0 | 1276 | $1,350 | $1.06 | 46d | 1 | 1.45mi |
Listing history 26 events
-
2026-06-23days on market $140,000 Active 45 DOM
-
2026-06-22days on market $140,000 Active 44 DOM
-
2026-06-19status $140,000 Active 41 DOM
-
2026-06-18days on market $140,000 Active Under Contract 41 DOM
-
2026-06-17days on market $140,000 Active Under Contract 40 DOM
-
2026-06-16days on market $140,000 Active Under Contract 39 DOM
-
2026-06-15days on market $140,000 Active Under Contract 38 DOM
-
2026-06-14days on market $140,000 Active Under Contract 36 DOM
-
2026-06-13days on market $140,000 Active Under Contract 35 DOM
-
2026-06-10days on market $140,000 Active Under Contract 33 DOM
-
2026-06-09days on market $140,000 Active Under Contract 32 DOM
-
2026-06-09status $140,000 Active Under Contract 31 DOM
-
2026-06-08days on market $140,000 Active 31 DOM
-
2026-06-07days on market $140,000 Active 30 DOM
-
2026-06-03days on market $140,000 Active 26 DOM
-
2026-06-02days on market $140,000 Active 25 DOM
-
2026-06-01days on market $140,000 Active 24 DOM
-
2026-05-31days on market $140,000 Active 23 DOM
-
2026-05-30days on market $140,000 Active 22 DOM
-
2026-05-08$140,000 Active 185-char remark
-
2025-04-18historical $950
-
2025-01-23price $950
-
2025-01-16$1,200
-
2023-07-14soldstatus
-
2013-07-01soldstatus
-
1991-04-16soldstatus
ⓘ Source: listings_history table (triggers on properties + properties_extension) + one-shot
backfill from property_details.listing_events for pre-trigger history.
Tax reassessment forecast TX · Resets to sale price
- Current annual tax
- $3,273 · $273/mo
- Projected year-2 tax
- $3,273 · $273/mo
- Expected delta
- $0/yr ($0/mo · 0.0%)
ⓘ Screening estimate from a state-policy table — verify with the county assessor before closing.
Climate risk First Street
- Flood 1/10 Low FEMA zone X (unshaded) · 0% chance over 30 yrs
- Wildfire 4/10 Moderate
- Heat 7/10 Severe 7 d/yr ≥107°F today · 24 d/yr by 30 yrs out
- Wind 6/10 Major 56% chance of damaging wind over 30 yrs
- Air quality 1/10 Low 0 unhealthy d/yr today · 0 by 30 yrs out
Nearby sold comps map
Loading sold comps map…
Walkable amenities ~0.75 mi
Loading nearby amenities…
Taxation est. · year 1
- Rental income
- $13,371
- − Mortgage interest
- −$7,842
- − Property taxes
- −$3,273
- − Insurance
- −$700
- − Repairs & maintenance
- −$1,070
- − Management
- −$1,070
- − Depreciation
- −$4,073
- Taxable loss
- −$4,656
- Est. tax savings @ 24.0%
- +$1,117
- After-tax cash flow
- $-1,102/yr
For passive investors: Depreciation is non-cash, so a rental often shows a tax loss while cash-flowing — sheltering income. Rental losses are passive: they offset passive income freely, and up to $25,000/yr can offset ordinary (W-2) income if you actively participate and your MAGI is under $100k (phasing out to $0 by $150k); unused losses carry forward. On sale, claimed depreciation is recaptured at up to 25%, and gains may owe capital-gains tax (a 1031 exchange can defer both). Figures are a year-1 estimate at your 24.0% rate — not tax advice; consult a CPA.
Schools (NCES district)
- District
- Killeen ISD
- NCES district ID
- 4825660
- Math proficiency
- 31% ▼ -16.00%
- Reading proficiency
- 38% ▼ -3.00%
- Median HH income
- $47,665
- Composite
- 29.69/100
- National rank
- #6458
- State rank
- #524 of 826 in TX
Livability — Killeen
- Score
- 63/100
- State rank
- #853
- US rank
- #15359
Category grades
Schools grade is shown separately in the Schools card above.
Census & demographics
- Census place
- Killeen, TX
- County
- Bell County · 345,090 people
- City population
- 163,398
- Metro
- Killeen-Temple, TX
- Population (ZIP)
- 19,011
- Household income
- $37,349
- Rent vs Own
- Severe rent burden
- 1668.0
Population outlook (Bell County) Hauer SSP2
- Today (2025)
- 371,114 people
- By 2030
- 389,104 · +4.8%
- By 2040
- 420,592 · +13.3%
- By 2050
- 447,779 · +20.7%
- By 2075
- 499,130 · +34.5%
- By 2100
- 505,680 · +36.3%
Race, ethnicity, and origin ACS 2023
- Neighborhood character
- Highly diverse neighborhood (Simpson 0.73)
- Race & ethnicity
- Hispanic / Latino 32% White 31% Black 27% Two or more races 10% Asian 3% Pacific Islander 1%
- Hispanic origin (detail)
- Mexican 21% Puerto Rican 6% Dominican 1%
- Common ancestry
- Italian 2% Slovak 1% Lithuanian 1%
- Foreign-born
- 14% · Canada, Vietnam, South Korea
- Languages at home
- 69% English-only · Spanish 25% German/W. Germanic 2% Korean 1%
Political lean MEDSL · Bell
- 2024 margin
- R (+16.2) · D 41.3% · R 57.6% · Other 1.1%
- 2008→2024 swing
- -6.5pp toward R · 2008: -9.8pp · 2024: -16.2pp
- All cycles
- 2024: R+16.2 2020: R+8.5 2016: R+15.1 2012: R+16.4 2008: R+9.8
Not yet ingested
- Civics
- —
Market trends
- HPI YoY
- ▲ 2.26%
- Current HPI
- 168.1206
- Rent YoY
- ▼ -2.00%
- Metro
- Killeen-Temple, TX
- State GDP YoY
- ▲ 3.95%
- F500 in state
- 110
Industry mix (Fortune 500 HQ in TX)
| Industry | F500 HQs | Revenue |
|---|---|---|
| Energy | 16 | $1,198B |
|
||
| Technology | 5 | $198B |
|
||
| Engineering / Construction | 4 | $72B |
|
||
| Energy Services | 3 | $60B |
|
||
| Utilities | 3 | $41B |
|
||
| Healthcare | 2 | $330B |
|
||
Price history
+11566.7% since first listed8 events — show timeline
- 2026-06-08 Contingent — CTXMLS
- 2026-05-08 Listed $140,000 CTXMLS
- 2025-04-18 Rental Removed $950 APPFOLIO
- 2025-01-23 Price Changed $950 APPFOLIO
- 2025-01-16 Listed for Rent $1,200 APPFOLIO
- 2023-07-14 Sold (Public Records) — Public Records
- 2013-07-01 Sold (Public Records) — Public Records
- 1991-04-16 Sold (Public Records) — Public Records
Property tax history
+16.3%/yrLatest (2026): $3,273 · +4.9% YoY. Source: county tax records.
Cash-flow waterfall
monthlySold comps — $/sqft
last 12 mo · ≤1 miLoading sold comps…