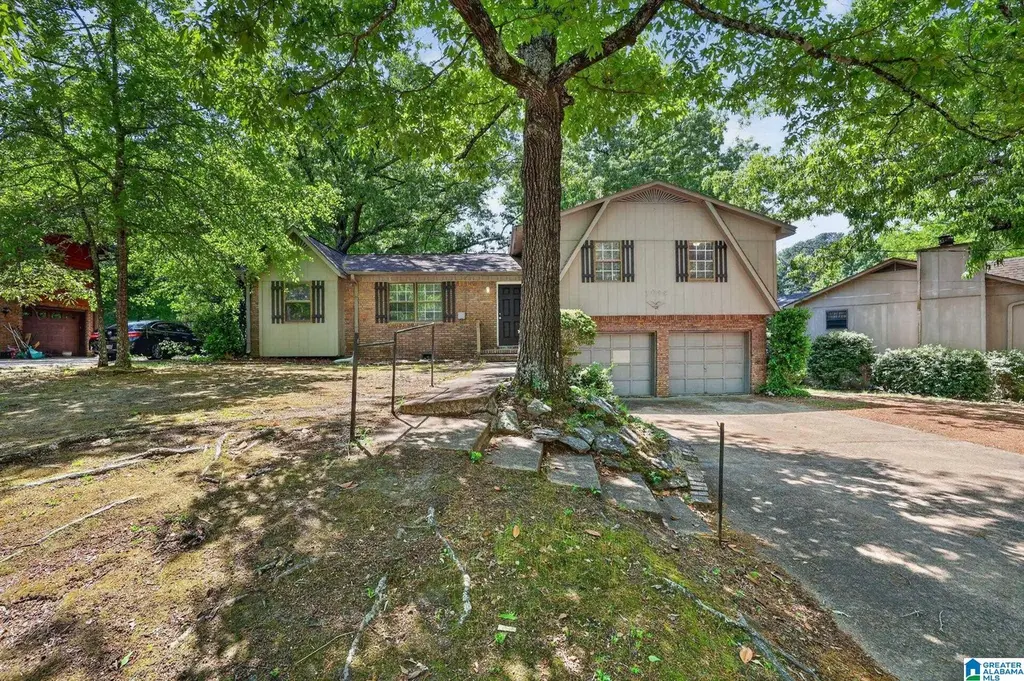
3044 Carleton Rd · Birmingham, AL
Flood risk 1/10 · Minimal
- FEMA flood zone
- X (unshaded)
- Chance of flooding over 30 yrs
- 0.0%
- Est. flood insurance / yr
- $473 – $860
Fire risk 3/10 · Minor
- Est. fire insurance / yr
- $916 – $1,700
Heat risk 6/10 · Moderate
- Hot days now (above 106°F)
- 7 days/yr
- Hot days in 30 yrs
- 19 days/yr
Wind risk 6/10 · Moderate
- Chance of severe wind over 30 yrs
- 27.0%
Air-quality risk 5/10 · Moderate
- Unhealthy air days now
- 6 days/yr
- Unhealthy air days in 30 yrs
- 11 days/yr
Risk factors via First Street. Map © Google.
Why this score? — see what drove the C- grade
The composite is a weighted blend of 9 inputs, each scored 0–100. Each bar is that input's sub-score; the figure is the points it added to the 100-point composite (weight × sub-score).
- Cash flow +18.7/30.0
- ARV discount +15.0/15.0
- DSCR +5.9/10.0
- 1% rule +4.9/10.0
- Livability +3.4/5.0
- Rent growth +3.3/5.0
- Condition / age +2.5/5.0
- Schools +0.9/10.0
- Appreciation +0.0/10.0
$139,900
🖨 Deal sheet 📄 Offer letter ✓ Due diligence
Listing remarks MLS
Welcome to this charming split-level home in Birmingham offering 3 bedrooms and 2 full baths. This well-designed layout provides comfortable living with spacious rooms and great natural light throughout. The main level features an inviting living area, while the lower level offers additional flexible space perfect for a family room, office, or entertaining. The kitchen provides ample cabinetry and flows nicely into the dining area. Enjoy a generous yard ideal for outdoor activities, along with convenient access to local shopping, dining, and major roadways. A great opportunity to make this home your own!
Key facts
- Flexible space
- Inviting living area
- Generous yard
Tags
Neighborhood map
What this means for you Summary
Snapshot
- This is a 3-bed/2.0-bath single-family listed at $140k.
Deal economics
- At list price, monthly cash flow is $138 ($2k/yr) — positive.
- The deal already cash-flows at list — no discount required.
- To meet the 1% rule (rent ≥ 1% of price), the offer needs to be $139k (0.7% below list).
- Recommended offer: $136k (3.0% below list) — sets the bar for market timing.
Location & tenants
- Location reads 67/100 on livability (#78 in AL) — a middle-class / working-renter tenant base. Strengths: commute A+, cost of living A+, housing A+; Watch: amenities C-, schools F, crime F.
- Birmingham City (urban): math 4% / reading 20% proficiency, ranked #116 of 129 in AL (top 90%) — low school quality limits family demand, transient renter base, plan for 1-2y turnover; 82% free/reduced lunch — lower-income household profile, screen leases tightly.
- Market conditions: Rents rising (+3.0%/yr); 334 active listings in the ZIP; 21 comparable units currently listed for rent nearby; rentals at typical pace (median 24d on market — plan ~3-4 weeks tenant-placement turnaround); 43% of comp listings sitting > 30 days — soft ceiling on asking rent; 2,114 units permitted in Jefferson County in 2024 (556 in 5+ unit buildings).
- This rent runs 32% of the median local income ($53k/yr) — at the standard rent-burdened threshold; future hikes will face affordability resistance.
Forward outlook
- Local home prices are declining (-3.0%/yr); year-one equity from $967 of loan paydown is wiped out by about $4k of value loss. Plan a longer hold.
- Jefferson County population projected to shrink 4% by 2050 — rents likely to lag national; underwrite the cash flow, not the appreciation.
Negotiation context
- It's been on market 34 days — a 3% lower offer ($136k) is reasonable based on typical stale-listing flexibility.
- 2 sale attempts since 5y ago with the ask held roughly flat each time — persistent listings suggest the price (not the market) is what's stuck; bring a comps-based counter.
Risks & watch-outs
- Climate carrying-cost: major wind risk, 27% chance of damaging wind over 30y; extreme-heat days projected 7→19/yr by 2055 (HVAC capex compounding) — expect insurance premiums to compound above CPI over the hold.
Questions for the listing agent
- It's been on market 34 days. Have you received any prior offers? Is the seller open to a 3% concession, seller financing, or rate buy-down credit?
- Built in 1975 — when were the roof, HVAC, electrical panel, plumbing, and water heater last replaced?
- Is there a deadline driving the sale (1031 exchange, divorce, estate, relocation)? That informs how much negotiation room exists.
- Schools are F-rated, which usually means shorter tenancies and higher turnover. Who's the typical renter profile here, and what's been the actual vacancy rate?
- Crime grade is F in this area — have there been break-ins, vandalism, or insurance claims at this property in the last 3 years? What carrier currently insures it and at what premium?
- What's the average days-on-market for RENTAL listings here right now (not sales)? A rising rental-DOM trend means longer vacancies and softer asking-rent achievability than the comps imply.
- What's the recent tenant-quality profile in this submarket — average credit score on applications, eviction rate, late-payment / NSF rate, and stable-employment percentage? A property-management company in the area should have these aggregated.
- How much new for-sale + rental construction is in the pipeline within 1–3 miles? Heavy new supply typically softens prices + rents 12–24 months out; constrained supply supports both.
Investment metrics
- 1% rule
- 0.99% ✗
- Cap rate
- 7.48%
- Cash-on-cash
- 4.23%
- DSCR
- 1.19
- GRM
- 8.4
CMA / ARV
- ARV (median comp)
- $172,261
- List price
- $139,900
- Delta
- -18.79%
- Verdict
- UNDERPRICED
- Comps
- 20 within 1.0 mi
Show comp detail 12 sales within ~0.75 mi
| Address | Dist | Beds/Ba | Sqft | Sold | Price | $/sf | Match |
|---|---|---|---|---|---|---|---|
| 508 26th Ave NW | 0.60mi | 3/2.0 | 1,383 (+1%) | 2mo | $197,600 | $143 | 69 |
| 308 Westchester Dr | 0.24mi | 3/2.0 | 1,458 (+6%) | 18mo | $165,000 | $113 | 64 |
| 227 27th Court Cir NW | 0.56mi | 3/2.0 | 1,338 (-2%) | 8mo | $60,000 | $45 | 63 |
| 2813 4th Pl NW | 0.29mi | 4/2.5 (+1) | 1,530 (+11%) | 4mo | $220,000 | $144 | 57 |
| 208 Glenvalley Ln NW | 0.43mi | 4/2.0 (+1) | 1,306 (-5%) | 12mo | $162,000 | $124 | 57 |
| 440 27th Ave NW | 0.50mi | 3/2.0 | 1,280 (-7%) | 10mo | $172,000 | $134 | 57 |
| 2620 2nd Way NW | 0.60mi | 4/2.0 (+1) | 1,451 (+6%) | 1mo | $220,000 | $152 | 57 |
| 3062 Apple Valley Ln | 0.36mi | 3/2.0 | 1,266 (-8%) | 17mo | $120,000 | $95 | 56 |
| 517 Sunhill Rd NW | 0.72mi | 3/1.0 | 1,340 (-2%) | 7mo | $120,000 | $90 | 53 |
| 428 27th Ave NW | 0.48mi | 3/1.5 | 1,456 (+6%) | 17mo | $134,000 | $92 | 51 |
| 320 27th Ave NW | 0.51mi | 3/2.0 | 1,540 (+12%) | 19mo | $138,000 | $90 | 40 |
| 2513 5th St NW | 0.63mi | 3/2.0 | 1,562 (+14%) | 23mo | $160,000 | $102 | 28 |
Match score weights: distance 35% · size 25% · config 20% · recency 20%. Top-matched comps best support the ARV.
Projected returns pro-forma
-3.0% appreciation · 3.04% rent growth · sell at horizon
- IRR
- -9.6%
- Equity multiple
- 0.65×
- Total profit
- $-13,801
- Equity at exit
- $20,860
- IRR
- -0.1%
- Equity multiple
- 0.99×
- Total profit
- $-396
- Equity at exit
- $12,096
Cash invested: $39,172 (down + closing). Projections, not guarantees.
Landlord ↔ Tenant lean methodology
- Overall (STATE)
- 90 Strongly Landlord-Friendly
- State Alabama
- 90 Strongly Landlord-Friendly · R+15
- County
- — inherits STATE
- City
- — inherits STATE
ZIP-level market 35215
- Home prices YoY
- -34.4%
- Rents YoY
- 3.0%
- Active inventory
- 334
- Price-to-rent
- 8.4×
Monthly cashflow live
- Estimated rent
- $1,389 high interval (Pro) →
- Mortgage (P&I)
- −$734
- Tax from tax record
- −$167 /mo · $2,007/yr
- Insurance
- −$58
- HOA
- −$0
- Vacancy / Maint / Mgmt
- −$292
- Net cashflow
- $138
Break-even live
UW: 25.0% down · 7.5% · 30yr · 1.5% tax · 5.0% vac · 8.0% maint · 8.0% mgmt
Financing live
Cash to close
- Down payment
- $34,975
- Closing costs
- $4,197
- Reserves months
- —
- Total cash needed
- —
Loan-product check · same deal, 3 products live
Conventional
25% down · 7.5% · 30yr
- Down + closing
- —
- Monthly P&I
- —
- Monthly cashflow
- —
- DSCR
- —
- Eligible?
- —
Personal DTI + credit; lowest rate.
DSCR
20% down · 8.5% · 30yr
- Down + closing
- —
- Monthly P&I
- —
- Monthly cashflow
- —
- DSCR
- —
- Eligible?
- —
No personal income docs; deal must DSCR.
Hard money
10% down · 12.0% · 12mo
- Down + closing
- —
- Monthly P&I
- —
- Monthly cashflow
- —
- DSCR
- —
- Eligible?
- —
Short-term bridge; refi at stabilization.
Rent comps 21 comps
| Address | Beds | Baths | Sqft | Rent | $/sqft | DOM | Units | Dist |
|---|---|---|---|---|---|---|---|---|
| 232 Glenvalley Ln NW Birmingham, AL | 4.0 | 2.0 | 954 | $1,610 | $1.69 | 2d | 1 | 0.40mi |
| 202 Westchester Dr Birmingham, AL | 4.0 | 2.0 | 1374 | $1,300 | $0.95 | 23d | 1 | 0.49mi |
| 2613 5th St NW Center Point, AL | 3.0 | 1.0 | 1170 | $1,150 | $0.98 | 11d | 1 | 0.59mi |
| 532 26th Ave NW Center Point, AL | 4.0 | 1.0 | 1644 | $1,250 | $0.76 | 43d | 1 | 0.71mi |
| 408 Sunhill Rd NW Center Point, AL | 3.0 | 1.5 | 1290 | $1,355 | $1.05 | 43d | 1 | 0.79mi |
| 5992 Princess Blvd Birmingham, AL | 3.0 | 2.0 | 1454 | $1,661 | $1.14 | 43d | 1 | 0.86mi |
| 127 Fox Hill Ct Center Point, AL | 3.0 | 2.0 | 1418 | $1,545 | $1.09 | 43d | 1 | 0.90mi |
| 2416 4th St NW Center Point, AL | 4.0 | 2.0 | 1400 | $1,500 | $1.07 | 23d | 1 | 0.91mi |
| 2412 4th St NW Center Point, AL | 3.0 | 1.0 | 1224 | $1,150 | $0.94 | 15d | 1 | 0.93mi |
| 3073 Panorama E Birmingham, AL | 1.0–3.0 | 1.0–2.0 | 975 | $1,275 | $1.31 | 1d | 20 | 0.98mi |
| 212 Saint John Dr NW Birmingham, AL | 2.0 | 2.0 | 1445 | $1,423 | $0.98 | 14d | 1 | 1.03mi |
| 3309 Chase Ln Unit 3309 Birmingham, AL | 2.0 | 2.0 | 1068 | $1,000 | $0.94 | 43d | 1 | 1.06mi |
| 149 Martin Dr Birmingham, AL | 3.0 | 2.0 | 1164 | $1,485 | $1.28 | 23d | 1 | 1.12mi |
| 2323 4th St NW Center Point, AL | 3.0 | 1.0 | 1038 | $1,305 | $1.26 | 2d | 1 | 1.17mi |
| 2320 5th St NW Center Point, AL | 3.0 | 1.0 | 1098 | $1,150 | $1.05 | 43d | 1 | 1.20mi |
| 109 24th Ave NW Center Point, AL | 3.0 | 1.5 | 1023 | $1,215 | $1.19 | 43d | 1 | 1.20mi |
| 2629 Wood Dr NE Center Point, AL | 3.0 | 1.0 | 1203 | $1,250 | $1.04 | 43d | 1 | 1.22mi |
| 319 23rd Ave NW Center Point, AL | 3.0 | 2.0 | 1284 | $1,395 | $1.09 | 43d | 1 | 1.31mi |
| 2245 3rd St NW Center Point, AL | 3.0 | 1.0 | 1156 | $1,100 | $0.95 | 23d | 1 | 1.32mi |
| 2537 3rd St NE Center Point, AL | 3.0 | 2.0 | 1040 | $1,350 | $1.30 | 23d | 1 | 1.35mi |
| 2318 Raintree Ct Center Point, AL | 2.0 | 1.0 | 975 | $1,100 | $1.13 | 2d | 2 | 1.38mi |
Listing history 7 events
-
2026-04-18$139,900 Active 611-char remark
Show marketing remark (611 chars)
Welcome to this charming split-level home in Birmingham offering 3 bedrooms and 2 full baths. This well-designed layout provides comfortable living with spacious rooms and great natural light throughout. The main level features an inviting living area, while the lower level offers additional flexible space perfect for a family room, office, or entertaining. The kitchen provides ample cabinetry and flows nicely into the dining area. Enjoy a generous yard ideal for outdoor activities, along with convenient access to local shopping, dining, and major roadways. A great opportunity to make this home your own!
-
2023-12-27soldstatus $1,590,000
-
2022-11-15soldstatus $126,200
-
2021-04-09soldstatus $124,900 52-char remark
Show marketing remark (52 chars)
Fully rehabbed and rented turn key rental property!!
-
2021-04-09$124,900 52-char remark
Show marketing remark (52 chars)
Fully rehabbed and rented turn key rental property!!
-
2020-12-11soldstatus $62,112
-
1989-07-24soldstatus $66,900
ⓘ Source: listings_history table (triggers on properties + properties_extension) + one-shot
backfill from property_details.listing_events for pre-trigger history.
Tax reassessment forecast AL · Resets to sale price
- Current annual tax
- $2,007 · $167/mo
- Projected year-2 tax
- $2,007 · $167/mo
- Expected delta
- $0/yr ($0/mo · -0.0%)
ⓘ Screening estimate from a state-policy table — verify with the county assessor before closing.
Climate risk First Street
- Flood 1/10 Low FEMA zone X (unshaded) · 0% chance over 30 yrs
- Wildfire 3/10 Moderate
- Heat 6/10 Major 7 d/yr ≥106°F today · 19 d/yr by 30 yrs out
- Wind 6/10 Major 27% chance of damaging wind over 30 yrs
- Air quality 5/10 Major 6 unhealthy d/yr today · 11 by 30 yrs out
Nearby sold comps map
Loading sold comps map…
Walkable amenities ~0.75 mi
Loading nearby amenities…
Taxation est. · year 1
- Rental income
- $16,668
- − Mortgage interest
- −$7,837
- − Property taxes
- −$2,007
- − Insurance
- −$700
- − Repairs & maintenance
- −$1,333
- − Management
- −$1,333
- − Depreciation
- −$4,070
- Taxable loss
- −$612
- Est. tax savings @ 24.0%
- +$147
- After-tax cash flow
- $1,804/yr
For passive investors: Depreciation is non-cash, so a rental often shows a tax loss while cash-flowing — sheltering income. Rental losses are passive: they offset passive income freely, and up to $25,000/yr can offset ordinary (W-2) income if you actively participate and your MAGI is under $100k (phasing out to $0 by $150k); unused losses carry forward. On sale, claimed depreciation is recaptured at up to 25%, and gains may owe capital-gains tax (a 1031 exchange can defer both). Figures are a year-1 estimate at your 24.0% rate — not tax advice; consult a CPA.
Schools (NCES district)
- District
- Birmingham City
- NCES district ID
- 0100390
- Math proficiency
- 4% ▼ -17.00%
- Reading proficiency
- 20% ▼ -4.00%
- Median HH income
- $31,988
- Composite
- 9.49/100
- National rank
- #9850
- State rank
- #116 of 129 in AL
Livability — Birmingham
- Score
- 67/100
- State rank
- #78
- US rank
- #10412
Category grades
Schools grade is shown separately in the Schools card above.
Census & demographics
- Census place
- Birmingham, AL
- County
- Jefferson County · 527,445 people
- City population
- 210,422
- Metro
- Birmingham-Hoover, AL
- Population (ZIP)
- 43,903
- Household income
- $52,793
- Rent vs Own
- Severe rent burden
- 1729.0
Population outlook (Jefferson County) Hauer SSP2
- Today (2025)
- 669,185 people
- By 2030
- 669,694 · +0.1%
- By 2040
- 661,388 · -1.2%
- By 2050
- 643,086 · -3.9%
- By 2075
- 577,267 · -13.7%
- By 2100
- 474,758 · -29.1%
Race, ethnicity, and origin ACS 2023
- Neighborhood character
- Predominantly Black (75%)
- Race & ethnicity
- Black 75% White 15% Hispanic / Latino 7% Two or more races 3%
- Hispanic origin (detail)
- Mexican 4%
- Common ancestry
- Lithuanian 1% Italian 1% Slovak 1%
- Foreign-born
- 4% · Canada
- Languages at home
- 92% English-only · Spanish 7%
Political lean MEDSL · Jefferson
- 2024 margin
- D (+10.4) · D 54.6% · R 44.2% · Other 1.2%
- 2008→2024 swing
- +5.4pp toward D · 2008: 5.1pp · 2024: 10.4pp
- All cycles
- 2024: D+10.4 2020: D+13.2 2016: D+7.2 2012: D+6.0 2008: D+5.1
Not yet ingested
- Civics
- —
Market trends
- HPI YoY
- ▼ -112.97%
- Current HPI
- 215.0607
- Rent YoY
- ▲ 3.04%
- Metro
- Birmingham-Hoover, AL
- State GDP YoY
- ▲ 2.94%
- F500 in state
- 4
Industry mix (Fortune 500 HQ in AL)
| Industry | F500 HQs | Revenue |
|---|---|---|
| Financial Services | 1 | $8B |
|
||
| Healthcare | 1 | $5B |
|
||
Price history
+109.1% since first listed7 events — show timeline
- 2026-04-18 Listed $139,900 Greater Alabama MLS
- 2023-12-27 Sold (Public Records) $1,590,000 Public Records
- 2022-11-15 Sold (Public Records) $126,200 Public Records
- 2021-04-09 Listed $124,900 Greater Alabama MLS
- 2021-04-09 Sold (MLS) $124,900 Greater Alabama MLS
- 2020-12-11 Sold (Public Records) $62,112 Public Records
- 1989-07-24 Sold (Public Records) $66,900 Public Records
Property tax history
+0.1%/yrLatest (2025): $2,007 · +0.0% YoY. Source: county tax records.
Cash-flow waterfall
monthlySold comps — $/sqft
last 12 mo · ≤1 miLoading sold comps…