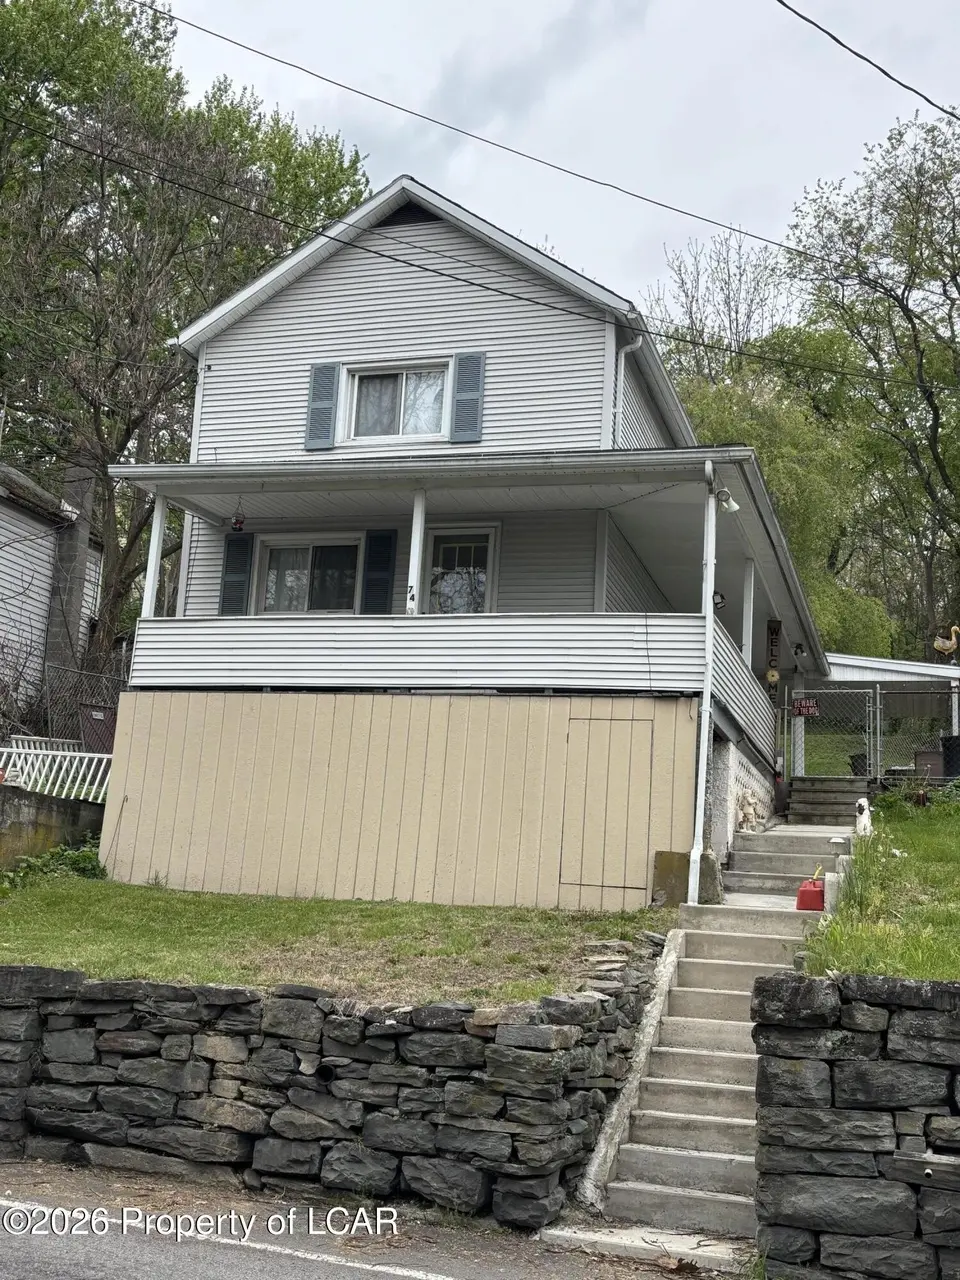
74 Smith Row · Plymouth, PA
Flood risk 1/10 · Minimal
- FEMA flood zone
- X (unshaded)
- Chance of flooding over 30 yrs
- 0.0%
- Est. flood insurance / yr
- $507 – $1,088
Fire risk 4/10 · Minor
- Est. fire insurance / yr
- $511 – $949
Heat risk 3/10 · Minor
- Hot days now (above 97°F)
- 7 days/yr
- Hot days in 30 yrs
- 16 days/yr
Wind risk 3/10 · Minor
- Chance of severe wind over 30 yrs
- 4.0%
Air-quality risk 1/10 · Minimal
- Unhealthy air days now
- 0 days/yr
- Unhealthy air days in 30 yrs
- 0 days/yr
Risk factors via First Street. Map © Google.
Why this score? — see what drove the C+ grade
The composite is a weighted blend of 9 inputs, each scored 0–100. Each bar is that input's sub-score; the figure is the points it added to the 100-point composite (weight × sub-score).
- Cash flow +25.1/30.0
- ARV discount +15.0/15.0
- DSCR +8.2/10.0
- 1% rule +6.0/10.0
- Livability +3.3/5.0
- Rent growth +2.5/5.0
- Condition / age +2.5/5.0
- Schools +2.0/10.0
- Appreciation +0.0/10.0
$131,900
🖨 Deal sheet 📄 Offer letter ✓ Due diligence
Listing remarks MLS
For records purposes only
Key facts
- Off street parking
- Rear yard
- Low taxes
Tags
Property features AI
Finance
- Financial info: Annual tax amount reported
Exterior
- Utilities: Public water
- Home design: Two-story single-family residence; Residential property; Vinyl siding
- Construction: Built area above grade: 1,925; Vinyl siding construction
- Exterior features: Deck; Patio; Porch
Interior
- Bathrooms: 1 full bathroom
- Heating & cooling: Oil heating with forced air
- Interior features: 6 total rooms; Basement with dirt floor
Neighborhood map
What this means for you Summary
Snapshot
- This is a 3-bed/1.0-bath single-family listed at $132k.
Deal economics
- At list price, monthly cash flow is $291 ($3k/yr) — positive.
- The deal already cash-flows at list — no discount required.
- Meets the 1% rule at list price ($1k rent vs $132k).
- Recommended offer: $128k (3.0% below list) — sets the bar for market timing.
Location & tenants
- Location reads 66/100 on livability (#1,068 in PA) — a middle-class / working-renter tenant base. Strengths: cost of living A+, health & safety A+, housing B+; Watch: employment D, crime F, amenities F.
- Greater Nanticoke Area SD (suburban): math 14% / reading 34% proficiency, ranked #479 of 539 in PA (top 89%) — low school quality limits family demand, transient renter base, plan for 1-2y turnover.
- Market conditions: 61 active listings in the ZIP; 8 comparable units currently listed for rent nearby; rentals leasing fast (median 14d on market — plan ~1-2 weeks tenant-placement turnaround); 349 units permitted in Luzerne County in 2024 (16 in 5+ unit buildings).
Forward outlook
- Local home prices are declining (-3.0%/yr); year-one equity from $912 of loan paydown is wiped out by about $4k of value loss. Plan a longer hold.
- Luzerne County population projected at +4% by 2050 — modest demand growth; plan on rents tracking national, not racing it.
Negotiation context
- It's been on market 35 days — a 3% lower offer ($128k) is reasonable based on typical stale-listing flexibility.
- 3 sale attempts since 7y ago with the ask held roughly flat each time — persistent listings suggest the price (not the market) is what's stuck; bring a comps-based counter.
Risks & watch-outs
- Watch-outs: built in 1900 — expect roof / HVAC / electrical / plumbing capex.
Questions for the listing agent
- It's been on market 35 days. Have you received any prior offers? Is the seller open to a 3% concession, seller financing, or rate buy-down credit?
- Built in 1900 — when were the roof, HVAC, electrical panel, plumbing, and water heater last replaced?
- Is there a deadline driving the sale (1031 exchange, divorce, estate, relocation)? That informs how much negotiation room exists.
- Crime grade is F in this area — have there been break-ins, vandalism, or insurance claims at this property in the last 3 years? What carrier currently insures it and at what premium?
- What's the average days-on-market for RENTAL listings here right now (not sales)? A rising rental-DOM trend means longer vacancies and softer asking-rent achievability than the comps imply.
- What's the recent tenant-quality profile in this submarket — average credit score on applications, eviction rate, late-payment / NSF rate, and stable-employment percentage? A property-management company in the area should have these aggregated.
- How much new for-sale + rental construction is in the pipeline within 1–3 miles? Heavy new supply typically softens prices + rents 12–24 months out; constrained supply supports both.
Investment metrics
- 1% rule
- 1.10% ✓
- Cap rate
- 8.94%
- Cash-on-cash
- 9.45%
- DSCR
- 1.42
- GRM
- 7.6
CMA / ARV
- ARV (median comp)
- $178,250
- List price
- $131,900
- Delta
- -26.00%
- Verdict
- UNDERPRICED
- Comps
- 20 within 1.0 mi
Show comp detail 12 sales within ~0.75 mi
| Address | Dist | Beds/Ba | Sqft | Sold | Price | $/sf | Match |
|---|---|---|---|---|---|---|---|
| 124 Mras St | 0.54mi | 3/1.5 | 1,260 (-0%) | 0mo | $189,000 | $150 | 72 |
| 926 Main St | 0.32mi | 3/2.0 | 1,202 (-5%) | 4mo | $170,000 | $141 | 70 |
| 968 Main St | 0.40mi | 3/1.0 | 1,330 (+5%) | 8mo | $89,900 | $68 | 66 |
| 684 Lee St | 0.25mi | 3/1.0 | 1,440 (+14%) | 3mo | $170,000 | $118 | 63 |
| 134 Reynolds St | 0.60mi | 2/1.0 (-1) | 1,302 (+3%) | 2mo | $150,000 | $115 | 60 |
| 341 Mountain Rd | 0.44mi | 3/1.0 | 1,378 (+9%) | 7mo | $121,900 | $88 | 58 |
| 343 Mountain Rd | 0.44mi | 2/1.0 (-1) | 1,182 (-6%) | 7mo | $100,000 | $85 | 58 |
| 52 Franklin St | 0.39mi | 3/1.0 | 1,434 (+14%) | 2mo | $155,000 | $108 | 58 |
| 358 Shawnee Ave | 0.67mi | 3/1.0 | 1,305 (+3%) | 7mo | $137,000 | $105 | 58 |
| 89 Coal St | 0.27mi | 3/1.0 | 1,088 (-14%) | 11mo | $115,000 | $106 | 55 |
| 122 Flat Rd | 0.56mi | 3/1.5 | 1,325 (+5%) | 11mo | $217,150 | $164 | 54 |
| 252 Orchard St | 0.68mi | 3/1.5 | 1,381 (+9%) | 7mo | $175,000 | $127 | 45 |
Match score weights: distance 35% · size 25% · config 20% · recency 20%. Top-matched comps best support the ARV.
Projected returns pro-forma
-3.0% appreciation · 3.0% rent growth · sell at horizon
- IRR
- -2.1%
- Equity multiple
- 0.92×
- Total profit
- $-2,870
- Equity at exit
- $19,667
- IRR
- 7.6%
- Equity multiple
- 1.58×
- Total profit
- $21,294
- Equity at exit
- $11,404
Cash invested: $36,932 (down + closing). Projections, not guarantees.
Landlord ↔ Tenant lean methodology
- Overall (STATE)
- 62 Landlord-Friendly
- State Pennsylvania
- 62 Landlord-Friendly · EVEN
- County
- — inherits STATE
- City
- — inherits STATE
ZIP-level market 18651
- Home prices YoY
- -11.5%
- Active inventory
- 61
- Price-to-rent
- 7.6×
Monthly cashflow live
- Estimated rent
- $1,452 high interval (Pro) →
- Mortgage (P&I)
- −$692
- Tax from tax record
- −$110 /mo · $1,321/yr
- Insurance
- −$55
- HOA
- −$0
- Vacancy / Maint / Mgmt
- −$305
- Net cashflow
- $291
Break-even live
UW: 25.0% down · 7.5% · 30yr · 1.5% tax · 5.0% vac · 8.0% maint · 8.0% mgmt
Financing live
Cash to close
- Down payment
- $32,975
- Closing costs
- $3,957
- Reserves months
- —
- Total cash needed
- —
Loan-product check · same deal, 3 products live
Conventional
25% down · 7.5% · 30yr
- Down + closing
- —
- Monthly P&I
- —
- Monthly cashflow
- —
- DSCR
- —
- Eligible?
- —
Personal DTI + credit; lowest rate.
DSCR
20% down · 8.5% · 30yr
- Down + closing
- —
- Monthly P&I
- —
- Monthly cashflow
- —
- DSCR
- —
- Eligible?
- —
No personal income docs; deal must DSCR.
Hard money
10% down · 12.0% · 12mo
- Down + closing
- —
- Monthly P&I
- —
- Monthly cashflow
- —
- DSCR
- —
- Eligible?
- —
Short-term bridge; refi at stabilization.
Rent comps 8 comps
| Address | Beds | Baths | Sqft | Rent | $/sqft | DOM | Units | Dist |
|---|---|---|---|---|---|---|---|---|
| 18 North St Plymouth, PA | 2.0 | 1.0 | 1200 | $1,300 | $1.08 | 13d | 1 | 0.20mi |
| 657 W Main St Plymouth, PA | 3.0 | 1.0 | 1600 | $1,700 | $1.06 | 13d | 1 | 0.38mi |
| 29 Franklin St Plymouth, PA | 3.0 | 1.0 | 1426 | $1,800 | $1.26 | 13d | 1 | 0.41mi |
| 134 Blair St Plymouth, PA | 3.0 | 1.0 | 1300 | $1,300 | $1.00 | 21d | 1 | 0.42mi |
| 463 2nd St Plymouth, PA | 3.0 | 1.0 | 1250 | $1,500 | $1.20 | 44d | 1 | 0.56mi |
| 338 W Shawnee Ave Plymouth, PA | 2.0 | 1.5 | 945 | $1,550 | $1.64 | 13d | 1 | 0.72mi |
| 210-212 Center Ave Plymouth, PA | 3.0 | 1.0 | 1300 | $1,200 | $0.92 | 44d | 1 | 1.08mi |
| 48 E Shawnee Ave Plymouth, PA | 3.0 | 1.0 | 1500 | $1,250 | $0.83 | 13d | 1 | 1.16mi |
Listing history 10 events
-
2026-06-07statusdays on market $131,900 Pending 35 DOM
-
2026-06-05days on market $131,900 Active 33 DOM
-
2026-06-02days on market $131,900 Active 31 DOM
-
2026-06-01days on market $131,900 Active 30 DOM
-
2026-05-31days on market $131,900 Active 29 DOM
-
2026-05-30days on market $131,900 Active 28 DOM
-
2026-05-02$131,900 Active 328-char remark
-
2019-08-30soldstatus $15,000 25-char remark
Show marketing remark (25 chars)
For records purposes only
-
2019-08-30$15,000 25-char remark
Show marketing remark (25 chars)
For records purposes only
-
2019-06-22$28,900
ⓘ Source: listings_history table (triggers on properties + properties_extension) + one-shot
backfill from property_details.listing_events for pre-trigger history.
Tax reassessment forecast PA · Partial reset (capped growth)
- Current annual tax
- $1,321 · $110/mo
- Projected year-2 tax
- $1,703 · $142/mo
- Expected delta
- +$381/yr (+$32/mo · 28.9%)
ⓘ Screening estimate from a state-policy table — verify with the county assessor before closing.
Climate risk First Street
- Flood 1/10 Low FEMA zone X (unshaded) · 0% chance over 30 yrs
- Wildfire 4/10 Moderate
- Heat 3/10 Moderate 7 d/yr ≥97°F today · 16 d/yr by 30 yrs out
- Wind 3/10 Moderate 4% chance of damaging wind over 30 yrs
- Air quality 1/10 Low 0 unhealthy d/yr today · 0 by 30 yrs out
Nearby sold comps map
Loading sold comps map…
Walkable amenities ~0.75 mi
Loading nearby amenities…
Taxation est. · year 1
- Rental income
- $17,430
- − Mortgage interest
- −$7,388
- − Property taxes
- −$1,321
- − Insurance
- −$660
- − Repairs & maintenance
- −$1,394
- − Management
- −$1,394
- − Depreciation
- −$3,837
- Taxable income
- $1,435
- Est. tax owed @ 24.0%
- −$344
- After-tax cash flow
- $3,144/yr
For passive investors: Depreciation is non-cash, so a rental often shows a tax loss while cash-flowing — sheltering income. Rental losses are passive: they offset passive income freely, and up to $25,000/yr can offset ordinary (W-2) income if you actively participate and your MAGI is under $100k (phasing out to $0 by $150k); unused losses carry forward. On sale, claimed depreciation is recaptured at up to 25%, and gains may owe capital-gains tax (a 1031 exchange can defer both). Figures are a year-1 estimate at your 24.0% rate — not tax advice; consult a CPA.
Schools (NCES district)
- District
- Greater Nanticoke Area SD
- NCES district ID
- 4216290
- Math proficiency
- 14% ▼ -8.00%
- Reading proficiency
- 34% ▼ -14.00%
- Median HH income
- $38,990
- Composite
- 20.1/100
- National rank
- #8647
- State rank
- #479 of 539 in PA
Livability — Plymouth
- Score
- 66/100
- State rank
- #1068
- US rank
- #12056
Category grades
Schools grade is shown separately in the Schools card above.
Census & demographics
- Population (ZIP)
- 8,672
Population outlook (Luzerne County) Hauer SSP2
- Today (2025)
- 319,505 people
- By 2030
- 319,943 · +0.1%
- By 2040
- 322,643 · +1.0%
- By 2050
- 330,817 · +3.5%
- By 2075
- 379,145 · +18.7%
- By 2100
- 431,908 · +35.2%
Race, ethnicity, and origin ACS 2023
- Neighborhood character
- Predominantly White (82%)
- Race & ethnicity
- White 82% Hispanic / Latino 10% Black 5% Two or more races 4%
- Hispanic origin (detail)
- Mexican 3% Dominican 5%
- Common ancestry
- Romanian 19% Scotch-Irish 2% Iranian 2%
- Foreign-born
- 5% · Canada
- Languages at home
- 91% English-only · Spanish 7% Other Indo-European 1%
Political lean MEDSL · Luzerne
- 2024 margin
- R (+19.2) · D 40.0% · R 59.2%
- 2008→2024 swing
- -27.6pp toward R · 2008: 8.4pp · 2024: -19.2pp
- All cycles
- 2024: R+19.2 2020: R+14.4 2016: R+19.6 2012: D+4.8 2008: D+8.4
Not yet ingested
- Civics
- —
Market trends
- HPI YoY
- ▼ -29.78%
- Current HPI
- 229.6791
- Rent YoY
- —
- Metro
- —
- State GDP YoY
- ▲ 1.68%
- F500 in state
- 34
Industry mix (Fortune 500 HQ in PA)
| Industry | F500 HQs | Revenue |
|---|---|---|
| Healthcare | 2 | $309B |
|
||
| Insurance | 2 | $27B |
|
||
| Telecommunications / Media | 1 | $124B |
|
||
| Industrial Distribution | 1 | $22B |
|
||
| Financial Services | 1 | $20B |
|
||
| Chemicals / Materials | 1 | $18B |
|
||
Price history
+384.4% since first listed6 events — show timeline
- 2026-06-12 Sold (MLS) $140,000 LCAR
- 2026-06-06 Pending — LCAR
- 2026-05-02 Listed $131,900 LCAR
- 2019-08-30 Listed $15,000 LCAR
- 2019-08-30 Sold (MLS) $15,000 LCAR
- 2019-06-22 Listed $28,900 LCAR
Property tax history
+1.5%/yrLatest (2026): $1,321 · +0.5% YoY. Source: county tax records.
Cash-flow waterfall
monthlySold comps — $/sqft
last 12 mo · ≤1 miLoading sold comps…