1221 N Dysart Rd #2 · Avondale, AZ
Flood risk 1/10 · Minimal
- FEMA flood zone
- X (shaded)
- Chance of flooding over 30 yrs
- 0.0%
- Est. flood insurance / yr
- $507 – $1,088
Fire risk 5/10 · Moderate
- Est. fire insurance / yr
- $610 – $1,132
Heat risk 9/10 · Severe
- Hot days now (above 113°F)
- 7 days/yr
- Hot days in 30 yrs
- 18 days/yr
Wind risk 1/10 · Minimal
- Chance of severe wind over 30 yrs
- —
Air-quality risk 2/10 · Minimal
- Unhealthy air days now
- 0 days/yr
- Unhealthy air days in 30 yrs
- 1 days/yr
Risk factors via First Street. Map © Google.
Why this score? — see what drove the B+ grade
The composite is a weighted blend of 9 inputs, each scored 0–100. Each bar is that input's sub-score; the figure is the points it added to the 100-point composite (weight × sub-score).
- Cash flow +30.0/30.0
- ARV discount +15.0/15.0
- 1% rule +10.0/10.0
- DSCR +10.0/10.0
- Condition / age +3.8/5.0
- Livability +3.6/5.0
- Schools +2.8/10.0
- Rent growth +2.6/5.0
- Appreciation +0.0/10.0
$43,500
🖨 Deal sheet (PDF) 📄 Offer letter ✓ Due diligence
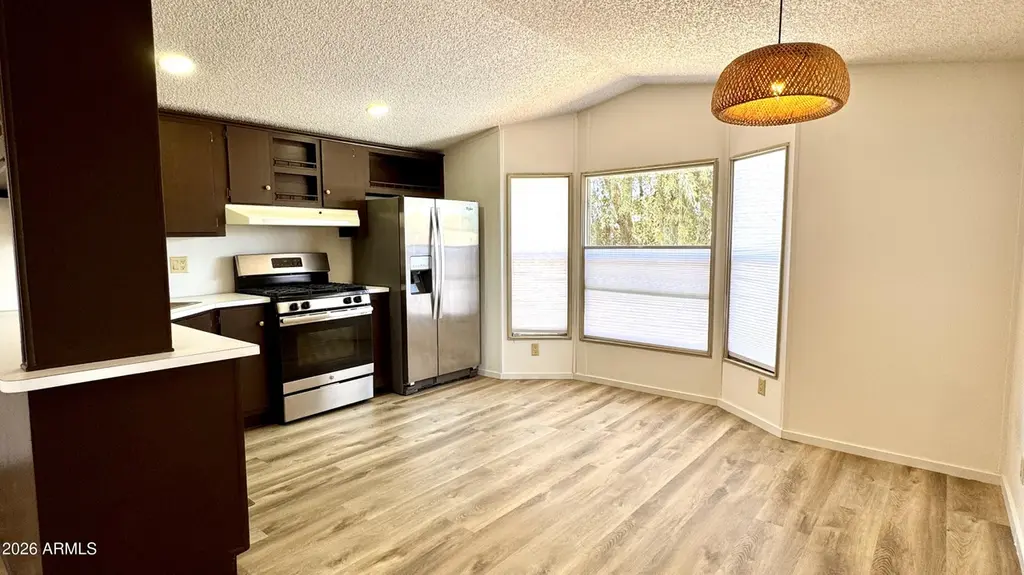
Listing remarks
Beautifully remodeled Home. See this very clean home with all new flooring. New interior and exterior paint. Clean Lot and close to I-10 freeway. Low monthly Lot rent and low price makes this home a great value! See it today.
Key facts
- New exterior paint
- New flooring
- Clean lot
Tags
Property features AI
Finance
- HOA & community: Land lease of $700 per month; Association fee includes street maintenance; Land lease community
Exterior
- Parking: 2 open parking spaces; Assigned parking
- Utilities: City water; Private sewer
- Home design: Manufactured/mobile housing; Leasehold ownership; Asphalt road access
- Construction: Wood frame construction; Painted exterior; Composition roof; Block fencing
- Exterior features: Gravel/stone front yard; Gravel/stone back yard; Private maintained road
Interior
- Bedrooms: 2 possible bedrooms
- Flooring: Carpet flooring; Vinyl flooring
- Bathrooms: 1 full bathroom
- Heating & cooling: Natural gas heating; Central air conditioning; Ceiling fans
- Interior features: High-speed internet available; Eat-in kitchen; Other interior features
Neighborhood map
What this means for you Summary
Snapshot
- This is a 2-bed/1.0-bath manufactured listed at $44k. Condition is rated good.
Deal economics
- At list price, monthly cash flow is $821 ($10k/yr) — positive.
- The deal already cash-flows at list — no discount required.
- Meets the 1% rule at list price ($1k rent vs $44k).
- Recommended offer: $43k (1.5% below list) — sets the bar for market timing.
- Cap rate 28.9% vs local median 3.4% in Avondale — top-decile yield for the area; either an underpriced asset or a hidden risk that comps aren't pricing in. Stress-test before assuming the spread holds.
Location & tenants
- Location reads 72/100 on livability (#29 in AZ) — a middle-class / working-renter tenant base. Strengths: housing A+, commute A; Watch: health & safety C-, crime D+, amenities F.
- Agua Fria Union High School District (4289) (suburban): math 24% / reading 37% proficiency, ranked #99 of 249 in AZ (top 40%) — families likely to look elsewhere, expect single-tenant / working-renter base with shorter leases.
- Zoned schools: Agua Fria High School (math 15% / reading 26%, grade F, #222 of 381 statewide, top 59%, 1,652 students, 62% FRL).
- Market conditions: Rents flat; 316 active listings in the ZIP; 20 comparable units currently listed for rent nearby; rentals leasing fast (median 2d on market — plan ~1-2 weeks tenant-placement turnaround); solid renter incomes; 36,011 units permitted in Maricopa County in 2024 (12,801 in 5+ unit buildings).
Forward outlook
- Local home prices are declining (-3.0%/yr); year-one equity from $301 of loan paydown is wiped out by about $1k of value loss. Plan a longer hold.
- Maricopa County population projected at +38% by 2050 — long-run rental-demand tailwind backs the buy-and-hold thesis.
- At projected returns (-3.0% appreciation + 0.3% rent growth), your $12k cash investment doubles in ~2 years — after that, you're playing with house money.
Negotiation context
- It's been on market 25 days — a 2% lower offer ($43k) is reasonable based on typical stale-listing flexibility.
Risks & watch-outs
- Climate carrying-cost: moderate wildfire risk; extreme-heat days projected 7→18/yr by 2055 (HVAC capex compounding) — expect insurance premiums to compound above CPI over the hold.
Questions for the listing agent
- Is there a deadline driving the sale (1031 exchange, divorce, estate, relocation)? That informs how much negotiation room exists.
- Crime grade is D in this area — have there been break-ins, vandalism, or insurance claims at this property in the last 3 years? What carrier currently insures it and at what premium?
- What's the average days-on-market for RENTAL listings here right now (not sales)? A rising rental-DOM trend means longer vacancies and softer asking-rent achievability than the comps imply.
- What's the recent tenant-quality profile in this submarket — average credit score on applications, eviction rate, late-payment / NSF rate, and stable-employment percentage? A property-management company in the area should have these aggregated.
- How much new for-sale + rental construction is in the pipeline within 1–3 miles? Heavy new supply typically softens prices + rents 12–24 months out; constrained supply supports both.
Investment metrics
- 1% rule
- 3.26% ✓
- Cap rate
- 28.95%
- Cash-on-cash
- 80.91%
- DSCR
- 4.60
- GRM
- 2.6
CMA / ARV
- ARV (on-the-fly)
- $78,208
- Comps found
- 2
Show comp detail 2 sales within ~0.75 mi
| Address | Dist | Beds/Ba | Sqft | Sold | Price | $/sf | Match |
|---|---|---|---|---|---|---|---|
| 1221 N Dysart Rd #37 | 0.14mi | 3/2.0 (+1) | 800 (-4%) | 13mo | $75,000 | $94 | 68 |
| 805 N Dysart Rd #33 | 0.33mi | 2/2.0 | 924 (+11%) | 2mo | $53,000 | $57 | 60 |
Match score weights: distance 35% · size 25% · config 20% · recency 20%. Top-matched comps best support the ARV.
Projected returns pro-forma
-3.0% appreciation · 0.34% rent growth · sell at horizon
- IRR
- 78.1%
- Equity multiple
- 4.41×
- Total profit
- $41,572
- Equity at exit
- $6,486
- IRR
- 81.0%
- Equity multiple
- 8.33×
- Total profit
- $89,231
- Equity at exit
- $3,761
Cash invested: $12,180 (down + closing). Projections, not guarantees.
Landlord ↔ Tenant lean methodology
- Overall (STATE)
- 87 Strongly Landlord-Friendly
- State Arizona
- 87 Strongly Landlord-Friendly · R+3
- County
- — inherits STATE
- City
- — inherits STATE
ZIP-level market 85323
- Home prices YoY
- -27.1%
- Rents YoY
- 0.3%
- Active inventory
- 316
- Price-to-rent
- 2.6×
Monthly cashflow live
- Estimated rent
- $1,420 high interval (Pro) →
- Mortgage (P&I)
- −$228
- Tax est. 1.5%
- −$54 /mo · $652/yr
- Insurance
- −$18
- HOA
- −$0
- Vacancy / Maint / Mgmt
- −$298
- Net cashflow
- $821
Break-even live
Sensitivity live
| Price | -10% $851 | -5% $836 | +0% $821 | +5% $806 | +10% $791 |
|---|---|---|---|---|---|
| Rent | -10% $709 | -5% $765 | +0% $821 | +5% $877 | +10% $933 |
| Rate | -1.0pp $843 | -0.5pp $832 | base $821 | +0.5pp $810 | +1.0pp $798 |
UW: 25.0% down · 7.5% · 30yr · 1.5% tax · 5.0% vac · 8.0% maint · 8.0% mgmt
Financing live
Cash to close
- Down payment
- $10,875
- Closing costs
- $1,305
- Reserves months
- —
- Total cash needed
- —
Loan-product check · same deal, 3 products live
Conventional
25% down · 7.5% · 30yr
- Down + closing
- —
- Monthly P&I
- —
- Monthly cashflow
- —
- DSCR
- —
- Eligible?
- —
Personal DTI + credit; lowest rate.
DSCR
20% down · 8.5% · 30yr
- Down + closing
- —
- Monthly P&I
- —
- Monthly cashflow
- —
- DSCR
- —
- Eligible?
- —
No personal income docs; deal must DSCR.
Hard money
10% down · 12.0% · 12mo
- Down + closing
- —
- Monthly P&I
- —
- Monthly cashflow
- —
- DSCR
- —
- Eligible?
- —
Short-term bridge; refi at stabilization.
Rent comps 20 comps
| Address | Beds | Baths | Sqft | Rent | $/sqft | DOM | Units | Dist |
|---|---|---|---|---|---|---|---|---|
| 333 E Van Buren St Avondale, AZ | 2.0 | 1.0–2.0 | 574 | $1,365 | $2.38 | 2d | 12 | 0.40mi |
| 1425 N Palo Verde Dr Goodyear, AZ | 2.0 | 1.0 | 847 | $1,250 | $1.48 | 2d | 4 | 0.44mi |
| 526 N 4th St Unit B Avondale, AZ | 2.0 | 1.0 | 858 | $1,150 | $1.34 | 2d | 1 | 0.50mi |
| 522 N 4th St Unit A Avondale, AZ | 2.0 | 1.0 | 858 | $1,150 | $1.34 | 2d | 1 | 0.52mi |
| 103 E Brinker Dr Avondale, AZ | 3.0 | 1.0 | 900 | $1,150 | $1.28 | 2d | 3 | 0.64mi |
| 312 E Kinderman Dr Unit 1 Avondale, AZ | 2.0 | 1.0 | 717 | $1,375 | $1.92 | 20d | 1 | 0.68mi |
| 1701 N Palo Verde Dr Goodyear, AZ | 2.0 | 1.0 | 760 | $1,195 | $1.57 | 2d | 2 | 0.70mi |
| 1408 N Central Ave Avondale, AZ | 2.0–3.0 | 1.5–2.0 | 1050 | $1,284 | $1.22 | 2d | 12 | 0.76mi |
| 1737 N Central Ave Goodyear, AZ | 1.0–3.0 | 1.0–2.0 | 1009 | $1,544 | $1.53 | 2d | 15 | 0.83mi |
| 12375 W Van Buren St Avondale, AZ | 1.0–3.0 | 1.0–2.0 | 1044 | $1,811 | $1.73 | 2d | 47 | 0.85mi |
| 12721 W Buckeye Rd Avondale, AZ | 2.0–3.0 | 2.0 | 983 | $1,497 | $1.52 | 2d | 6 | 0.88mi |
| 1322 N La Jolla Blvd Goodyear, AZ | 1.0 | 1.0 | 575 | $1,170 | $2.03 | 2d | 4 | 0.89mi |
| 207 S 3rd St Unit 11 Avondale, AZ | 2.0 | 1.0 | 950 | $1,000 | $1.05 | 2d | 1 | 0.94mi |
| 231 S 1st St Unit 1 Avondale, AZ | 2.0 | 1.0 | 1050 | $1,600 | $1.52 | 2d | 1 | 1.03mi |
| 620 N Litchfield Rd Goodyear, AZ | 1.0–3.0 | 1.0–2.0 | 802 | $1,532 | $1.91 | 2d | 14 | 1.09mi |
| 13015 W Rancho Santa Fe Blvd Avondale, AZ | 1.0–3.0 | 1.0–2.0 | 971 | $1,484 | $1.53 | 2d | 22 | 1.15mi |
| 12115 W Van Buren St Avondale, AZ | 1.0 | 1.0 | 754 | $1,195 | $1.58 | 2d | 1 | 1.15mi |
| 12115 W Van Buren St Avondale, AZ | 1.0 | 1.0 | 729 | $1,263 | $1.73 | 6d | 1 | 1.15mi |
| 12115 W Van Buren St Avondale, AZ | 1.0 | 1.0 | 754 | $1,155 | $1.53 | 17d | 1 | 1.15mi |
| 102 S 4th Ave Avondale, AZ | 1.0–3.0 | 1.0–2.0 | 853 | $1,550 | $1.82 | 2d | 26 | 1.24mi |
Listing history 16 events
-
2026-06-21pricedays on market $43,500 Active 25 DOM
-
2026-06-18days on market $44,500 Active 22 DOM
-
2026-06-17days on market $44,500 Active 21 DOM
-
2026-06-16days on market $44,500 Active 20 DOM
-
2026-06-15days on market $44,500 Active 19 DOM
-
2026-06-13days on market $44,500 Active 17 DOM
-
2026-06-13days on market $44,500 Active 16 DOM
-
2026-06-09days on market $44,500 Active 13 DOM
-
2026-06-08days on market $44,500 Active 12 DOM
-
2026-06-07days on market $44,500 Active 11 DOM
-
2026-06-04days on market $44,500 Active 8 DOM
-
2026-06-03days on market $44,500 Active 7 DOM
-
2026-06-02days on market $44,500 Active 6 DOM
-
2026-06-01days on market $44,500 Active 5 DOM
-
2026-05-31days on market $44,500 Active 4 DOM
-
2026-05-27$44,500 Active
ⓘ Source: listings_history table (triggers on properties + properties_extension) + one-shot
backfill from property_details.listing_events for pre-trigger history.
Climate risk First Street
- Flood 1/10 Low FEMA zone X (shaded) · 0% chance over 30 yrs
- Wildfire 5/10 Major
- Heat 9/10 Extreme 7 d/yr ≥113°F today · 18 d/yr by 30 yrs out
- Wind 1/10 Low
- Air quality 2/10 Low 0 unhealthy d/yr today · 1 by 30 yrs out
Nearby sold comps map
Loading sold comps map…
Walkable amenities ~0.75 mi
Loading nearby amenities…
Taxation est. · year 1
- Rental income
- $17,040
- − Mortgage interest
- −$2,437
- − Property taxes
- −$652
- − Insurance
- −$218
- − Repairs & maintenance
- −$1,363
- − Management
- −$1,363
- − Depreciation
- −$1,265
- Taxable income
- $9,742
- Est. tax owed @ 24.0%
- −$2,338
- After-tax cash flow
- $7,516/yr
For passive investors: Depreciation is non-cash, so a rental often shows a tax loss while cash-flowing — sheltering income. Rental losses are passive: they offset passive income freely, and up to $25,000/yr can offset ordinary (W-2) income if you actively participate and your MAGI is under $100k (phasing out to $0 by $150k); unused losses carry forward. On sale, claimed depreciation is recaptured at up to 25%, and gains may owe capital-gains tax (a 1031 exchange can defer both). Figures are a year-1 estimate at your 24.0% rate — not tax advice; consult a CPA.
Condition & rehab AI · 6 photos
This beautifully remodeled home features new flooring, updated appliances, and fresh paint, making it move-in ready and a great value for both resale and rental.
Value-add opportunities
- Both Painting exterior and interior walls — Enhances curb appeal and interior aesthetics.
- Both Upgrading lighting fixtures — Improves ambiance and energy efficiency.
- Both Adding smart home features — Enhances convenience and marketability for both buyers and renters.
Renovation cost estimate screening
Value-add ROI direction
- Both Painting exterior and interior walls — Enhances curb appeal and interior aesthetics. ↑
- Both Upgrading lighting fixtures — Improves ambiance and energy efficiency. ↑
- Both Adding smart home features — Enhances convenience and marketability for both buyers and renters. ↑
ⓘ Cost ranges are severity-bucket heuristics (US national rule-of-thumb). Get contractor quotes + a written scope before underwriting a rehab budget.
Schools (NCES district)
- District
- Agua Fria Union High School District (4289)
- NCES district ID
- 0400450
- Math proficiency
- 24% ▼ -32.00%
- Reading proficiency
- 37% ▼ -12.00%
- Median HH income
- $64,107
- Composite
- 27.92/100
- National rank
- #6865
- State rank
- #99 of 249 in AZ
Livability — Avondale
- Score
- 72/100
- State rank
- #29
- US rank
- #6100
Category grades
Schools grade is shown separately in the Schools card above.
Census & demographics
- Census place
- Avondale, AZ
- County
- Maricopa County · 4,537,380 people
- City population
- 86,122
- Metro
- Phoenix-Mesa-Chandler, AZ
- Population (ZIP)
- 47,043
- Household income
- $83,120
- Rent vs Own
- Severe rent burden
- 1506.0
Population outlook (Maricopa County) Hauer SSP2
- Today (2025)
- 4,979,203 people
- By 2030
- 5,378,229 · +8.0%
- By 2040
- 6,156,598 · +23.6%
- By 2050
- 6,872,376 · +38.0%
- By 2075
- 8,401,270 · +68.7%
- By 2100
- 9,247,439 · +85.7%
Race, ethnicity, and origin ACS 2023
- Neighborhood character
- Diverse neighborhood (Simpson 0.58)
- Race & ethnicity
- Hispanic / Latino 60% Two or more races 26% White 22% Black 13% Asian 2% Native American 2%
- Hispanic origin (detail)
- Mexican 52% Puerto Rican 1%
- Common ancestry
- Italian 2% Portuguese 1% Ukrainian 1%
- Foreign-born
- 19% · Canada, Vietnam
- Languages at home
- 53% English-only · Spanish 42% Arabic 1% Tagalog/Filipino 1%
Political lean MEDSL · Maricopa
- 2024 margin
- Toss-up / Even · D 47.7% · R 51.2% · Other 1.1%
- 2008→2024 swing
- +7.1pp toward D · 2008: -10.6pp · 2024: -3.5pp
- All cycles
- 2024: R+3.5 2020: D+2.2 2016: R+3.5 2012: R+12.0 2008: R+10.6
Not yet ingested
- Civics
- —
Market trends
- HPI YoY
- ▼ -118.44%
- Current HPI
- 319.3653
- Rent YoY
- ▲ 0.34%
- Metro
- Phoenix-Mesa-Chandler, AZ
- State GDP YoY
- ▲ 4.54%
- F500 in state
- 20
Industry mix (Fortune 500 HQ in AZ)
| Industry | F500 HQs | Revenue |
|---|---|---|
| Technology | 2 | $13B |
|
||
| Mining / Metals | 1 | $23B |
|
||
| Environmental Services | 1 | $16B |
|
||
| Metals / Steel | 1 | $14B |
|
||
| Technology Distribution | 1 | $9B |
|
||
| Homebuilding | 1 | $8B |
|
||
Price history
1 event — show timeline
- 2026-05-27 Listed $44,500 ARMLS
Cash-flow waterfall
monthlySold comps — $/sqft
last 12 mo · ≤1 miLoading sold comps…